TitleMax INVESTMENT OFFERING. Todd Bunke South Western Avenue Blue Island, IL 60406
|
|
|
- Clifton Gibson
- 6 years ago
- Views:
Transcription


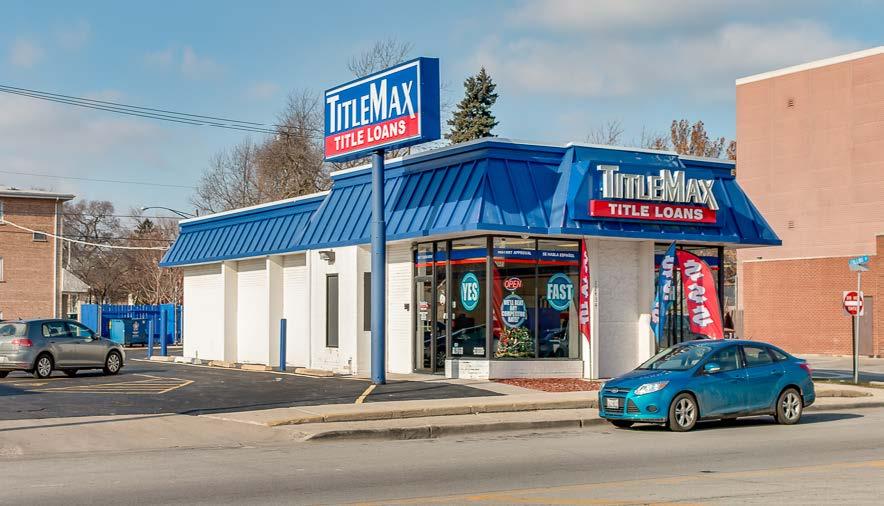
1 INVESTMENT OFFERING TitleMax South Western Avenue Blue Island, IL Todd Bunke
2 Confidentiality Agreement This is a confidential Memorandum intended solely for your limited use and benefit in determining whether you desire to express further interest in the acquisition of the Property. This Memorandum contains selected information pertaining to the Property and does not purport to be a representation of the state of affairs of the Property or the owner of the Property (the Owner ), to be allinclusive or to contain all or part of the information which prospective investors may require to evaluate a purchase of real property. All financial projections and information are provided for general reference purposes only and are based on assumptions relating to the general economy, market conditions, competition and other factors beyond the control of the Owner and/or Atlanta Real Estate Group. Therefore, all projections, assumptions and other information provided and made herein are subject to material variation. All references to acreages, square footages, and other measurements are approximations. Additional information and an opportunity to inspect the Property will be made available to interested and qualified prospective purchasers. In this Memorandum, certain documents, including leases and other materials, are described in summary form. These summaries do not purport to be complete nor necessarily accurate descriptions of the full agreements referenced. Interested parties are expected to review all such summaries and other documents of whatever nature independently and not rely on the contents of this Memorandum in any manner. Neither the Owner nor Atlanta Real Estate Group make any representation or warranty, expressed or implied, as to the accuracy or completeness of this Memorandum or any of its contents, and no legal commitment or obligation shall arise by reason of your receipt of this Memorandum or use of its contents; and you are to rely solely on your investigations and inspections of the Property in evaluating a possible purchase of the real property. The Owner expressly reserves the right, at its sole discretion, to reject any or all expressions of interest or offers to purchase the Property, and/or to terminate discussions with any entity at any time with or without notice which may arise as a result of review of this Memorandum. The Owner shall have no legal commitment or obligation to any entity reviewing this Memorandum or making an offer to purchase the Property unless and until written agreement(s) for the purchase of the Property have been fully executed, delivered and approved by the Owner and any conditions to the Owner s obligations therein have been satisfied or waived. By receipt of this Memorandum, you agree that this Memorandum and its contents are of a confidential nature, that you will hold and treat it in the strictest confidence and that you will not disclose this Memorandum or any of its contents to any other entity without the prior written authorization of the Owner or Atlanta Real Estate Group. You also agree that you will not use this Memorandum or any of its contents in any manner detrimental to the interest of the Owner or Atlanta Real Estate Group Atlanta Real Estate Group 2

3 Table of Contents Financial Overview... 4 Tenant Overview... 5 Investment Overview... 6 Maps Photos Demographics

4 Financial Overview PRICING SUMMARY Price $462,060 CAP Rate 8.25% South Western Ave, Blue Island, IL LEASE SUMMARY Tenant TitleMax Lease Type NN Commencement Date June 1, 2012 Lease Expiration Date May 31, 2022 Roof & Parking Lot Landlord Responsible ANNUALIZED OPERATING DATA INCOME Base Rent $39,082 Real Estate Tax Escrow $48,896 Total Income $87,978 EXPENSES Real Estate Tax $48,896 Parking Lot Reserves $500 Total Expenses $49,396 NET OPERATING INCOME $38,583 4
5 Tenant Overview TitleMax, Inc. is a privately held title lending business based in Savannah, Georgia. The company has more than 1150 stores in eighteen states. TitleMax serves individuals who generally have limited access to consumer credit from banks, thrift institutions, credit card lender and other traditional sources of consumer credit. TitleMax offers a title loan product which allows customers to meet their liquidity needs by borrowing against the value of their vehicles while retaining use of their vehicle during the term of the loan. In September 1998, TitleMax opened the first location in Columbus, Georgia. In October 1998, TitleMax opened its second location in Savannah, Georgia. Many Savannah locations were then established, and later that year, TitleMax opened the first out-of-state store in Phenix City, Alabama. Over the next ten years, the company continued expanding, eventually growing to over 500 locations by the end of 2007, and surpassing $200,000,000 in account receivables. 5

6 Investment Overview INVESTMENT HIGHLIGHTS High Grossing TitleMax Located in a Suburb of Chicago NN Lease with 5+ Years Remaining Tenant Just Renewed Early for 5 Years Tenant Reimburses for all Taxes, Insurance & CAM Expenses Roof Replaced in 2015 Located on Main Street of Blue Island INVESTMENT SUMMARY Atlanta Real Estate Group is pleased to present this freestanding TitleMax located in Blue Island, Cook County, Illinois. Blue Island is a densely populated suburb located just south of Chicago and less than eight miles west of the Indiana state border. This highly successful TitleMax is located on a main thoroughfare of Blue Island with over 300,000 residents within a 5 mile radius. The tenant signed a five year NN lease in June 2012 that was recently extended for an additional five years through Under the lease, the tenant is responsible for the payment of all taxes, insurance and CAM on the property. The landlord is responsible for maintaining the roof and parking lot. The roof was just replaced in 2015 and is warrantied. The lease is guaranteed by TitleMax of Illinois, Inc. 6

7 Regional Map 7

8 Local Map 8

9 9

10 10

11 11

12 12

13 13

14 14
15 15

16 16

17 17

18 18

19 19

20 20
21 Demographics S Western Ave, Blue Island, IL Mile Radius 3 Mile Radius 5 Mile Radius Population Current Estimated Population 2021 Projected Population 2010 Census Population 2000 Census Population 1990 Census Population Historical Annual Growth 1990 to 2000 Historical Annual Growth 2000 to 2010 Estimated Annual Growth 2010 to 2016 Projected Annual Growth 2016 to ,951 10,534 10,923 9,938 9, % 0.95 % 0.04 % % 107, , , , , % % % % 310, , , , , % % % % Households Current Estimated Households 2021 Projected Households 2010 Census Households 2000 Census Households 1990 Census Households Historical Annual Growth 1990 to 2000 Historical Annual Growth 2000 to 2010 Estimated Annual Growth 2010 to 2016 Projected Annual Growth 2016 to ,369 3,242 3,359 3,496 3, % % 0.05 % % 36,229 34,627 36,681 38,591 38, % % % % 108, , , , , % % % % Persons per Household Income HH Income $500,000 or more HH Income $250,000 to $499,999 HH Income $200,000 to $249,999 HH Income $175,000 to $199,999 HH Income $150,000 to $174,999 HH Income $100,000 to $149,999 HH Income $75,000 to $99,999 HH Income $50,000 to $74,999 HH Income $35,000 to $49,999 HH Income $25,000 to $34,999 HH Income $15,000 to $24,999 HH Income $0 to $14, % 0.40 % 0.28 % 0.78 % 1.00 % 4.72 % 5.22 % % % % % % 0.05 % 0.45 % 0.33 % 0.72 % 0.99 % 7.31 % % % % % % % 0.08 % 0.84 % 0.60 % 1.46 % 2.38 % % % % % % % % Average Household Income Median Household Income Per Capita Income $44,703 $37,343 $13,757 $48,510 $38,430 $16,463 $59,661 $47,735 $21,026 21
22 Demographics Jan 10, 2017 Latitude: Longitude: S Western Ave, Blue Island, IL Mile Radius 3 Mile Radius 5 Mile Radius Work place Workplace Establishments Workplace Employees (FTE) 197 3,233 1,814 36,278 5, ,354 Race Current Estimated Population White Black or African American Asian or Pacific Islander Other Races 10, % % 0.19 % % 107, % % 0.61 % % 310, % % 0.78 % 7.96 % Hispanic 2016 Hispanic Population 2016 Hispanic Population Percent 2000 Hispanic Population Percent 1990 Hispanic Population Percent 4, % % 8.35 % 23, % % 7.69 % 39, % 7.69 % 4.64 % Education (Age 25+) Adult Population (25 Years or Older) Elementary Some High School High School Graduate Some College Associates Degree Bachelors Degree Graduate Degree 6, % % % % 5.87 % 5.67 % 2.49 % 67, % % % % 7.48 % 9.18 % 3.98 % 199, % 8.95 % % % 7.68 % % 6.77 % Home Value (Owner Occupied) Property Value $1,000,000 or more Property Value $750,000 to $999,999 Property Value $500,000 to $749,999 Property Value $400,000 to $499,999 Property Value $300,000 to $399,999 Property Value $200,000 to $299,999 Property Value $150,000 to $199,999 Property Value $100,000 to $149,999 Property Value $60,000 to $99,999 Property Value $40,000 to $59,999 Property Value $0 to $39, % 0.00 % 0.57 % 0.77 % 2.00 % 8.43 % % % % 3.21 % % 0.40 % 0.15 % 0.26 % 0.52 % 1.60 % % % % % 3.54 % 7.65 % 0.38 % 0.29 % 0.77 % 2.16 % 6.02 % % % % % 2.36 % 5.25 % Median Home Value Median Rent (Census 2000) $107,801 $591 $125,316 $601 $160,467 $616 22


23 TitleMax South Western Avenue Blue Island, IL For further information, please contact: Todd Bunke Atlanta Real Estate Group
For Lease. Free-standing Retail / Office Building 1304 Saratoga Avenue San Jose, CA
 For Lease Free-standing Retail / Office Building 1304 Saratoga Avenue San Jose, CA 95117 Description Approximately 4,500 sf plus mezzanine Outstanding identity and visibility In neighborhood shopping center
Roseville Towne Center Gratiot Avenue Roseville, MI 48066
 Retail Space Available 65,000 SF Second Level Space and Outparcel Florence Street Massachusetts Street Gratiot Avenue E. 12 Mile Road Property Highlights is shadow-anchored by Walmart and includes national
HIGH PROFILE ALTAMONTE SPRINGS RETAIL OPPORTUNITY 512 East Altamonte Drive Altamonte Springs, Florida 32701
 HIGH PROFILE ALTAMONTE SPRINGS RETAIL OPPORTUNITY 512 East Altamonte Drive Altamonte Springs, Florida 32701 AVAILABLE GLA 1,600 SF 7,835 SF RATE Call for Rates 1 Mile DEMOGRAPHICS Total Population 12,491
STANFORD PLAZA EAST FLORIDA AVE HEMET, CA. NICK EARLE License #
 Simon s Fish & Chips Helen Nails Chinese Food Coin Laundry Welch s Shoe & Repair Stanford Street Donut Shop Fast Auto and Payday Loans E. Florida Ave AVAILABILITY Unit # Size 41821 41855 4,064 SF Water
Patrick Hammond. Dollar General Moselle, MS DISCLOSURE :
 2 1 1 0 H i g h w a y 1 1, M o s e l l e, M S O n l i n e M a p O F F E R I N G M E M O R A N D U M DISCLOSURE : All materials and information received or derived from Fortis Net Lease (hereinafter collectively
Retail Space Available
 Retail Space Available SRS Real Estate Partners 1871 The Alameda, Suite 250 San Jose, CA 95126 408.553.6135 www.srsre.com Exclusive Leasing Agents Randol Mackley Bruce Frazer Senior Vice President Senior
TEMPE CROSSING II - RETAIL PAD
 Excellent infill pad opportunity in dynamic retail corridor, 1 mi. East of I-10 Fully finished pad. Over $250,000 worth of site work already completed. Buildable up to 8,500 square feet. Excellent parking!
Commercial Land for Sale. Messina Highlands Acres / W. Market St. & Richland Ave West Market Street; York, PA SITE
 3 2018 Messina Highlands 2.21 Acres / W. Market St. & Richland Ave. ; SITE York Fuel Stop / Tobacco Outlet T & D Car Wash 2.21 Acres Commercial Land Available for Sale 12,000 CPD on West Market Street
PRIME COMMERCIAL LAND FOR SALE
 PRIME COMMERCIAL LAND AVENUE P-4 & 5 TH STREET WEST OUTSTANDING HWY. 14 EXPOSURE COMING SOON TRADE & COMMERCE CENTER HEART OF S RETAIL & BUSINESS CORRIDOR The depiction in the included photograph of any
PROPOSED SHOPPING CENTER
 PROPOSED SHOPPING CENTER Southeast Corner I-95 & Highway 192 Melbourne, Florida In a 5 Mile Radius 80,862 Population 32,408 Households $61K Avg HH Income SOONER INVESTMENT Commercial & Investment Real
Click Image For Online Property Map
 Click Image For Online Property Map DISCLOSURE : All materials and information received or derived from Fortis Net Lease (hereinafter collectively referred to as FNL ), its directors, officers, agents,
CVS/Pharmacy. Absolute NNN Lease IREA. Actual Photo S Garey Ave, Pomona, CA 91766
 CVS/Pharmacy Absolute NNN Lease 1485 S Garey Ave, Pomona, CA 91766 IREA Actual Photo IREA INVESTMENT REAL ESTATE ASSOCIATES OFFICE 16501 Ventura Blvd. Suite 448 Encino, CA 91436 Phone: 818.386.6888 Fax:
INVESTMENT OFFERING MEMORANDUM 5325 S FORT APACHE RD, LAS VEGAS, NV SPANISH HILLS PLAZA
 702.787.0123 1333 N Buffalo Dr, Ste 120 Las Vegas, NV 89128 www.virtusco.com INVESTMENT OFFERING MEMORANDUM 5325 S FORT APACHE RD, LAS VEGAS, NV 89148 SPANISH HILLS PLAZA Exclusive AdvisorS ROB HATRAK
EXCLUSIVE LISTING Walgreens
 Actual Walgreens Pharmacy EXCLUSIVE LISTING Walgreens Fresno, California $5,500,000 List Price $3,000,000 Loan Assumption Required Fully Amortized over 17 Years 6.93% Capitalization Rate 8.10% Equity Rate
RIDGECREST TOWNE CENTER
 700-840 N. CHINA LAKE BLVD. RIDGECREST, CALIFORNIA 1,400SF, 1,750SF, 2,205SF, 2,633SF AND 6,620SF AVAILABLE CENTER OF TOWN LOCATION AND COMING SOON: N. China Lake Blvd. Anchored by Stater Brothers, Big
OWNER USER / SBA FINANCING: Office Building For Sale. PROPERTY HIGHLIGHTS: Currently 90% Occupied, but in 2016 the whole top floor.
 OWNER USER / SBA FINANCING: Office Building For Sale Investment Lake Sahara Plaza at 8685 West Sahara Avenue is an 11,858 +/ SF Office building located in the prestigious Lakes subdivision on the edge
Former Sports Authority
 Former Sports Authority Agent: Boh Kurylo Phone: 402-502-4707 Email: bkurylo@lernerco.com Agent: Ben Meier Phone: 402-502-4715 Email: bmeier@lernerco.com 10855 W. Dodge Rd., Ste 270 Omaha, NE 68154 402-330-5480
The Trails. 1,500 sf Space Available. In a 3 Mile Radius 69,985 Population 25,450 Households $78,216 Avg HH Inc. 1,500 sf Corner Space
 1,500 sf Space Available The Trails Edmond Rd (2nd St) & Santa Fe Ave ~ Edmond, Oklahoma Current Tenancy: Edmond YMCA Spinal Wellness Clinic Lemongrass Thai Cuisine Kumon Learning Center Katie s Family
CLICK FOR DRONE IMAGES. Click Image For Online Property Map
 CLICK FOR DRONE IMAGES O F F E R I N G M E M O R A N D U M Click Image For Online Property Map DISCLOSURE : All materials and information received or derived from Fortis Net Lease (hereinafter collectively
CLICK FOR DRONE IMAGES. Click Image For Online Property Map
 CLICK FOR DRONE IMAGES O F F E R I N G M E M O R A N D U M Click Image For Online Property Map DISCLOSURE : All materials and information received or derived from Fortis Net Lease (hereinafter collectively
$8,705, % CAP Rate. DeerfieldPartners. John Giordani Art Griffith (888)
") Tax Free 25 Year NNN $8,705,000 5.00% CAP Rate Rent increases! Very rare in drugstore leases Important strategic location across from Walgreens True hard-corner location with 41,000 cars per day at intersection
Tax Free 25 Year NNN $8,705,000 5.00% CAP Rate Rent increases! Very rare in drugstore leases Important strategic location across from Walgreens True hard-corner location with 41,000 cars per day at intersection
EVEREST. Retail Investment Opportunity. Ivy Hills Retail Center 7397 Main Street Newtown, OH CONTACT: Chris Nachtrab.
 Retail Investment Opportunity CONTACT: Chris Nachtrab chris.nachtrab@everestrealestate.com 513/769-2509 John Thompson john.thompson@everestrealestate.com 513/769-2514 Ivy Hills Retail Center 7397 Main
Click Image For Online Property Map
 O F F E R I N G M E M O R A N D U M Click Image For Online Property Map FRED'S Super Dollar & Pharmacy Portfolio Available Separately Albany Cherokee Gautier Leakesville Pascagoula Purvis Total Building
Click Image For Online Property Map
 Click Image For Online Property Map DISCLOSURE : All materials and information received or derived from Fortis Net Lease (hereinafter collectively referred to as FNL ), its directors, officers, agents,
INVESTMENT OFFERING. Fairview Park 6728 W. Fairveiw Ave. Boise, ID N ALLUMBAUGH ST W FAIRVIEW AVE N FRY ST N RAYMOND ST
 INVESTMENT OFFERING Fairview Park 6728 W. Fairveiw Ave. Boise, ID 83704 N ALLUMBAUGH ST W FAIRVIEW AVE N FRY ST N RAYMOND ST Confidentiality Agreement Fairview Park 6728 W. Fairview Ave Boise, ID 83704
EZ Corp. New Construction in Chicago, IL S. Western Ave. Chicago, IL For more info on this opportunity please contact:
 EZ Corp New Construction in Chicago, IL For more info on this opportunity please contact: JOHN ANDREINI jandreini@capitalpacific.com (415) 274-2715 CA BRE# 01440360 RICK SANNER rsanner@capitalpacific.com
Starbucks & Pie Five Pizza
 PEMBROKE PINES, FLORIDA Representative Photo Starbucks & Pie Five Pizza Representative Photo Asking Price: $4,410,686 Cap Rate: 5.25% Michael Zimmerman 919.391.9901 mzimmerman@atlanticretail.com BOSTON,
9426 Montana Avenue, El Paso, Texas 79925
 Representative Photo 9426 Montana Avenue, El Paso, Texas 79925 A d v a n c e A u t o P a r t s F O R T I S N E T L E A S E Click Image For Online Property Map DISCLOSURE : All materials and information
Click Image For Aerial Video. Click Image For Online Property Map
 Click Image For Aerial Video O F F E R I N G M E M O R A N D U M Click Image For Online Property Map DISCLOSURE : All materials and information received or derived from Fortis Net Lease (hereinafter collectively
Linden Market. 132nd & W. Dodge Rd., Omaha, NE W. Dodge Rd., Ste 270 Omaha, NE (p)
") Linden Market 132nd & W. Dodge Rd., Omaha, NE 68154 Agent: Dennis Thaemert Phone: 402-502-4706 Email: dthaemert@lernerco.com Agent: Boh Kurylo Phone: 402-502-4707 Email: bkurylo@lernerco.com 10855 W. Dodge
Linden Market 132nd & W. Dodge Rd., Omaha, NE 68154 Agent: Dennis Thaemert Phone: 402-502-4706 Email: dthaemert@lernerco.com Agent: Boh Kurylo Phone: 402-502-4707 Email: bkurylo@lernerco.com 10855 W. Dodge
Population and Poverty Data by Cook County Zip Code, updated December 2016
 child under age 6 Race/Ethnicity of Black White Asian Multiple Races of with of of Zip Code Age 0 2 Age 3 4 Age 5 Age 6 12 0 5 6 17 0 5 6 11 0 5 6 11 60004 50,639 1,870 1,321 614 4,271 2,436 8% 1% 81%
University of Minnesota
 neighborhood profile October 2011 About this area The University neighborhood is bordered by 11th Avenue Southeast, University Avenue, 15th Avenue Southeast, the railroad tracks, Oak Street, and the Mississippi
Commission District 4 Census Data Aggregation
 Commission District 4 Census Data Aggregation 2011-2015 American Community Survey Data, U.S. Census Bureau Table 1 (page 2) Table 2 (page 2) Table 3 (page 3) Table 4 (page 4) Table 5 (page 4) Table 6 (page
Mid - City Industrial
 Minneapolis neighborhood profile October 2011 Mid - City Industrial About this area The Mid-City Industrial neighborhood is bordered by I- 35W, Highway 280, East Hennepin Avenue, and Winter Street Northeast.
Camden Industrial. Minneapolis neighborhood profile. About this area. Trends in the area. Neighborhood in Minneapolis.
 Minneapolis neighborhood profile October 2011 Camden Industrial About this area The Camden Industrial neighborhood is bordered by 48th Avenue North, the Mississippi River, Dowling Avenue North, Washington
Northwest Census Data Aggregation
 Northwest Census Data Aggregation 2011-2015 American Community Survey Data, U.S. Census Bureau Table 1 (page 2) Table 2 (page 2) Table 3 (page 3) Table 4 (page 4) Table 5 (page 4) Table 6 (page 5) Table
SDs from Regional Peer Group Mean. SDs from Size Peer Group Mean
 Family: Population Demographics Population Entire MSA 2414616 Central Cities (CC) 764431 Outside Central Cities 1650185 Percent of Entire MSA 31.66% Population in CC Percent Change in Population from 1999
Shingle Creek. Minneapolis neighborhood profile. About this area. Trends in the area. Neighborhood in Minneapolis. October 2011
 neighborhood profile October 2011 About this area The neighborhood is bordered by 53rd Avenue North, Humboldt Avenue North, 49th Avenue North, and Xerxes Avenue North. It is home to Olson Middle School.
Riverview Census Data Aggregation
 Riverview Census Data Aggregation 2011-2015 American Community Survey Data, U.S. Census Bureau Table 1 (page 2) Table 2 (page 2) Table 3 (page 3) Table 4 (page 4) Table 5 (page 4) Table 6 (page 5) Table
Zipe Code Census Data Aggregation
 Zipe Code 66101 Census Data Aggregation 2011-2015 American Community Survey Data, U.S. Census Bureau Table 1 (page 2) Table 2 (page 2) Table 3 (page 3) Table 4 (page 4) Table 5 (page 4) Table 6 (page 5)
Zipe Code Census Data Aggregation
 Zipe Code 66103 Census Data Aggregation 2011-2015 American Community Survey Data, U.S. Census Bureau Table 1 (page 2) Table 2 (page 2) Table 3 (page 3) Table 4 (page 4) Table 5 (page 4) Table 6 (page 5)
Independence, MO Data Profile 2015
 , MO Data Profile 2015 5 year American Community Survey (ACS) Jackson County, Missouri Data sources: U.S. Census Bureau, American Community Survey (ACS), 2011 2015 (released December 8, 2016), compared
LEASE City Avenue Philadelphia, PA Agent Contact: LEASE FOR $20 S/F PLUS UTILITES. Lisa Trout
 LEASE 4920-50 City Avenue Philadelphia, PA 19131 C APITAL COMMERCIAL R EAL ESTATE G ROUP 3748 West Chester Pike Newtown Square, PA 19073 Phone: 610-359-9700 Fax: 610-359-9750 www.capitalcomre.com BEAUTIFUL
Dollar General NNN WITH INCREASES
 File Photograph NNN WITH INCREASES ARKANSAS ONE OF THE WORLD S MOST SUCCESSFUL RETAILERS Sales and Profits are Increasing Strongly. Record Earnings Just Announced Credit Rating Increased Four Times in
Brannon Crossing 4089 Lexington Road Lexington, KY 40356
 Brannon Crossing Retail Space Available 1.075 1.33 Acres 4,051 Cars Per Day 45,448 Cars Per Day Lexington/Nicolasville Road, U.S. 27 Brannon Road, KY 2080 Property Highlights Located in strong retail corridor
AVAILABLE FOR LEASE Mayfield Road. Mayfield Heights, Ohio
 1,700 SF Retail Space For Lease Property Highlights Below market lease rates Refurbished in 2016 Furniture, fixtures and equipment available for purchase Fully built out restaurant space with hood Excellent
SDs from Regional Peer Group Mean. SDs from Size Peer Group Mean
 Family: Population Demographics Population Entire MSA 602894 Central Cities (CC) 227,818 Outside Central Cities 375,076 Percent of Entire MSA 37.79% Population in CC Percent Change in Population from 1999
SDs from Regional Peer Group Mean. SDs from Size Peer Group Mean
 Family: Population Demographics Population Entire MSA 1187941 Central Cities (CC) 511,843 Outside Central Cities 676,098 Percent of Entire MSA 43.09% Population in CC Percent Change in Population from
SDs from Regional Peer Group Mean. SDs from Size Peer Group Mean
 Family: Population Demographics Population Entire MSA 661645 Central Cities (CC) 247,057 Outside Central Cities 414,588 Percent of Entire MSA 37.34% Population in CC Percent Change in Population from 1999
SDs from Regional Peer Group Mean. SDs from Size Peer Group Mean
 Family: Population Demographics Population Entire MSA 583845 Central Cities (CC) 316,649 Outside Central Cities 267,196 Percent of Entire MSA 54.24% Population in CC Percent Change in Population from 1999
SDs from Regional Peer Group Mean. SDs from Size Peer Group Mean
 Family: Population Demographics Population Entire MSA 1251509 Central Cities (CC) 540,423 Outside Central Cities 711,086 Percent of Entire MSA 43.18% Population in CC Percent Change in Population from
SDs from Regional Peer Group Mean. SDs from Size Peer Group Mean
 Family: Population Demographics Population Entire MSA 1135614 Central Cities (CC) 677,766 Outside Central Cities 457,848 Percent of Entire MSA 59.68% Population in CC Percent Change in Population from
SDs from Regional Peer Group Mean. SDs from Size Peer Group Mean
 Family: Population Demographics Population Entire MSA 591932 Central Cities (CC) 260,970 Outside Central Cities 330,962 Percent of Entire MSA 44.09% Population in CC Percent Change in Population from 1999
SDs from Regional Peer Group Mean. SDs from Size Peer Group Mean
 Family: Population Demographics Population Entire MSA 1100491 Central Cities (CC) 735,617 Outside Central Cities 364,874 Percent of Entire MSA 66.84% Population in CC Percent Change in Population from
SDs from Regional Peer Group Mean. SDs from Size Peer Group Mean
 Family: Population Demographics Population Entire MSA 540258 Central Cities (CC) 198,915 Outside Central Cities 341,343 Percent of Entire MSA 36.82% Population in CC Percent Change in Population from 1999
SDs from Regional Peer Group Mean. SDs from Size Peer Group Mean
 Family: Population Demographics Population Entire MSA 1249763 Central Cities (CC) 691,295 Outside Central Cities 558,468 Percent of Entire MSA 55.31% Population in CC Percent Change in Population from
SDs from Regional Peer Group Mean. SDs from Size Peer Group Mean
 Family: Population Demographics Population Entire MSA 1088514 Central Cities (CC) 272,953 Outside Central Cities 815,561 Percent of Entire MSA 25.08% Population in CC Percent Change in Population from
SDs from Regional Peer Group Mean. SDs from Size Peer Group Mean
 Family: Population Demographics Population Entire MSA 922516 Central Cities (CC) 470,859 Outside Central Cities 451,657 Percent of Entire MSA 51.04% Population in CC Percent Change in Population from 1999
SDs from Regional Peer Group Mean. SDs from Size Peer Group Mean
 Family: Population Demographics Population Entire MSA 687249 Central Cities (CC) 198,500 Outside Central Cities 488,749 Percent of Entire MSA 28.88% Population in CC Percent Change in Population from 1999
SDs from Regional Peer Group Mean. SDs from Size Peer Group Mean
 Family: Population Demographics Population Entire MSA 542149 Central Cities (CC) 181870 Outside Central Cities 360279 Percent of Entire MSA 33.55% Population in CC Percent Change in Population from 1999
SDs from Regional Peer Group Mean. SDs from Size Peer Group Mean
 Family: Population Demographics Population Entire MSA 1025598 Central Cities (CC) 293,834 Outside Central Cities 731,764 Percent of Entire MSA 28.65% Population in CC Percent Change in Population from
SDs from Regional Peer Group Mean. SDs from Size Peer Group Mean
 Family: Population Demographics Population Entire MSA 875583 Central Cities (CC) 232,835 Outside Central Cities 642,748 Percent of Entire MSA 26.59% Population in CC Percent Change in Population from 1999
SDs from Regional Peer Group Mean. SDs from Size Peer Group Mean
 Family: Population Demographics Population Entire MSA 716998 Central Cities (CC) 448,275 Outside Central Cities 268,723 Percent of Entire MSA 62.52% Population in CC Percent Change in Population from 1999
SDs from Regional Peer Group Mean. SDs from Size Peer Group Mean
 Family: Population Demographics Population Entire MSA 1333914 Central Cities (CC) 284,943 Outside Central Cities 1,048,971 Percent of Entire MSA 21.36% Population in CC Percent Change in Population from
SDs from Regional Peer Group Mean. SDs from Size Peer Group Mean
 Family: Population Demographics Population Entire MSA 712738 Central Cities (CC) 448,607 Outside Central Cities 264,131 Percent of Entire MSA 62.94% Population in CC Percent Change in Population from 1999
SDs from Regional Peer Group Mean. SDs from Size Peer Group Mean. Population Entire MSA
 Family: Population Demographics Population Entire MSA 1169641 Central Cities (CC) 0 Outside Central Cities 1,169,641 Percent of Entire MSA 0% Population in CC Percent Change in Population from 1999 to
SDs from Regional Peer Group Mean. SDs from Size Peer Group Mean
 Family: Population Demographics Population Entire MSA 3251876 Central Cities (CC) 2,078,750 Outside Central Cities 1,173,126 Percent of Entire MSA 63.92% Population in CC Percent Change in Population from
SDs from Regional Peer Group Mean. SDs from Size Peer Group Mean
 Family: Population Demographics Population Entire MSA 1592383 Central Cities (CC) 1,181,140 Outside Central Cities 411,243 Percent of Entire MSA 74.17% Population in CC Percent Change in Population from
SDs from Regional Peer Group Mean. SDs from Size Peer Group Mean
 Family: Population Demographics Population Entire MSA 1776062 Central Cities (CC) 716,793 Outside Central Cities 1,059,269 Percent of Entire MSA 40.36% Population in CC Percent Change in Population from
SDs from Regional Peer Group Mean. SDs from Size Peer Group Mean
 Family: Population Demographics Population Entire MSA 4112198 Central Cities (CC) 416,474 Outside Central Cities 3,695,724 Percent of Entire MSA 10.13% Population in CC Percent Change in Population from
SDs from Regional Peer Group Mean. SDs from Size Peer Group Mean
 Family: Population Demographics Population Entire MSA 9519338 Central Cities (CC) 4408996 Outside Central Cities 5110342 Percent of Entire MSA 46.32% Population in CC Percent Change in Population from
SDs from Regional Peer Group Mean. SDs from Size Peer Group Mean
 Family: Population Demographics Population Entire MSA 1623018 Central Cities (CC) 152397 Outside Central Cities 1470621 Percent of Entire MSA 9.39% Population in CC Percent Change in Population from 1999
SDs from Regional Peer Group Mean. SDs from Size Peer Group Mean
 Family: Population Demographics Population Entire MSA 1731183 Central Cities (CC) 776733 Outside Central Cities 954450 Percent of Entire MSA 44.87% Population in CC Percent Change in Population from 1999
SDs from Regional Peer Group Mean. SDs from Size Peer Group Mean
 Family: Population Demographics Population Entire MSA 2968806 Central Cities (CC) 669,769 Outside Central Cities 2,299,037 Percent of Entire MSA 22.56% Population in CC Percent Change in Population from
SDs from Regional Peer Group Mean. SDs from Size Peer Group Mean
 Family: Population Demographics Population Entire MSA 2846289 Central Cities (CC) 809063 Outside Central Cities 2037226 Percent of Entire MSA 28.43% Population in CC Percent Change in Population from 1999
SDs from Regional Peer Group Mean. SDs from Size Peer Group Mean
 Family: Population Demographics Population Entire MSA 4441551 Central Cities (CC) 1147720 Outside Central Cities 3293831 Percent of Entire MSA 25.84% Population in CC Percent Change in Population from
SDs from Regional Peer Group Mean. SDs from Size Peer Group Mean
 Family: Population Demographics Population Entire MSA 1500741 Central Cities (CC) 661799 Outside Central Cities 838942 Percent of Entire MSA 44.1% Population in CC Percent Change in Population from 1999
SDs from Regional Peer Group Mean. SDs from Size Peer Group Mean
 Family: Population Demographics Population Entire MSA 2552994 Central Cities (CC) 686992 Outside Central Cities 1866002 Percent of Entire MSA 26.91% Population in CC Percent Change in Population from 1999
TITLE LOAN PORTFOLIO 6 ASSET ALABAMA PORTFOLIO OFFERING EXCLUSIVE NET LEASED RETAIL INVESTMENT OPPORTUNITY
 EXCLUSIVE NET LEASED RETAIL INVESTMENT OPPORTUNITY TITLE LOAN PORTFOLIO 6 ASSET ALABAMA PORTFOLIO OFFERING HARRY BELL Broker Associate D. 850.240.0527 harry.bell@penfedrealty.com TITLE LOAN PORTFOLIO 6
Premier Boulevard Outparcels Roanoke Rapids, NC 27870
 1.69 AC 1.46 AC 1.24 AC NCDOT Premier Boulevard Extension 3.01 AC 1.05 AC 1.10 AC 17,000 VPD Exit 173 1.76 AC 42,000 VPD PROPERTY HIGHLIGHTS Developed Outparcels Available in WalMart Supercenter anchored
4520 Madison Avenue, Suite 300 Kansas City, MO rhjohnson.com
 FOR LEASE OLATHE STATION SOUTH 119th Street & I-35 Olathe, Kansas Redevelopment Underway SITE SUMMARY Phenomenal Restaurant & Retail Opportunities Available Positioned in Super Regional Trade Area Anchored
SUPPLEMENTAL INFORMATION
 SUPPLEMENTAL INFORMATION Statement of Net Position (as of June 30, 2013) Component Business Total Unit Total Governmental Type Primary Manassas City Reporting Activities Activities Government Public Schools
The Blair Center US Highway 98 North, Lakeland, Fl Jack Strollo, CCIM, CPM
 , LARGE PYLON SIGN CLOSE TO I-4 MULTI TENANT FIVE UNITS EXCELLENT FOR OWNER/OCCUPANT 41,500 VPD Vice President, Broker jstrollo@resbroadway.com BK698301 100 S Kentucky Ave, Suite 290 Lakeland, FL 33801
S A N J O S E C A L I F O R N I A
 SAN JOSE CALIFORNIA SANTA CLARA: A TOP U.S. COUNTY Compared to the 20 Most Populous Counties Santa Clara County ranks #1 in average household income at over $145,000 1. Santa Clara, CA 2. Alameda, CA (Oakland)
Town Profiles: Demographic, Economic, and Housing Statistics for De Smet City and Wall Town, SOuth Dakota
 South Dakota State University Open PRAIRIE: Open Public Research Access Institutional Repository and Information Exchange Census Data Center News Releases SDSU Census Data Center 12-7-2017 Town Profiles:
H U R D D E V E L O P M E N T GRAND AVENUE DEVELOPMENT SITE & G R A N D A V E. D E S M O I N E S, I O W A
 H U R D D E V E L O P M E N T GRAND AVENUE DEVELOPMENT SITE 2 2 0 & 3 0 0 G R A N D A V E. D E S M O I N E S, I O W A 5 0 2 6 5 R ICHIE HURD V I C E P R E S I D E N T 5 1 5. 7 7 8. 1 0 0 9 r i c h i e.
SOLANO AVE. Premier Location in Bustling Retail District
 +/- 1,172 SF Retail Space Premier Location in Bustling Retail District TE SI Located in the busiest stretch of the Solano Avenue retail district, neighboring an eclectic mix of local, regional, and national
Report on the City of South Fulton: Potential Revenues and Expenditures
 Report on the City of South Fulton: Potential Revenues and Expenditures Peter Bluestone John Matthews Fiscal Research Center Andrew Young School of Policy Studies Georgia State University Atlanta, GA January
OFFICES FOR LEASE. Excellent signage opportunities on Clinton Keith & Palomar Sides TURNKEY DENTAL OFFICE NOW AVAILABLE!
 TURNKEY DENTAL OFFICE NOW AVAILABLE! THE BARN AT WILDOMAR Excellent signage opportunities on Clinton Keith & Palomar Sides PROPERTY HIGHLIGHTS: Offices from 745 SF to 2,292 SF with immediate occupancy
Local Business Profile All Sectors - Fairfield city, Ohio. Contents. What will I find in this report? My Customers
 Local Business Profile All Sectors -, Contents What will I find in this report? My Customers The My Customers section provides summarized demographic information for,. This information provides a snapshot
NET LEASE INVESTMENT OFFERING MCDONALD S (GL)
") MCDONALD S (GL) 2019 Spirit Lake Road Winter Haven, FL 33880 TABLE OF CONTENTS TABLE OF CONTENTS I. Executive Profile Executive Summary Investment Highlights Property Overview II. Location Overview Photographs
MCDONALD S (GL) 2019 Spirit Lake Road Winter Haven, FL 33880 TABLE OF CONTENTS TABLE OF CONTENTS I. Executive Profile Executive Summary Investment Highlights Property Overview II. Location Overview Photographs
99TH AVENUE AND GLENDALE AVENUE
 N ATHAN & A SSOCIATES, I NC. 7600 East Doubletree Ranch Road Suite #150 Scottsdale Arizona 85258 Phone: 480.367.0700 Fax: 480.367.8341 www.nathanandassociatesinc.com 99TH AVENUE AND GLENDALE AVENUE S URROUNDING
Southchase Shopping Village S. Orange Blossom Trail Orlando, FL 32837
 Southchase Orlando, FL Retail Space 1,000 SF to 25,200 SF ad bee Ro ether st W We South Orange Blossom Trail Property Highlights Southchase Village is comprised of nationally recognized tenants including
MORENO MARKETPLACE. ΜΟΡΕΝΟ ςαλλεψ, ΧΑ. 77,763 σθυαρε φεετ
 MORENO MARKETPLACE ΜΟΡΕΝΟ ςαλλεψ, ΧΑ SIZE 77,763 σθυαρε φεετ DEMOGRAPHICS 1 mιλε 3 mιλε 5 mιλε Ποπυλατιον 10,477 71,978 156,200 Ηουσεηολδσ 2,976 19,094 40,845 Μεδιαν ΗΗ Ινχοmε ( ) 82,465 60,533 54,226
Contact: Larry Hausman (502) Outer Loop, Louisville, KY Knobview Shopping Center
 Outer Loop, Louisville, KY Knobview Shopping Center") 5603-5637 Outer Loop, Louisville, KY 40219 Knobview Shopping Center Jefferson Mall Academy Sports Center SUBJECT Knobview Shopping Center offers a diverse mix of local and national tenants. The center
5603-5637 Outer Loop, Louisville, KY 40219 Knobview Shopping Center Jefferson Mall Academy Sports Center SUBJECT Knobview Shopping Center offers a diverse mix of local and national tenants. The center
Distribution of Household Wealth in the U.S.: 2000 to 2011
 Cornell University ILR School DigitalCommons@ILR Federal Publications Key Workplace Documents 2014 Distribution of Household Wealth in the U.S.: Marina Vornovitsky U.S. Census Bureau Alfred Gottschalck
Poverty in the United Way Service Area
 Poverty in the United Way Service Area Year 4 Update - 2014 The Institute for Urban Policy Research At The University of Texas at Dallas Poverty in the United Way Service Area Year 4 Update - 2014 Introduction
Kenwood Galleria 8118 Montgomery Road Cincinnati, OH 45236
 Hosbrook Rd Kenwood Galleria Fully Occupied Montgomery Rd Property Highlights Located in the affluent Kenwood submarket Established retail presence with a strong demand for vacant space Signage available
4520 Madison Avenue, Suite 300 Kansas City, MO rhjohnson.com
 FOR LEASE OLATHE STATION SOUTH 119th Street & I-35 Olathe, Kansas Redevelopment Underway SITE SUMMARY Phenomenal Restaurant Opportunity Available Positioned in Super Regional Trade Area Anchored by Top
2018:IIIQ Nevada Unemployment Rate Demographics Report*
 2018:IIIQ Nevada Unemployment Rate Demographics Report* Department of Employment, Training & Rehabilitation Research and Analysis Bureau Dr. Tiffany Tyler-Garner, Director Dennis Perea, Deputy Director