4520 Madison Avenue, Suite 300 Kansas City, MO rhjohnson.com
|
|
|
- Alexina Wilcox
- 5 years ago
- Views:
Transcription


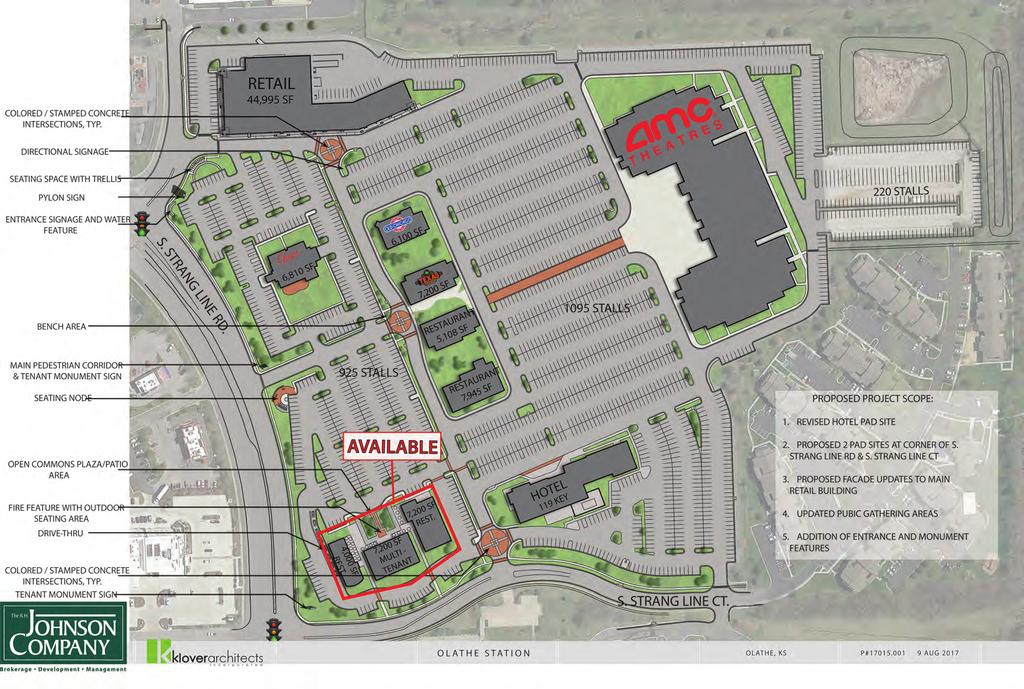
1 FOR LEASE OLATHE STATION SOUTH 119th Street & I-35 Olathe, Kansas Redevelopment Underway SITE SUMMARY Phenomenal Restaurant & Retail Opportunities Available Positioned in Super Regional Trade Area Anchored by Top Performing AMC Theatre in a Five State Region - Over 1 million Annual Visitors 143, VPD at 119th Street and I-35 74, Employees in a Three-Mile Radius $97, Average Household Income in 5-Mile Radius C """JoHNSON OMPANY Brokerage Development Management CHA i'n1 NKS Al.tA1L ov11ows Eric Gonsher egonsher@rhjohnson.com Bryan Jantsch bjantsch@rhjohnson.com Madison Avenue, Suite 3 Kansas City, MO rhjohnson.com While this information is deemed correct, no representation is made as to the accuracy thereof. This information is subject to errors, omissions and change of terms at any time. The property may be withdrawn from the market without notice.


2 SF 6,1 F S 7,2 GL IN ER D. T RAN TAU RES 45 SF 7,9 T RAN TAU RES 8 SF 5,1 SF 7,2 T. RES SITE PLAN N EL HOTKEY 119 O L AT H E S TAT I O N 195 STALLS S. STRANG LINE CT. 22 STALLS PROPOSED PROJECT SCOPE: 1. REVISED HOTEL PAD SITE 2. PROPOSED 3 PAD SITES AT CORNER OF S. STRANG LINE RD & S. STRANG LINE CT 3. PROPOSED FACADE UPDATES TO MAIN RETAIL BUILDING 4. UPDATED PUBLIC GATHERING AREAS P# JULY ADDITION OF ENTRANCE AND MONUMENT FEATURES OLATHE, KS OLATHE STATION SOUTH 119th Street & Strang Line Road, Olathe, Kansas, D VP 23,376 VPD 119th Street 53,958 VPD R e n i l g n ra St Blackbob Road SF 6,81 SF 4, T. RES SF 7,2 T. RES PD N RA ST S. RH JOHNSON,9 3 SITE Church Asian Bistro V PD 3V,2 99 d a o Renner Road 35
3

4 AVAILABLE 1, SF ART GALLERY
5
6


 a., < f. Heritage Park Football Complex W 175th.s, C s iii C. 159th St l> @) :, 5 =r :,,.. < (ill,.")
7 @217 SITES USA Inc. Alt Rights Reserved. (48) W Chandler Blvd, Chandler AZ I logos are for 1dentificatton purposes only and may be lrademarks of lheor respective companies, This map was prod\.lced using data from private and government sources deemed to be reliable. The information hefeiij 1s provided without representation or warranty W 119th St & S Blackbob Rd Olathe, KS 6662 W71stSI Cl 1o ;;:, Cl :,.. (J) W83rdSt :::, a. W63rdSt C a, Shawnee M1ss\ofl 11-:.ii-l W63rdS\ q. z z, ii, g Zarah < 3 3 W67thSt g ¾ -:, } "ddr. C. w 3! c 3 W75thSt v =r W75thSt 3 a. :,,..a Overland Park n, i Prairie Villa W87lhSI "C ::, C 3 3 W87thSt z g l> < College Blvd l: W 95thSt W13rd St v College Blvd n, W 119thSt W 119th St W 127th St W 127th St l> < Olathe W 135th St,;; : W 143rd St o. ili o w ::, a. w z g :,,. l> < < Century ircenter ntury 159thSt II) a., < f. Heritage Park Football Complex W 175th.s, C s iii C. 159th St :, 5 =r :,,.. < (ill,. C I Map Google Demographics 1 mi radius 3 mi radius Population 1,62 78,36 Households 4,599 31,23 Population Median Age Yr Pop Growth (Total¾) 5.2% 5.% 5 mi radius 231,85 9, % Contact Information TdllloHNSON COMPANY CHA in:1n K$ Name Eric Gonsher egonsher@rhjohnson.com Phone


8 SUMMARY PROFILE 2-21 Census, 217 Estimates with 222 Projections Calculated using Weighted Block Centroid from Block Groups Lat/Lon: / W 119th St & S Blackbob Rd Olathe, KS 6662 ThcRH.,OHNSON COMPANY CHAIN.INKS 1 mi radius 3 mi radius 5 mi radius RS1 POPULATION HOUSEHOLDS RACE AND ETHNICITY INCOME EDUCATION (AGE 25+) 217 Estimated Population 1,62 78,36 231, Projected Population 11,173 82,21 243, Census Population 1,17 74, ,246 2 Census Population 8,494 64, ,271 Projected Annual Growth 217 to % 1.% 1.% Historical Annual Growth 2 to % 1.3% 1.4% 217 Median Age Estimated Households 4,599 31,23 9, Projected Households 4,93 33,253 96, Census Households 4,33 29,244 83,861 2 Census Households 3,169 23,972 69,115 Projected Annual Growth 217 to % 1.3% 1.3% Historical Annual Growth 2 to % 1.8% 1.8% 217 Estimated White 8.4% 8.4% 81.4% 217 Estimated Black or African American 6.4% 6.5% 6.% 217 Estimated Asian or Pacific Islander 6.7% 6.3% 6.% 217 Estimated American Indian or Native Alaskan.4%.4%.4% 217 Estimated Other Races 6.1% 6.4% 6.2% 217 Estimated Hispanic 8.2% 9.1% 8.7% 217 Estimated Average Household Income $95,515 $92,888 $99, Estimated Median Household Income $75,165 $84,25 $89, Estimated Per Capita Income $41,438 $37,11 $38, Estimated Elementary (Grade Level to 8) 2.7% 2.2% 2.2% 217 Estimated Some High School (Grade Level 9 to 11) 2.6% 2.7% 2.5% 217 Estimated High School Graduate 15.% 14.9% 14.8% 217 Estimated Some College 2.4% 21.% 2.4% 217 Estimated Associates Degree Only 8.7% 8.6% 8.3% 217 Estimated Bachelors Degree Only 34.4% 33.1% 33.2% 217 Estimated Graduate Degree 16.2% 17.5% 18.6% This report was produced using data from private and government sources deemed to be reliable. The information herein is provided without representation or warranty. BUSINESS 217 Estimated Total Businesses 624 4,112 1, Estimated Total Employees 1,7 69, , Estimated Employee Population per Business Estimated Residential Population per Business , Sites USA, Chandler, Arizona, page 1 of 1 Demographic Source: Applied Geographic Solutions 4/217, TIGER Geography
4520 Madison Avenue, Suite 300 Kansas City, MO rhjohnson.com
 FOR LEASE OLATHE STATION SOUTH 119th Street & I-35 Olathe, Kansas Redevelopment Underway SITE SUMMARY Phenomenal Restaurant Opportunity Available Positioned in Super Regional Trade Area Anchored by Top
PRIME COMMERCIAL LAND FOR SALE
 PRIME COMMERCIAL LAND AVENUE P-4 & 5 TH STREET WEST OUTSTANDING HWY. 14 EXPOSURE COMING SOON TRADE & COMMERCE CENTER HEART OF S RETAIL & BUSINESS CORRIDOR The depiction in the included photograph of any
RIDGECREST TOWNE CENTER
 700-840 N. CHINA LAKE BLVD. RIDGECREST, CALIFORNIA 1,400SF, 1,750SF, 2,205SF, 2,633SF AND 6,620SF AVAILABLE CENTER OF TOWN LOCATION AND COMING SOON: N. China Lake Blvd. Anchored by Stater Brothers, Big
Linden Market. 132nd & W. Dodge Rd., Omaha, NE W. Dodge Rd., Ste 270 Omaha, NE (p)
") Linden Market 132nd & W. Dodge Rd., Omaha, NE 68154 Agent: Dennis Thaemert Phone: 402-502-4706 Email: dthaemert@lernerco.com Agent: Boh Kurylo Phone: 402-502-4707 Email: bkurylo@lernerco.com 10855 W. Dodge
Linden Market 132nd & W. Dodge Rd., Omaha, NE 68154 Agent: Dennis Thaemert Phone: 402-502-4706 Email: dthaemert@lernerco.com Agent: Boh Kurylo Phone: 402-502-4707 Email: bkurylo@lernerco.com 10855 W. Dodge
Former Sports Authority
 Former Sports Authority Agent: Boh Kurylo Phone: 402-502-4707 Email: bkurylo@lernerco.com Agent: Ben Meier Phone: 402-502-4715 Email: bmeier@lernerco.com 10855 W. Dodge Rd., Ste 270 Omaha, NE 68154 402-330-5480
STANFORD PLAZA EAST FLORIDA AVE HEMET, CA. NICK EARLE License #
 Simon s Fish & Chips Helen Nails Chinese Food Coin Laundry Welch s Shoe & Repair Stanford Street Donut Shop Fast Auto and Payday Loans E. Florida Ave AVAILABILITY Unit # Size 41821 41855 4,064 SF Water
PROPOSED SHOPPING CENTER
 PROPOSED SHOPPING CENTER Southeast Corner I-95 & Highway 192 Melbourne, Florida In a 5 Mile Radius 80,862 Population 32,408 Households $61K Avg HH Income SOONER INVESTMENT Commercial & Investment Real
TEMPE CROSSING II - RETAIL PAD
 Excellent infill pad opportunity in dynamic retail corridor, 1 mi. East of I-10 Fully finished pad. Over $250,000 worth of site work already completed. Buildable up to 8,500 square feet. Excellent parking!
OFFICES FOR LEASE. Excellent signage opportunities on Clinton Keith & Palomar Sides TURNKEY DENTAL OFFICE NOW AVAILABLE!
 TURNKEY DENTAL OFFICE NOW AVAILABLE! THE BARN AT WILDOMAR Excellent signage opportunities on Clinton Keith & Palomar Sides PROPERTY HIGHLIGHTS: Offices from 745 SF to 2,292 SF with immediate occupancy
The Trails. 1,500 sf Space Available. In a 3 Mile Radius 69,985 Population 25,450 Households $78,216 Avg HH Inc. 1,500 sf Corner Space
 1,500 sf Space Available The Trails Edmond Rd (2nd St) & Santa Fe Ave ~ Edmond, Oklahoma Current Tenancy: Edmond YMCA Spinal Wellness Clinic Lemongrass Thai Cuisine Kumon Learning Center Katie s Family
HIGH PROFILE ALTAMONTE SPRINGS RETAIL OPPORTUNITY 512 East Altamonte Drive Altamonte Springs, Florida 32701
 HIGH PROFILE ALTAMONTE SPRINGS RETAIL OPPORTUNITY 512 East Altamonte Drive Altamonte Springs, Florida 32701 AVAILABLE GLA 1,600 SF 7,835 SF RATE Call for Rates 1 Mile DEMOGRAPHICS Total Population 12,491
Commission District 4 Census Data Aggregation
 Commission District 4 Census Data Aggregation 2011-2015 American Community Survey Data, U.S. Census Bureau Table 1 (page 2) Table 2 (page 2) Table 3 (page 3) Table 4 (page 4) Table 5 (page 4) Table 6 (page
Northwest Census Data Aggregation
 Northwest Census Data Aggregation 2011-2015 American Community Survey Data, U.S. Census Bureau Table 1 (page 2) Table 2 (page 2) Table 3 (page 3) Table 4 (page 4) Table 5 (page 4) Table 6 (page 5) Table
Riverview Census Data Aggregation
 Riverview Census Data Aggregation 2011-2015 American Community Survey Data, U.S. Census Bureau Table 1 (page 2) Table 2 (page 2) Table 3 (page 3) Table 4 (page 4) Table 5 (page 4) Table 6 (page 5) Table
Zipe Code Census Data Aggregation
 Zipe Code 66101 Census Data Aggregation 2011-2015 American Community Survey Data, U.S. Census Bureau Table 1 (page 2) Table 2 (page 2) Table 3 (page 3) Table 4 (page 4) Table 5 (page 4) Table 6 (page 5)
Zipe Code Census Data Aggregation
 Zipe Code 66103 Census Data Aggregation 2011-2015 American Community Survey Data, U.S. Census Bureau Table 1 (page 2) Table 2 (page 2) Table 3 (page 3) Table 4 (page 4) Table 5 (page 4) Table 6 (page 5)
For Lease. Free-standing Retail / Office Building 1304 Saratoga Avenue San Jose, CA
 For Lease Free-standing Retail / Office Building 1304 Saratoga Avenue San Jose, CA 95117 Description Approximately 4,500 sf plus mezzanine Outstanding identity and visibility In neighborhood shopping center
Roseville Towne Center Gratiot Avenue Roseville, MI 48066
 Retail Space Available 65,000 SF Second Level Space and Outparcel Florence Street Massachusetts Street Gratiot Avenue E. 12 Mile Road Property Highlights is shadow-anchored by Walmart and includes national
SOLANO AVE. Premier Location in Bustling Retail District
 +/- 1,172 SF Retail Space Premier Location in Bustling Retail District TE SI Located in the busiest stretch of the Solano Avenue retail district, neighboring an eclectic mix of local, regional, and national
99TH AVENUE AND GLENDALE AVENUE
 N ATHAN & A SSOCIATES, I NC. 7600 East Doubletree Ranch Road Suite #150 Scottsdale Arizona 85258 Phone: 480.367.0700 Fax: 480.367.8341 www.nathanandassociatesinc.com 99TH AVENUE AND GLENDALE AVENUE S URROUNDING
AVAILABLE FOR LEASE Mayfield Road. Mayfield Heights, Ohio
 1,700 SF Retail Space For Lease Property Highlights Below market lease rates Refurbished in 2016 Furniture, fixtures and equipment available for purchase Fully built out restaurant space with hood Excellent
Spring Creek. Edmond, Oklahoma COLLETT& ASSOCIATES. 130,000+/- Square Feet Open-Air Shopping Center Development. The Bridges At
 The Bridges At Spring Creek E 15th Street & Bryant Avenue Edmond, Oklahoma 130,000+/- Square Feet Open-Air Shopping Center Development COLLETT& ASSOCIATES SOONER INVESTMENT Commercial & Investment Real
TitleMax INVESTMENT OFFERING. Todd Bunke South Western Avenue Blue Island, IL 60406
 INVESTMENT OFFERING TitleMax 12434 South Western Avenue Blue Island, IL 60406 Todd Bunke 404.964.9048 tbunke@atlantaregroup.com Confidentiality Agreement This is a confidential Memorandum intended solely
Brannon Crossing 4089 Lexington Road Lexington, KY 40356
 Brannon Crossing Retail Space Available 1.075 1.33 Acres 4,051 Cars Per Day 45,448 Cars Per Day Lexington/Nicolasville Road, U.S. 27 Brannon Road, KY 2080 Property Highlights Located in strong retail corridor
CLICK FOR DRONE IMAGES. Click Image For Online Property Map
 CLICK FOR DRONE IMAGES O F F E R I N G M E M O R A N D U M Click Image For Online Property Map DISCLOSURE : All materials and information received or derived from Fortis Net Lease (hereinafter collectively
Retail Space Available
 Retail Space Available SRS Real Estate Partners 1871 The Alameda, Suite 250 San Jose, CA 95126 408.553.6135 www.srsre.com Exclusive Leasing Agents Randol Mackley Bruce Frazer Senior Vice President Senior
University Town Center
 University Town Center Norman, Oklahoma 2,000,000 +/- SF Regional Lifestyle Center Phase I Anchored by Target ~ Phase II Anchored by Kohls Home to the John Q. Hammons Embassy Suites Hotel & Convention
Shingle Creek. Minneapolis neighborhood profile. About this area. Trends in the area. Neighborhood in Minneapolis. October 2011
 neighborhood profile October 2011 About this area The neighborhood is bordered by 53rd Avenue North, Humboldt Avenue North, 49th Avenue North, and Xerxes Avenue North. It is home to Olson Middle School.
Commercial Land for Sale. Messina Highlands Acres / W. Market St. & Richland Ave West Market Street; York, PA SITE
 3 2018 Messina Highlands 2.21 Acres / W. Market St. & Richland Ave. ; SITE York Fuel Stop / Tobacco Outlet T & D Car Wash 2.21 Acres Commercial Land Available for Sale 12,000 CPD on West Market Street
Economic Overview. Lawrence, KS MSA
 Economic Overview Lawrence, KS MSA March 5, 2019 DEMOGRAPHIC PROFILE... 3 EMPLOYMENT TRENDS... 5 UNEMPLOYMENT RATE... 5 WAGE TRENDS... 6 COST OF LIVING INDEX... 7 INDUSTRY SNAPSHOT... 8 OCCUPATION SNAPSHOT...
University of Minnesota
 neighborhood profile October 2011 About this area The University neighborhood is bordered by 11th Avenue Southeast, University Avenue, 15th Avenue Southeast, the railroad tracks, Oak Street, and the Mississippi
2018:IIIQ Nevada Unemployment Rate Demographics Report*
 2018:IIIQ Nevada Unemployment Rate Demographics Report* Department of Employment, Training & Rehabilitation Research and Analysis Bureau Dr. Tiffany Tyler-Garner, Director Dennis Perea, Deputy Director
Mid - City Industrial
 Minneapolis neighborhood profile October 2011 Mid - City Industrial About this area The Mid-City Industrial neighborhood is bordered by I- 35W, Highway 280, East Hennepin Avenue, and Winter Street Northeast.
Camden Industrial. Minneapolis neighborhood profile. About this area. Trends in the area. Neighborhood in Minneapolis.
 Minneapolis neighborhood profile October 2011 Camden Industrial About this area The Camden Industrial neighborhood is bordered by 48th Avenue North, the Mississippi River, Dowling Avenue North, Washington
Town Profiles: Demographic, Economic, and Housing Statistics for De Smet City and Wall Town, SOuth Dakota
 South Dakota State University Open PRAIRIE: Open Public Research Access Institutional Repository and Information Exchange Census Data Center News Releases SDSU Census Data Center 12-7-2017 Town Profiles:
Tyler Area Economic Overview
 Tyler Area Economic Overview Demographic Profile. 2 Unemployment Rate. 4 Wage Trends. 4 Cost of Living Index...... 5 Industry Clusters. 5 Occupation Snapshot. 6 Education Levels 7 Gross Domestic Product
Washington, DC. HFA Performance Data Reporting- Borrower Characteristics
 HFA Performance Data Reporting- Borrower Characteristics QTD Cumulative 1 Unique Borrower Count 2 Number of Unique Borrowers Receiving Assistance 19 767 3 Number of Unique Borrowers Denied Assistance 5
What America Is Thinking On Energy Issues February 2016
 What America Is Thinking On Energy Issues February 2016 South Carolina Presented by: Harris Poll Interviewing: January 22-31, 2016 Respondents: 600 Registered Voters Method: Telephone Weighting: Results
What America Is Thinking About Energy Issues February 2016 Presented by: Harris Poll
 What America Is Thinking About Energy Issues February 2016 Virginia Presented by: Harris Poll Interviewing: January 22 February 1, 2016 Respondents: 630 Registered Voters Method: Telephone Weighting: Results
SDs from Regional Peer Group Mean. SDs from Size Peer Group Mean
 Family: Population Demographics Population Entire MSA 602894 Central Cities (CC) 227,818 Outside Central Cities 375,076 Percent of Entire MSA 37.79% Population in CC Percent Change in Population from 1999
SDs from Regional Peer Group Mean. SDs from Size Peer Group Mean
 Family: Population Demographics Population Entire MSA 1187941 Central Cities (CC) 511,843 Outside Central Cities 676,098 Percent of Entire MSA 43.09% Population in CC Percent Change in Population from
SDs from Regional Peer Group Mean. SDs from Size Peer Group Mean
 Family: Population Demographics Population Entire MSA 661645 Central Cities (CC) 247,057 Outside Central Cities 414,588 Percent of Entire MSA 37.34% Population in CC Percent Change in Population from 1999
SDs from Regional Peer Group Mean. SDs from Size Peer Group Mean
 Family: Population Demographics Population Entire MSA 583845 Central Cities (CC) 316,649 Outside Central Cities 267,196 Percent of Entire MSA 54.24% Population in CC Percent Change in Population from 1999
SDs from Regional Peer Group Mean. SDs from Size Peer Group Mean
 Family: Population Demographics Population Entire MSA 1251509 Central Cities (CC) 540,423 Outside Central Cities 711,086 Percent of Entire MSA 43.18% Population in CC Percent Change in Population from
SDs from Regional Peer Group Mean. SDs from Size Peer Group Mean
 Family: Population Demographics Population Entire MSA 1135614 Central Cities (CC) 677,766 Outside Central Cities 457,848 Percent of Entire MSA 59.68% Population in CC Percent Change in Population from
SDs from Regional Peer Group Mean. SDs from Size Peer Group Mean
 Family: Population Demographics Population Entire MSA 591932 Central Cities (CC) 260,970 Outside Central Cities 330,962 Percent of Entire MSA 44.09% Population in CC Percent Change in Population from 1999
SDs from Regional Peer Group Mean. SDs from Size Peer Group Mean
 Family: Population Demographics Population Entire MSA 1100491 Central Cities (CC) 735,617 Outside Central Cities 364,874 Percent of Entire MSA 66.84% Population in CC Percent Change in Population from
SDs from Regional Peer Group Mean. SDs from Size Peer Group Mean
 Family: Population Demographics Population Entire MSA 540258 Central Cities (CC) 198,915 Outside Central Cities 341,343 Percent of Entire MSA 36.82% Population in CC Percent Change in Population from 1999
SDs from Regional Peer Group Mean. SDs from Size Peer Group Mean
 Family: Population Demographics Population Entire MSA 1249763 Central Cities (CC) 691,295 Outside Central Cities 558,468 Percent of Entire MSA 55.31% Population in CC Percent Change in Population from
SDs from Regional Peer Group Mean. SDs from Size Peer Group Mean
 Family: Population Demographics Population Entire MSA 1088514 Central Cities (CC) 272,953 Outside Central Cities 815,561 Percent of Entire MSA 25.08% Population in CC Percent Change in Population from
SDs from Regional Peer Group Mean. SDs from Size Peer Group Mean
 Family: Population Demographics Population Entire MSA 922516 Central Cities (CC) 470,859 Outside Central Cities 451,657 Percent of Entire MSA 51.04% Population in CC Percent Change in Population from 1999
SDs from Regional Peer Group Mean. SDs from Size Peer Group Mean
 Family: Population Demographics Population Entire MSA 687249 Central Cities (CC) 198,500 Outside Central Cities 488,749 Percent of Entire MSA 28.88% Population in CC Percent Change in Population from 1999
SDs from Regional Peer Group Mean. SDs from Size Peer Group Mean
 Family: Population Demographics Population Entire MSA 542149 Central Cities (CC) 181870 Outside Central Cities 360279 Percent of Entire MSA 33.55% Population in CC Percent Change in Population from 1999
SDs from Regional Peer Group Mean. SDs from Size Peer Group Mean
 Family: Population Demographics Population Entire MSA 1025598 Central Cities (CC) 293,834 Outside Central Cities 731,764 Percent of Entire MSA 28.65% Population in CC Percent Change in Population from
SDs from Regional Peer Group Mean. SDs from Size Peer Group Mean
 Family: Population Demographics Population Entire MSA 875583 Central Cities (CC) 232,835 Outside Central Cities 642,748 Percent of Entire MSA 26.59% Population in CC Percent Change in Population from 1999
SDs from Regional Peer Group Mean. SDs from Size Peer Group Mean
 Family: Population Demographics Population Entire MSA 716998 Central Cities (CC) 448,275 Outside Central Cities 268,723 Percent of Entire MSA 62.52% Population in CC Percent Change in Population from 1999
SDs from Regional Peer Group Mean. SDs from Size Peer Group Mean
 Family: Population Demographics Population Entire MSA 1333914 Central Cities (CC) 284,943 Outside Central Cities 1,048,971 Percent of Entire MSA 21.36% Population in CC Percent Change in Population from
SDs from Regional Peer Group Mean. SDs from Size Peer Group Mean
 Family: Population Demographics Population Entire MSA 712738 Central Cities (CC) 448,607 Outside Central Cities 264,131 Percent of Entire MSA 62.94% Population in CC Percent Change in Population from 1999
SDs from Regional Peer Group Mean. SDs from Size Peer Group Mean. Population Entire MSA
 Family: Population Demographics Population Entire MSA 1169641 Central Cities (CC) 0 Outside Central Cities 1,169,641 Percent of Entire MSA 0% Population in CC Percent Change in Population from 1999 to
Premier Boulevard Outparcels Roanoke Rapids, NC 27870
 1.69 AC 1.46 AC 1.24 AC NCDOT Premier Boulevard Extension 3.01 AC 1.05 AC 1.10 AC 17,000 VPD Exit 173 1.76 AC 42,000 VPD PROPERTY HIGHLIGHTS Developed Outparcels Available in WalMart Supercenter anchored
SDs from Regional Peer Group Mean. SDs from Size Peer Group Mean
 Family: Population Demographics Population Entire MSA 3251876 Central Cities (CC) 2,078,750 Outside Central Cities 1,173,126 Percent of Entire MSA 63.92% Population in CC Percent Change in Population from
SDs from Regional Peer Group Mean. SDs from Size Peer Group Mean
 Family: Population Demographics Population Entire MSA 1592383 Central Cities (CC) 1,181,140 Outside Central Cities 411,243 Percent of Entire MSA 74.17% Population in CC Percent Change in Population from
SDs from Regional Peer Group Mean. SDs from Size Peer Group Mean
 Family: Population Demographics Population Entire MSA 1776062 Central Cities (CC) 716,793 Outside Central Cities 1,059,269 Percent of Entire MSA 40.36% Population in CC Percent Change in Population from
SDs from Regional Peer Group Mean. SDs from Size Peer Group Mean
 Family: Population Demographics Population Entire MSA 4112198 Central Cities (CC) 416,474 Outside Central Cities 3,695,724 Percent of Entire MSA 10.13% Population in CC Percent Change in Population from
SDs from Regional Peer Group Mean. SDs from Size Peer Group Mean
 Family: Population Demographics Population Entire MSA 9519338 Central Cities (CC) 4408996 Outside Central Cities 5110342 Percent of Entire MSA 46.32% Population in CC Percent Change in Population from
SDs from Regional Peer Group Mean. SDs from Size Peer Group Mean
 Family: Population Demographics Population Entire MSA 1623018 Central Cities (CC) 152397 Outside Central Cities 1470621 Percent of Entire MSA 9.39% Population in CC Percent Change in Population from 1999
SDs from Regional Peer Group Mean. SDs from Size Peer Group Mean
 Family: Population Demographics Population Entire MSA 1731183 Central Cities (CC) 776733 Outside Central Cities 954450 Percent of Entire MSA 44.87% Population in CC Percent Change in Population from 1999
SDs from Regional Peer Group Mean. SDs from Size Peer Group Mean
 Family: Population Demographics Population Entire MSA 2968806 Central Cities (CC) 669,769 Outside Central Cities 2,299,037 Percent of Entire MSA 22.56% Population in CC Percent Change in Population from
SDs from Regional Peer Group Mean. SDs from Size Peer Group Mean
 Family: Population Demographics Population Entire MSA 2846289 Central Cities (CC) 809063 Outside Central Cities 2037226 Percent of Entire MSA 28.43% Population in CC Percent Change in Population from 1999
SDs from Regional Peer Group Mean. SDs from Size Peer Group Mean
 Family: Population Demographics Population Entire MSA 4441551 Central Cities (CC) 1147720 Outside Central Cities 3293831 Percent of Entire MSA 25.84% Population in CC Percent Change in Population from
SDs from Regional Peer Group Mean. SDs from Size Peer Group Mean
 Family: Population Demographics Population Entire MSA 1500741 Central Cities (CC) 661799 Outside Central Cities 838942 Percent of Entire MSA 44.1% Population in CC Percent Change in Population from 1999
SDs from Regional Peer Group Mean. SDs from Size Peer Group Mean
 Family: Population Demographics Population Entire MSA 2552994 Central Cities (CC) 686992 Outside Central Cities 1866002 Percent of Entire MSA 26.91% Population in CC Percent Change in Population from 1999
FOR LEASE SUGARCREEK VILLAGE SW Freeway, Sugar Land, Texas 77478
 FOR LEASE SUGARCREEK VILLAGE 13703 SW Freeway, Sugar Land, Texas 77478 Property Features: 4,150 Sq. Ft. End Cap on Sugar Creek Boulevard available 1,480 Sq. Ft. available 12/1/18 Anchored by Fishing Tackle
SDs from Regional Peer Group Mean. SDs from Size Peer Group Mean
 Family: Population Demographics Population Entire MSA 2414616 Central Cities (CC) 764431 Outside Central Cities 1650185 Percent of Entire MSA 31.66% Population in CC Percent Change in Population from 1999
Independence, MO Data Profile 2015
 , MO Data Profile 2015 5 year American Community Survey (ACS) Jackson County, Missouri Data sources: U.S. Census Bureau, American Community Survey (ACS), 2011 2015 (released December 8, 2016), compared
Lapkoff & Gobalet Demographic Research, Inc.
 Lapkoff & Gobalet Demographic Research, Inc. 22361 Rolling Hills Road, Saratoga, CA 95070-6560 (408) 725-8164 Fax (408) 725-1479 2120 6 th Street #9, Berkeley, CA 94710-2204 (510) 540-6424 Fax (510) 540-6425
Economic Overview Fairfax / Falls Church. October 23, 2017
 Economic Overview Fairfax / Falls Church October 23, 2017 DEMOGRAPHIC PROFILE... 3 EMPLOYMENT TRENDS... 5 UNEMPLOYMENT RATE... 5 WAGE TRENDS... 6 COST OF LIVING INDEX... 6 INDUSTRY SNAPSHOT... 7 OCCUPATION
2016 Labor Market Profile
 2016 Labor Market Profile Prepared by The Tyler Economic Development Council Tyler Area Sponsor June 2016 The ability to demonstrate a regions availability of talented workers has become a vital tool
ECONOMIC OVERVIEW DuPage County, Illinois
 ECONOMIC OVERVIEW DuPage County, Illinois DEMOGRAPHIC PROFILE... 3 EMPLOYMENT TRENDS... 5 UNEMPLOYMENT RATE... 5 WAGE TRENDS... 6 COST OF LIVING INDEX... 7 INDUSTRY SNAPSHOT... 8 OCCUPATION SNAPSHOT...
INVESTMENT OFFERING. Fairview Park 6728 W. Fairveiw Ave. Boise, ID N ALLUMBAUGH ST W FAIRVIEW AVE N FRY ST N RAYMOND ST
 INVESTMENT OFFERING Fairview Park 6728 W. Fairveiw Ave. Boise, ID 83704 N ALLUMBAUGH ST W FAIRVIEW AVE N FRY ST N RAYMOND ST Confidentiality Agreement Fairview Park 6728 W. Fairview Ave Boise, ID 83704
Economic Overview York County, South Carolina. February 14, 2018
 Economic Overview York County, February 14, 2018 DEMOGRAPHIC PROFILE... 3 EMPLOYMENT TRENDS... 5 UNEMPLOYMENT RATE... 5 WAGE TRENDS... 6 COST OF LIVING INDEX... 6 INDUSTRY SNAPSHOT... 7 OCCUPATION SNAPSHOT...
Monte Vista Population, ,744 4,651 4,564 4,467 4,458 4,432 4,451
 1 Monte Vista 4,8 4,7 4,6 4,5 4,4 4,3 4,2 4,1 4,61 4,612 4,61 4,676 Monte Vista, 2-213 4,744 4,651 4,564 4,467 4,458 4,432 4,451 4,418 4,412 4,355 2 21 22 23 24 25 26 27 28 29 21 211 212 213 Year Monte
LAND FOR SALE Blair Road, Mint Hill, NC PROPERTY OVERVIEW. Large parcel with I-485 access via Blair Road exit in the path of. growth.
 LAND FOR SALE 10395 Blair Road, Mint Hill, NC 28227 OFFERING SUMMARY SALE PRICE: $1,000,000 PROPERTY OVERVIEW Large parcel with I485 access via Blair Road exit in the path of growth. LOT SIZE: 9.28 Acres
LEASE City Avenue Philadelphia, PA Agent Contact: LEASE FOR $20 S/F PLUS UTILITES. Lisa Trout
 LEASE 4920-50 City Avenue Philadelphia, PA 19131 C APITAL COMMERCIAL R EAL ESTATE G ROUP 3748 West Chester Pike Newtown Square, PA 19073 Phone: 610-359-9700 Fax: 610-359-9750 www.capitalcomre.com BEAUTIFUL
Economic Overview Long Island
 Report created on August 29, 2017 Economic Overview Long Island Contact: Lisa.Montiel@suny.edu DEMOGRAPHIC PROFILE... 3 EMPLOYMENT TRENDS... 5 UNEMPLOYMENT RATE... 5 WAGE TRENDS... 6 COST OF LIVING INDEX...
Economic Overview Long Island
 Report created on October 20, 2015 Economic Overview Long Island Created using: Contact: Lisa.Montiel@suny.edu DEMOGRAPHIC PROFILE...3 EMPLOYMENT TRENDS...5 UNEMPLOYMENT RATE...5 WAGE TRENDS...6 COST OF
Houma Shopping Center
 Houma Shopping Blvd Retail Space Available 2,000 SF HOUMA SHOPPING CENTER tin ar M e th Lu g in rk 27,10 0A DT d. v Bl Property Highlights Walmart shadow anchored center Established community with high
Exploring the Geography of College Opportunity
 E D U C A T I O N P O L I C Y P R O G R A M Exploring the Geography of College Opportunity Data and Methodology Kristin Blagg and Victoria Rosenboom April 2018 (updated May 2018) Data Our analysis builds
Risk and Technology Review - Analysis of Socio-Economic Factors for Populations Living Near Hard Chromium Electroplating Facilities
 Risk and Technology Review - Analysis of Socio-Economic Factors for Populations Living Near Hard Chromium Electroplating Facilities Prepared by: EC/R Incorporated 501 Eastowne Drive, Suite 250 Chapel Hill,
Random digital dial Results are weighted to be representative of registered voters Sampling Error: +/-4% at the 95% confidence level
 South Carolina Created for: American Petroleum Institute Presented by: Harris Poll Interviewing: November 18 22, 2015 Respondents: 607 Registered Voters in South Carolina Method: Telephone Sample: Random
Economic Overview Prince William/Manassas. October 23, 2017
 Economic Overview Prince William/Manassas October 23, 2017 DEMOGRAPHIC PROFILE... 3 EMPLOYMENT TRENDS... 5 UNEMPLOYMENT RATE... 5 WAGE TRENDS... 6 COST OF LIVING INDEX... 6 INDUSTRY SNAPSHOT... 7 OCCUPATION
For Sale ± 1.25 Acres 2 Bay Chevron Service Station East John Ralston Road, Houston, TX 77029
 For Sale ± 1.25 Acres 2 Bay Chevron Service Station 11103 East Freeway @ John Ralston Road, Houston, TX 77029 DAC REALTY GROUP, INC CenterPointe Hotels SITE Description: Location: Land Size: Building Size:
Economic Overview 45-Minute Commute From Airport Park. June 6, 2017
 Economic Overview 45-Minute Commute From Airport Park June 6, 2017 DEMOGRAPHIC PROFILE... 3 EMPLOYMENT TRENDS... 5 WAGE TRENDS... 5 COST OF LIVING INDEX... 6 INDUSTRY SNAPSHOT... 7 OCCUPATION SNAPSHOT...
Economic Overview Western New York
 Report created on August 29, 2017 Economic Overview Western New Contact: Lisa.Montiel@suny.edu DEMOGRAPHIC PROFILE... 3 EMPLOYMENT TRENDS... 5 UNEMPLOYMENT RATE... 5 WAGE TRENDS... 6 COST OF LIVING INDEX...
INVESTMENT OFFERING MEMORANDUM 5325 S FORT APACHE RD, LAS VEGAS, NV SPANISH HILLS PLAZA
 702.787.0123 1333 N Buffalo Dr, Ste 120 Las Vegas, NV 89128 www.virtusco.com INVESTMENT OFFERING MEMORANDUM 5325 S FORT APACHE RD, LAS VEGAS, NV 89148 SPANISH HILLS PLAZA Exclusive AdvisorS ROB HATRAK
Economic Overview Plant City Region. April 5, 2017
 Economic Overview Plant City Region April 5, 2017 DEMOGRAPHIC PROFILE... 3 EMPLOYMENT TRENDS... 5 WAGE TRENDS... 5 COST OF LIVING INDEX... 6 INDUSTRY SNAPSHOT... 7 OCCUPATION SNAPSHOT... 9 INDUSTRY CLUSTERS...
Economic Overview City of Tyler, TX. January 8, 2018
 Economic Overview City of Tyler, TX January 8, 2018 DEMOGRAPHIC PROFILE...3 EMPLOYMENT TRENDS...5 WAGE TRENDS...5 COST OF LIVING INDEX...6 INDUSTRY SNAPSHOT...7 OCCUPATION SNAPSHOT...9 INDUSTRY CLUSTERS...
Economic Overview Capital District
 August 29, 2017 Economic Overview Capital District Contact: Lisa.Montiel@suny.edu DEMOGRAPHIC PROFILE... 3 EMPLOYMENT TRENDS... 5 UNEMPLOYMENT RATE... 5 WAGE TRENDS... 6 COST OF LIVING INDEX... 6 INDUSTRY
Access and Infrastructure National April 2014
 Access and Infrastructure National April 2014 Created for: American Petroleum Institute Presented by: Nielsen Interviewing: April 3-9, 2014 Respondents: 1,003 Registered Voters Method: Telephone Sample:
Kenwood Galleria 8118 Montgomery Road Cincinnati, OH 45236
 Hosbrook Rd Kenwood Galleria Fully Occupied Montgomery Rd Property Highlights Located in the affluent Kenwood submarket Established retail presence with a strong demand for vacant space Signage available