October Franklin & Marshall. College Poll SUMMARY OF FINDINGS. Prepared by: Center for Opinion Research. Floyd Institute for Public Policy
|
|
|
- Kevin Dixon
- 5 years ago
- Views:
Transcription

1 For immediate release November 1, 2018 October 2018 Franklin & Marshall College Poll SUMMARY OF FINDINGS Prepared by: Center for Opinion Research Floyd Institute for Public Policy Franklin & Marshall College
2 Table of Contents TABLE OF CONTENTS... 2 KEY FINDINGS... 3 VOTER INTEREST AND TURNOUT... 4 PRESIDENT TRUMP: JOB PERFORMANCE... 5 SENATOR CASEY: JOB PERFORMANCE AND RE-ELECTION... 8 GOVERNOR WOLF: JOB PERFORMANCE AND RE-ELECTION... 8 PERSPECTIVES ON THE GUBERNATORIAL AND SENATE RACES THE ELECTORAL CONTEXT IN PENNSYLVANIA METHODOLOGY ATTACHMENT A ATTACHMENT A MARGINAL FREQUENCY REPORT
3 Key Findings The October 2018 Franklin & Marshall College Poll finds that nearly three in four (71%) of the state s registered voters are very interested in the 2018 elections, an increase of ten points since our September survey. At the moment, similar proportions of Republicans (75%) and Democrats (73%) say they are very interested in the election which is a change from our September survey when more Democrats (64%) than Republicans (58%) or independents (49%) were very interested. Interest in the election is higher among all three groups than it was in August or September. Voters evaluations of how well key political figures are doing their jobs have remained remarkably stable compared to prior surveys. About one in two (54%) registered voters in Pennsylvania believes Governor Wolf is doing an excellent or good job as governor. Two in five (43%) registered voters believe Senator Casey is doing an excellent or good job as the state s US Senator. About one in three (36%) registered voters in Pennsylvania believes President Trump is doing an excellent or good job as president. President Trump continues to be an essential motivating force in the upcoming mid-term elections. More registered voters prefer the Democratic candidate for U.S. House (53%) than the Republican candidate for U.S. House (38%); two in three (69%) of those who plan to vote for a Democratic candidate are casting their ballot mainly as a vote against President Trump and Republicans in Congress, while four in five (83%) of those who plan to vote for a Republican candidate are casting their ballot mainly as a vote to support President Trump and the Republicans in Congress. The link between congressional choice as support or opposition to the President has intensified since August. Moreover, one of the common reasons voters provide for supporting their U.S. Senate choice relates to the President. 3
4 Voter Interest and Turnout Nearly three in four (71%) of the state s registered voters are very interested in the 2018 elections, an increase of ten points since our September survey. At the moment, similar proportions of Republicans (75%) and Democrats (73%) say they are very interested in the election which is a change from our September survey when more Democrats (64%) than Republicans (58%) or independents (49%) were very interested. Interest in the election is higher among all three groups than it was in August or September. Self-described liberals (77%) and conservatives (75%) are more likely than moderates (67%) to say they are very interested in the election. Liberals (74%) were more likely than conservatives (61%) or moderates (49%) to say they were very interested in our September survey. Republicans and conservatives in Pennsylvania have closed the gap in enthusiasm that was apparent earlier in the election cycle. The confirmation of Brett Kavanaugh (63%), efforts to repeal the Affordable Care Act (ACA) (60%), and the separation of immigrant families (57%) have each made voters a great deal more interested in voting. Members of both parties are equally motivated by the Kavanaugh hearings, while Democrats and liberals are much more motivated by efforts to repeal the ACA and the administration s family separation policies than are Republicans or conservatives. The outcomes of the 2018 mid-terms will be driven by differences in voter turnout among partisans, but likely voter models based on administrative data and self-described interest produce different results. For example, two in five (40%) voters in the sample have voted in the past three general elections; this would produce an electorate with similar proportions of Republicans (42%) and Democrats (43%) voting. But more Democrats (50%) than Republicans (40%) will vote if selfdescribed interest and intention to vote is used to measure turnout. 4
5 President Trump: Job Performance About two in five (36%) registered voters in Pennsylvania believes President Trump is doing an excellent or good job as president, which is similar to his ratings in recent surveys. Figure 1 compares President Trump s job ratings to President Obama s job ratings; President Trump s current rating is about the same as President Obama s rating in Pennsylvania at a similar point in his Presidency. A majority of Republicans (77%) rate the President s performance positively, while fewer Democrats (8%) or independents (16%) do so. Conservatives (80%) are more likely than moderates (22%) or liberals (2%) to give the President positive job approval ratings. Figure 1: 5
6 Voter dissatisfaction with the direction of the country and relatively low enthusiasm about personal finances are likely constraints on the President s approval ratings. One in three (35%) registered voters believes the country is headed in the right direction. Only one in four (28%) says they are financially better off than a year ago and about the same proportion (27%) expect to be financially better off a year from now. About one in three (33%) voters say they have had an increase in their income because of the tax cut passed in December, although most (54%) of these respondents report seeing only a small increase. Most respondents do not believe (39%) or do not know (21%) that the Trump Administration has made significant changes to the Affordable Care Act. Half (51%) of those who believe administrative changes to the ACA have been made say those changes will make the healthcare system worse for them. Voters judgments about tax cuts and administrative changes to the Affordable Care Act relate to voters ratings of the President and have not changed since prior surveys. President Trump is perceived as doing best at creating new jobs and dealing with terrorism. He receives his lowest ratings for improving public education, dealing with climate change, and protecting the environment (Figure 2). These specific ratings have remained remarkably stable, as is true of his overall approval ratings. President Trump continues to be an essential motivating force in the upcoming mid-term elections. More registered voters prefer the Democratic candidate for U.S. House (53%) than the Republican candidate for U.S. House (38%); three in four (69%) of those who plan to vote for a Democratic candidate are casting their ballot mainly as a vote against President Trump and Republicans in Congress, while four in five (83%) of those who plan to vote for a Republican candidate are casting their ballot mainly as a vote to support President Trump and the Republicans in Congress. The link between congressional choice as support or opposition to the President has 6
7 intensified since August. Moreover, one of the most common reasons voters provide for supporting their U.S. Senate choice relates to the President. Figure 2: 7
8 Senator Casey: Job Performance and Re-Election Two in five (43%) registered voters in Pennsylvania believe Senator Casey is doing an excellent or good job as the state s U.S. Senator, which is similar to his ratings in recent surveys. Two-thirds (70%) of registered Democrats, one in three (33%) independents, and one in seven (13%) Republicans provide positive ratings of the Senator s job performance. Senator Casey (50%) currently holds a lead over his Republican challenger, Representative Lou Barletta (35%), among likely voters, although one in seven (14%) voters remains undecided. The dynamics of the race have changed little since our prior surveys and reflect the fact that one in three (36%) voters don t know enough about Mr. Barletta to have an opinion. Mr. Barletta is better known among voters than he has been in prior surveys; in September, half (51%) of voters did not know enough about him to have an opinion. Governor Wolf: Job Performance and Re-Election About one in two (54%) registered voters in Pennsylvania believes Governor Wolf is doing an excellent or good job as governor, which is similar to his ratings in prior surveys. Four in five (82%) Democrats, one in two (48%) independents, and one in five (19%) Republicans provide positive ratings of the Governor s job performance. Figure 3 compares Governor Wolf s job performance ratings to his recent predecessors. Wolf s job performance rating is similar to Governor Rendell s and better than Governor Corbett s at similar points during their terms in office. 8
9 Figure 3: Governor Wolf (59%) currently holds a comfortable lead over his Republican challenger, former State Senator Scott Wagner (33%), among likely voters, with few (5%) voters remaining undecided. The dynamics of the race have shifted considerably in favor of Governor Wolf and reflect a significant change in the way voters assess Senator Wagner. More voters are now aware of Senator Wagner s candidacy, falling from 47% who did not know enough about the candidate in June 2018 to 21% in the current survey, but he is now viewed far more negatively (47% have an unfavorable opinion of him now compared to 31% in September) than positively (27% have a favorable opinion of Senator Wagner now compared to 22% in September). Simply put, Senator Wagner s net favorability rating has declined from minus 9 in September to minus 20. 9
10 Perspectives on the Gubernatorial and Senate Races This poll shows that both incumbent Democrats have comfortable leads in their respective races. Governor Wolf s lead is so large that some might rightfully be skeptical that such an outcome is possible given the current state of electoral politics. There is historical precedent for large electoral victories in paired Gubernatorial-Senate contests. In 1998, incumbent Republican Governor Tom Ridge handily defeated State Representative Ivan Itkin by 26 points at the same time that Senator Arlen Specter defeated Democrat Bill Lloyd by 26 points. More recently in 2006, incumbent Democrat Ed Rendell defeated Lynn Swann by 20 points while Bob Casey, Jr. defeated incumbent Republican Senator Rick Santorum by 18 points. This survey suggests that the primary reasons the Democratic incumbents large leads result from two factors, Democratic enthusiasm and Democratic cohesion. Democrats and Republicans are equally motivated at the moment to vote, which negates the turnout advantage Republicans typically have in mid-term elections. Second, Democrats are voting as a block for Democratic candidates, whereas Republicans seem a bit more likely to split their tickets at the moment. Our likely voter models show that large shares of Democrats plan to vote for Wolf (83%), Casey (83%), and their local US House candidate (87%). Smaller shares of Republicans currently plan to vote for Wagner (63%), Barletta (68%), or their local US House candidate (76%). This suggests that the comfortable leads that the Democratic incumbents currently hold could erode as registered Republicans move back to their party s candidate. 10
11 The Electoral Context in Pennsylvania Comparing 2018 electoral indicators to indicators from the prior three gubernatorial elections in Pennsylvania provides some context about what might be expected this year. In the 2006 election, Democrats retained the governor s office, defeated an incumbent Republican U.S. senator, and picked up four U.S. house seats held by Republicans in a year that showed many favorable indicators for them. Conversely, in 2010 these electoral indicators showed Republicans had a real advantage and Republicans won the governor s office, a U.S. Senate seat, and 12 of 19 U.S. House seats. In 2014, the electoral indicators gave no clear advantage to either party and this was reflected in the final vote: Democrats managed to recapture the governor s office while Republicans captured 13 of the state s 18 U.S. House seats. Currently, optimism about the direction of the state is similar to 2006, and much better than in 2010 or The job performance rating for the incumbent governor is also similar to 2006, when the relatively popular incumbent Ed Rendell won re-election, and is much better than Governor Corbett s job performance ratings were in The incumbent president s popularity is similar for all these elections, which was an advantage for Democrats in 2006, a disadvantage in 2010 and 2014, and is again an advantage for Democrats in this cycle. President Trump s relatively low approval ratings could hurt Republican candidates this year (see Table 1). 11

12 Table 1:
13 Methodology The survey findings presented in this release are based on the results of interviews conducted October 22 28, The interviews were conducted at the Center for Opinion Research at Franklin & Marshall College on behalf of the Center for Politics and Public Affairs. The poll was designed and administered by the staff of the Center for Opinion Research. The data included in this release represent the responses of 537 Pennsylvania registered voters, including 254 Democrats, 211 Republicans, and 72 independents. The sample of registered voters was obtained from L2, formerly Labels & Lists. All sampled respondents were notified by letter about the survey. Interviews were completed over the phone and online depending on each respondent s preference. Survey results were weighted (age, gender, education, and party registration) using an iterative weighting algorithm to reflect the known distribution of those characteristics as reported by the Pennsylvania Department of State and Pennsylvania exit polls. The sample error for this survey is +/- 6.0 percentage points when the design effects from weighting are considered. In addition to sampling error, this poll is also subject to other sources of non-sampling error. Generally speaking, two sources of error concern researchers most. Nonresponse bias is created when selected participants either choose not to participate in the survey or are unavailable for interviewing. Response errors are the product of the question and answer process. Surveys that rely on self-reported behaviors and attitudes are susceptible to biases related to the way respondents process and respond to survey questions. The sample error for the 214 likely voters is +/- 9.5 percentage points. An alternative means of calculating the variation in a sample is to take a series of bootstrap samples from the original sample and to use those bootstrapped samples to produce an estimate of sampling error (see Canty, Angelo Resampling Methods in R: The boot Package. R News 2/3 (December): 2-7). The procedure involves resampling a data set, 13
14 calculating a statistic for each bootstrapped sample, accumulating the results of these samples and calculating a sample distribution. The standard error of the mean of 10,000 bootstrapped samples for the estimate of support for Governor Wolf was 2.1% and 95% of the samples fell within a range of 52% and 61%. This indicates the actual variability of the sample may be larger than standard formulas suggest. In past surveys, many political variables differed between web and telephone respondents. Currently, the political preferences of both groups are similar, although some demographic differences are evident: web respondents are more likely to be regular voters and are more likely to be middle age (see Figure 4). Figure 4: 14
15 Attachment A-1 15

16 Attachment A-2 16
17 Marginal Frequency Report Responses may not total 100% due to rounding. REG. Some people are registered to vote, and many others are not. Are you currently registered to vote at your present address? Yes 100% No 0% RegPARTY. Are you currently registered as a Republican, a Democrat, an Independent, or as something else? Republican 39% Democrat 48% Independent 9% Something else 3% Vote_Nov. Many people will vote in the election for governor and congress in November, however, many other people will not. What would you say are the chances you will vote in the November election? Are you certain to vote, will you probably vote, are the chances fifty-fifty you will vote, or don t you think that you will vote in the November election? Oct 2018 Sep 2018 Aug 2018 Jun 2018 Certain to vote 87% 83% 79% 76% Will probably vote 8% 10% 14% 12% Chances are fifty-fifty 3% 4% 4% 8% Don t think will vote 1% 4% 2% 4% Do not know 0% 0% 1% 0% Pol_Int. Some people don't pay much attention to political campaigns. How about you? Would you say that you are very much interested, somewhat interested or not very interested in the 2018 elections? Oct 2018 Sep 2018 Aug 2018 Jun 2018 Mar 2018 Very much interested 71% 60% 54% 55% 48% Somewhat interested 26% 32% 37% 40% 43% Not very interested 3% 9% 8% 6% 8% Do not know 1% 0% 1% 0% 0% 17
18 Please let me know your opinion of some people involved in politics today. Is your opinion of [FILL name] favorable, unfavorable, undecided, or haven t you heard enough about [FILL name] to have an opinion? (rotated) Strongly favorable Somewhat favorable Somewhat unfavorable Strongly unfavorable Undecided Don t know TOM WOLF Oct % 26% 13% 19% 4% 7% Sep % 27% 14% 19% 4% 9% Aug % 28% 15% 21% 3% 13% Jun % 30% 14% 19% 5% 13% Mar % 31% 16% 16% 6% 12% Sep % 20% 8% 34% 12% 10% Feb % 29% 15% 19% 13% 11% Feb % 25% 16% 27% 9% 9% Oct % 23% 13% 20% 16% 13% Aug % 21% 9% 17% 18% 13% Jun % 23% 10% 17% 19% 11% Mar % 18% 11% 16% 22% 11% Oct % 20% 7% 18% 18% 16% Sep % 21% 9% 13% 18% 21% Aug % 19% 7% 10% 22% 24% Jun % 20% 5% 7% 20% 32% SCOTT WAGNER Oct % 17% 13% 34% 6% 21% Sep % 15% 11% 20% 6% 40% Aug % 11% 9% 21% 7% 42% Jun % 13% 11% 19% 6% 47% LOU BARLETTA Oct % 11% 7% 25% 5% 36% Sep % 8% 7% 17% 6% 51% Aug % 9% 7% 15% 5% 53% Jun % 6% 6% 11% 3% 66% Mar % 7% 4% 9% 4% 69% Sep % 9% 3% 6% 8% 68% 18
19 Strongly Somewhat Somewhat Strongly Don t Undecided favorable favorable unfavorable unfavorable know BOB CASEY, JR. Oct % 25% 12% 18% 6% 17% Sep % 21% 11% 17% 6% 26% Aug % 27% 12% 17% 4% 25% Jun % 26% 10% 13% 5% 29% Mar % 26% 13% 12% 8% 25% Sep % 28% 10% 14% 11% 20% Feb % 25% 13% 12% 14% 21% Oct % 23% 10% 13% 16% 27% Aug % 22% 11% 13% 17% 26% May % 26% 9% 13% 17% 18% Feb % 27% 11% 13% 16% 21% Oct % 20% 12% 19% 14% 19% Sep % 23% 13% 16% 13% 22% Aug % 25% 12% 10% 16% 27% Jun % 24% 10% 8% 14% 29% Jan % 20% 9% 8% 18% 35% Mar % 19% 11% 8% 19% 37% May % 23% 9% 11% 16% 31% Mar % 24% 10% 11% 17% 29% Feb % 20% 9% 9% 15% 34% Jan % 23% 11% 9% 17% 31% Oct % 21% 9% 12% 15% 32% Aug % 24% 10% 8% 17% 24% Jun % 21% 12% 5% 17% 34% Feb % 19% 9% 8% 21% 32% DONALD TRUMP Oct % 11% 6% 55% 2% 1% Sep % 14% 4% 55% 0% 1% Aug % 13% 5% 52% 3% 1% Jun % 14% 7% 51% 3% 0% Mar % 15% 11% 49% 2% 2% Sep % 22% 9% 36% 6% 6% Feb % 14% 6% 51% 6% 1% Oct % 12% 6% 56% 3% 1% Sep % 12% 6% 54% 6% 1% Aug % 14% 7% 51% 5% 1% Jul % 13% 5% 57% 5% 0% Mar % 14% 9% 56% 7% 1% Feb % 15% 11% 51% 10% 1% 19
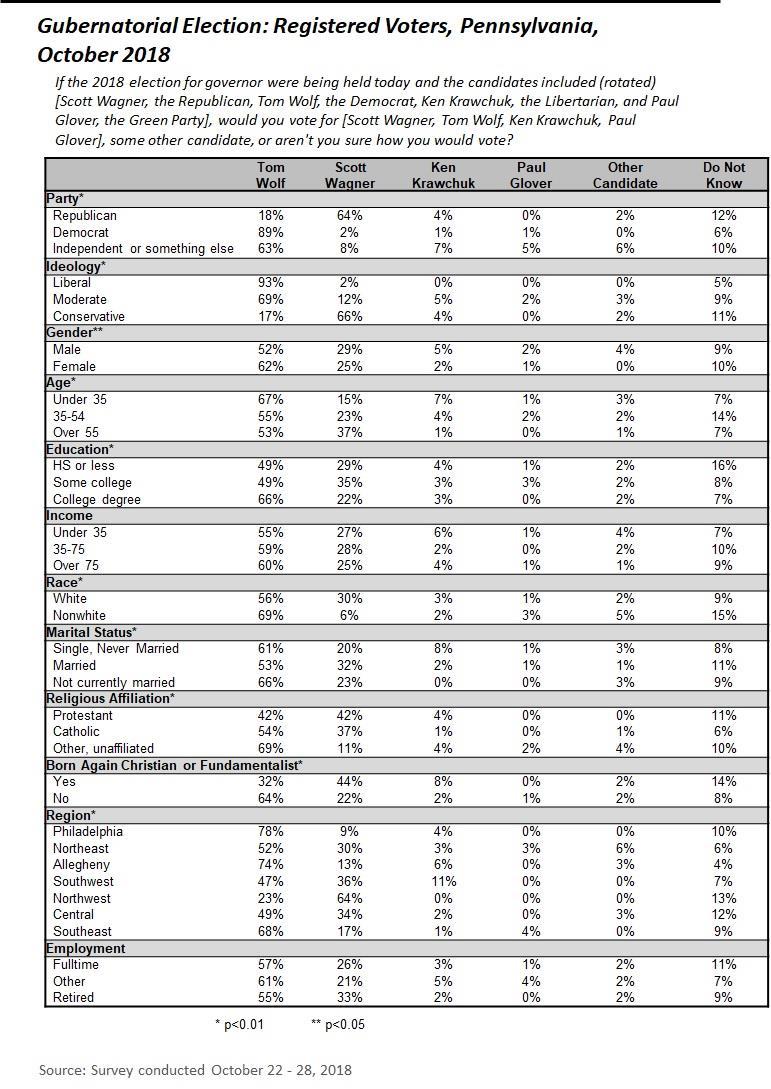
20 Vote_Gov. If the 2018 election for governor were being held today and the candidates included (rotated) [Scott Wagner, the Republican, Tom Wolf, the Democrat, Ken Krawchuk, the Libertarian, and Paul Glover, the Green Party], would you vote for [Scott Wagner, Tom Wolf, Ken Krawchuk, Paul Glover], some other candidate, or aren't you sure how you would vote? Oct 2018 Sep 2018 Aug 2018 Jun 2018 Tom Wolf, the Democrat 57% 52% 51% 48% Scott Wagner, the Republican 27% 28% 32% 29% Ken Krawchuk, the Libertarian 3% 1% 2% -- Paul Glover, the Green Party 1% 0% 2% -- Some other candidate 2% 1% 1% 1% Do not know 10% 18% 14% 23% Cert. Are you absolutely certain you will vote for [fill Vote_Gov] in the election, or are you still making up your mind? Wolf Oct 2018 Sep 2018 Aug 2018 Respondents with vote choice (n=306) (n=282) (n=256) Certain to vote for named candidate 87% 75% 72% Still making up mind 13% 24% 29% Do not now 0% 1% 0% Wagner Oct 2018 Sep 2018 Aug 2018 Respondents with vote choice (n=145) (n=153) (n=161) Certain to vote for named candidate 89% 77% 70% Still making up mind 11% 21% 27% Do not know 0% 2% 3% Lean_Gov. As of today, do you lean more to: (rotated) [Scott Wagner, the Republican, Tom Wolf, the Democrat, Ken Krawchuk, the Libertarian, and Paul Glover, the Green Party], or some other candidate? Oct 2018 Sep 2018 Aug 2018 Respondents without vote choice (n=64) (n=104) (n=77) Tom Wolf, the Democrat 24% 26% 18% Scott Wagner, the Republican 14% 13% 16% Paul Glover, the Green Party 0% 1% 0% Ken Krawchuk, the Libertarian 0% 0% 0% Some other candidate 14% 5% 8% Do not know 49% 55% 58% 20
21 ISSU_GOV. What issue will be most important to you when considering which candidate for governor you support? Oct 2018 Sep 2018 Aug 2018 Taxes 15% 12% 13% Healthcare, insurance 10% 6% 6% Education, schools 9% 10% 14% Align with political views/platforms 7% 8% 6% Government, politicians 6% 5% 6% Personal characteristic of candidate 6% 4% 3% Economy 5% 7% 5% Civil liberties 3% 3% 3% Immigration, illegal immigrants, refugees 3% 4% 4% Crime, drugs, violence, guns 3% 4% 2% Values and morality 3% 2% 3% Unemployment, personal finances 3% 2% 3% Donald Trump 2% 2% 3% Elder issues, social security 2% 3% 2% Environment 2% 2% 3% Gasoline, utility prices 2% 1% 1% Most qualified, most experienced 2% 1% 0% Candidate who will put the state on right track 2% 1% 1% Bipartisanship 1% 1% 0% Transportation, infrastructure 1% 0% 1% Social issues 1% 1% 1% Justice system, lawyers 0% 1% 1% Welfare 0% 1% 0% Racism 0% 1% 0% Terrorism, war, foreign policy 0% 1% 0% Retaining, attracting businesses 0% 1% 0% Other 5% 4% 3% Do not know 10% 14% 17% 21
22 Sen2018 If the November 2018 general election for U.S. Senator was being held today and the candidates were (rotated) [Lou Barletta, the Republican and Bob Casey Jr., the Democrat, Dale Kerns, the Libertarian candidate, and Neal Gale, the Green Candidate], would you vote for: [Lou Barletta, Bob Casey, Jr., Dale Kerns, Neal Gale], some other candidate, or aren't you sure how you would vote? Oct 2018 Sep 2018 Aug 2018 Jun 2018 Bob Casey, Jr., the Democrat 50% 48% 48% 44% Lou Barletta, the Republican 31% 30% 29% 27% Neal Gale, the Green Party 2% 1% 1% -- Dale Kerns, the Libertarian 1% 2% 1% -- Some other candidate 1% 1% 1% 1% Do not know 14% 20% 20% 28% Cert. Are you absolutely certain you will vote for [fill Sen2018] in the election, or are you still making up your mind? Casey Oct 2018 Sep 2018 Aug 2018 Respondents with vote choice (n=266) (n=258) (n=244) Certain to vote for named candidate 85% 77% 76% Still making up mind 15% 23% 24% Do not know 0% 1% 0% Barletta Oct 2018 Sep 2018 Aug 2018 Respondents with vote choice (n=168) (n=162) (n=150) Certain to vote for named candidate 85% 77% 74% Still making up mind 15% 21% 25% Do not know 0% 2% 1% Lean_Gov. As of today, do you lean more to: (rotated) [Lou Barletta, the Republican and Bob Casey Jr., the Democrat, Dale Kerns, the Libertarian candidate, and Neal Gale, the Green Candidate], or some other candidate? 31 Oct 2018 Sep 2018 Aug 2018 Respondents without vote choice (n=84) (n=112) (n=108) Bob Casey, Jr., the Democrat 14% 28% 23% Lou Barletta, the Republican 8% 9% 20% Neal Gale, the Green Party 4% 0% 0% Dale Kerns, the Libertarian 3% 0% 3% Some other candidate 7% 2% 4% Do not know 64% 60% 50% 22
23 ISSU_SEN. What issue will be most important to you when considering which candidate for Senate you support? Oct 2018 Sep 2018 Aug 2018 Align with political views/platforms 13% 11% 9% Healthcare, insurance 13% 5% 6% Donald Trump 8% 10% 11% Immigration, illegal immigrants, refugees 7% 6% 6% Taxes 5% 4% 6% Personal characteristic of candidate 4% 8% 6% Elder issues, social security 4% 3% 2% Government, politicians 3% 3% 5% Economy 3% 3% 3% Unemployment, personal finances 3% 2% 0% Values and morality 2% 4% 4% Crime, drugs, violence, guns 2% 4% 2% Civil liberties 2% 4% 1% Education, schools 2% 3% 4% Environment 2% 1% 4% Justice system, lawyers 1% 3% 1% Best option/dislike other candidate more 1% 1% 2% Candidate who will put country back on right track 1% 1% 2% Most qualified, most experienced 1% 1% 0% Bipartisanship 1% 1% 1% Terrorism, war, foreign policy 1% 1% 1% Social issues 1% 1% 0% Other 5% 3% 3% Do not know 16% 20% 21% GenBalH If the 2018 elections for the United States House of Representatives were being held today, would you vote for (rotated) [the Republican Party s candidate or the Democratic Party s] for the House in your district? Oct 2018 Sep 2018 Aug 2018 Jun 2018 Democratic Party s candidate 53% 51% 48% 50% Republican Party s candidate 38% 36% 39% 36% Do not know 9% 13% 13% 15% 23
24 AGSTTRUMP. Would you say your choice for the Democratic Party s candidate is mainly a vote against President Trump and the Republicans in Congress, or not? Oct 2018 Sep 2018 Aug 2018 Democratic Party voters (n=284) (n=279) (n=245) Yes (vote against President Trump and the Republicans in Congress) 69% 74% 67% No 31% 25% 31% Do not know 0% 1% 1% FORTRUMP. Would you say your choice for the Republican Party s candidate is mainly a vote to support President Trump and the Republicans in Congress, or not? Oct 2018 Sep 2018 Aug 2018 Republican Party voters (n=201) (n=194) (n=197) Yes (vote to support President Trump and the Republicans in Congress) 83% 80% 74% No 16% 17% 26% Do not know 1% 2% 0% Rate_Gov. How would you rate the way that Tom Wolf is handling his job as Governor? Would you say he is doing an excellent job, a good job, only a fair job, or a poor job as Governor? Excellent job Good job Only a fair job Poor job Don t know Oct % 40% 28% 16% 3% Sep % 38% 27% 18% 6% Aug % 38% 28% 20% 6% Jun % 36% 33% 16% 6% Mar % 37% 33% 16% 8% Sep % 34% 36% 19% 7% May % 36% 35% 17% 8% Feb % 34% 35% 19% 8% Feb % 27% 32% 29% 7% Jan % 28% 36% 26% 6% Oct % 30% 37% 21% 6% Aug % 32% 34% 17% 10% Jun % 31% 34% 16% 13% Mar % 31% 29% 14% 19% 24
25 RateSenC. How would you rate the way that Bob Casey is handling his job as US Senator? Would you say he is doing an excellent job, a good job, only a fair job, or a poor job as US Senator? Excellent Job Good Job Only a Fair Don t Poor Job Job Know Oct % 31% 25% 23% 95% Sep % 29% 25% 20% 14% Aug % 32% 27% 19% 13% Jun % 32% 29% 14% 15% Mar % 30% 32% 11% 20% Sep % 29% 27% 15% 22% May % 28% 33% 17% 13% Feb % 27% 31% 14% 18% Oct % 25% 34% 17% 20% Aug % 23% 39% 15% 19% Oct % 31% 33% 18% 12% Sep % 31% 32% 15% 16% Aug % 32% 37% 11% 16% Jun % 33% 32% 8% 21% Feb % 26% 43% 12% 15% Jan % 31% 36% 11% 19% Oct % 33% 38% 9% 16% Aug % 27% 43% 9% 16% Mar % 26% 39% 9% 23% Feb % 31% 32% 10% 20% Aug % 37% 36% 7% 15% 25
26 RightDir All in all, do you think things in Pennsylvania are generally headed in the right direction, or do you feel that things are off on the wrong track? Headed in Right Direction Off on the Wrong Track Don t know Oct % 37% 11% Sep % 36% 14% Aug % 36% 18% Jun % 39% 16% Mar % 40% 15% Sep % 48% 16% May % 50% 19% Feb % 52% 13% Mar % 66% 10% Feb % 67% 12% Jan % 67% 12% Oct % 62% 12% Aug % 54% 13% Jun % 47% 17% Mar % 47% 15% Oct % 61% 11% Sep % 60% 11% Aug % 61% 13% Jun % 59% 11% Jan % 62% 13% Oct % 61% 13% Aug % 62% 12% May % 58% 13% Aug % 56% 13% Jun % 57% 13% Feb % 56% 13% Jan % 47% 15% Oct % 49% 13% Aug % 53% 13% Mar % 53% 10% Oct % 64% 9% Sep % 59% 10% Aug % 58% 12% May % 55% 10% Mar % 58% 10% 26
27 MIP_PA. What do you think is the most important problem facing Pennsylvania today? Oct Sep Aug Jun Mar Sep May Feb Mar Feb Jan Oct Aug Government, politicians 14% 14% 16% 13% 16% 30% 22% 24% 45% 47% 38% 39% 22% Taxes 14% 12% 10% 12% 15% 11% 12% 11% 7% 10% 9% 9% 12% Unemployment, personal finances 12% 9% 14% 5% 12% 9% 8% 12% 13% 9% 8% 12% 15% Education, school 9% 11% 13% 7% 9% 11% 17% 16% 13% 12% 18% 16% 21% Healthcare, insurance 8% 4% 3% 5% 2% 4% 8% 4% 2% 1% 2% 2% 1% Crime, drugs, violence, guns 7% 6% 6% 8% 10% 6% 5% 5% 1% 2% 3% 2% 3% Economy, finances 5% 6% 3% 9% 5% 7% 3% 3% 5% 4% 4% 4% 4% Roads, infrastructure, transportation 5% 4% 5% 7% 3% 2% 4% 4% 2% 1% 2% 2% 3% Environment 2% 3% 3% 2% 2% 1% 3% 2% 1% 1% 1% 1% 1% Energy issues, gas prices 2% 3% 2% 3% 0% 3% 1% 3% 2% 2% 2% 2% 5% Immigration 2% 2% 2% 3% 1% 1% 1% 1% 0% 1% 0% 0% 0% Retaining, attracting businesses 1% 2% 1% 0% 1% 0% 1% 2% 1% 1% 0% 1% 1% Bipartisanship 0% 2% 0% 2% 1% 2% 0% 0% 0% 0% 0% 0% 0% Align with political 0% 0% 0% 0% 0% 0% 0% 0% 0% 0% 0% 0% 2% views/platforms Senior issues, social security 0% 1% 1% 1% 0% 0% 1% 0% 0% 0% 1% 1% 1% Welfare 0% 1% 0% 1% 1% 1% 0% 1% 1% 0% 0% 1% 1% Housing and real estate 0% 1% 0% 0% 0% 0% 0% 0% 0% 0% 0% 0% 0% Transportation, availability 0% 1% 0% 0% 0% 0% 0% 0% 0% 0% 0% 0% 0% Racism 0% 0% 0% 1% 1% 1% 0% 1% 0% 0% 0% 0% 0% Justice system, Lawyers 0% 0% 0% 1% 1% 0% 0% 1% 0% 0% 0% 0% 0% Values, morals 0% 0% 0% 1% 0% 1% 0% 1% 1% 1% 1% 0% 2% Daycare 0% 0% 0% 1% 0% 0% 0% 0% 0% 0% 0% 0% 0% Population loss, movement out of state 0% 0% 0% 0% 1% 0% 0% 0% 0% 0% 0% 0% 0% Civil liberties 0% 0% 0% 0% 0% 1% 0% 1% 0% 0% 0% 0% 0% Population, urban sprawl 0% 0% 0% 0% 0% 1% 0% 0% 0% 0% 0% 0% 0% Social issues 0% 0% 2% 1% 6% 1% 2% 2% 1% 0% 1% 1% 1% Other 5% 4% 7% 3% 5% 2% 5% 4% 3% 4% 4% 3% 2% Don't know 10% 14% 12% 14% 13% 5% 7% 6% 3% 5% 8% 6% 6% 27
28 RatePres. How would you rate the way that Donald Trump is handling his job as president? Would you say he is doing an excellent job, a good job, only a fair job, or a poor job as President? Excellent Job Good Job Only a Fair Job Poor Job Don t Know Oct % 14% 12% 52% 0% Sep % 19% 8% 55% 0% Aug % 20% 10% 52% 1% Jun % 18% 13% 52% 0% Mar % 17% 16% 54% 1% Sep % 16% 18% 53% 1% May % 24% 14% 49% 2% Feb % 19% 13% 54% 1% RightDirUS. All in all, do you think things in the United States are generally headed in the right direction, or do you feel that things are off on the wrong track? Oct 2018 Sep 2018 Feb 2017 Oct 2016 Sep 2016 Aug 2016 Jul 2016 Right direction 35% 36% 29% 35% 36% 32% 38% Wrong track 61% 60% 66% 58% 57% 61% 57% Don t know 4% 4% 6% 7% 7% 7% 5% 28
29 MIP_US. What do you think is the most important problem facing the United States today? Oct 2018 Sep 2018 Feb 2017 Government, politicians 23% 14% 41% Immigration 21% 15% 10% Donald Trump 9% 16% 0% Healthcare, insurance 8% 2% 4% Economy, finances 4% 3% 5% Bipartisanship 3% 7% 0% Crime, drugs, violence, guns 3% 4% 1% Environment 3% 2% 2% Global events 2% 8% 4% Values and morality 2% 2% 0% Civil liberties 2% 1% 2% Social issues 1% 5% 1% Taxes 1% 0% 1% Foreign policy, terrorism, war 7% 4% 7% Racism 3% 3% 3% Unemployment, personal finances 3% 1% 6% Education, school 0% 1% 2% Lack of pride in U.S. 0% 1% 0% Welfare 0% 1% 1% Align with political views/platforms 0% 1% 0% Candidate who will put country back on right track 0% 1% 0% Other 5% 6% 8% Don't know 3% 5% 3% TAX1. Congress passed the Tax Cut and Job Act in December. Have you seen an increase in your household income because of this legislation? Oct 2018 Sep 2018 Aug 2018 Jun 2018 Yes 33% 30% 30% 33% No 61% 64% 65% 59% Do not know 6% 7% 6% 8% TAX2. Would you say it is a small, moderate, or large increase? Oct 2018 Sep 2018 Aug 2018 Jun 2018 n=176 n=159 n=152 n=153 Small increase 54% 58% 55% 63% Moderate increase 39% 35% 31% 35% Large increase 7% 6% 13% 2% Do not know 0% 1% 2% 0% 29
30 HC2. As far as you know, has the Trump administration made any significant changes to the Affordable Care Act? Oct 2018 Sep 2018 Aug 2018 Jun 2018 Yes 39% 37% 45% 41% No 39% 45% 35% 37% Do not know 21% 18% 21% 23% HC3. Do you think the changes to the regulations for the Affordable Care Act will make the healthcare system better or worse for your family? Oct 2018 Sep 2018 Aug 2018 Jun 2018 n=211 n=199 n=227 n=191 Much better 14% 17% 13% 8% Somewhat better 17% 17% 17% 18% Somewhat worse 24% 23% 20% 20% Much worse 27% 30% 34% 32% Do not know 19% 14% 16% 22% 30
31 The following questions are about some important topics in national politics. How does each of the following topics effect your interest in voting in the upcoming mid-term elections? Please tell me whether each topic makes you more or less interested in voting. The confirmation of Brett Kavanaugh to the United States Supreme Court Congressional effort to repeal the Affordable Care Act The separation of families that attempt to enter the U.S illegally A Great Deal More Somewhat More Somewhat Less Much Less No affect Don t Know 63% 17% 2% 2% 15% 1% 60% 25% 2% 1% 10% 1% 57% 18% 4% 2% 18% 1% The ban on immigrants from five majority-muslim countries The on-going special counsel investigation into the Russian government s efforts to interfere in the 2016 presidential election 51% 25% 4% 1% 18% 1% 47% 18% 5% 6% 23% 1% The December 2017 tax cut 41% 32% 4% 1% 19% 3% The tariffs imposed on steel and aluminum imports from the European Union, Canada, and Mexico 39% 32% 5% 1% 22% 2% The tariffs imposed on Chinese goods 38% 31% 6% 1% 21% 2% 31
32 I am going to read a list of problems and issues. For each one, please tell me how well President Trump s administration has performed, using an A for excellent, B for very good, C for average, D for below average or F for failing. Dealing with terrorism Helping to create new jobs Handling immigration Handling foreign policy Making government operate more efficiently Improving the healthcare system Dealing with climate change A B C D F Excellent Very Good Average Below Average Failing Don t know Oct % 16% 18% 14% 25% 2% Sep % 19% 18% 13% 23% 4% Aug % 18% 20% 15% 19% 4% Sep % 17% 21% 15% 24% 2% May % 21% 13% 14% 24% 3% Oct % 16% 22% 15% 15% 2% Sep % 17% 20% 16% 15% 3% Aug % 15% 18% 15% 19% 4% Sep % 21% 17% 17% 25% 4% May % 21% 16% 19% 21% 2% Oct % 15% 10% 13% 43% 1% Sep % 17% 7% 7% 49% 1% Aug % 14% 11% 9% 46% 1% Sep % 18% 11% 12% 46% 0% May % 16% 11% 11% 41% 1% Oct % 11% 12% 14% 39% 1% Sep % 15% 10% 10% 44% 2% Aug % 13% 10% 11% 44% 0% Sep % 17% 14% 18% 38% 1% May % 19% 14% 13% 36% 1% Oct % 17% 18% 14% 35% 4% Sep % 19% 15% 12% 40% 4% Aug % 14% 14% 12% 40% 4% Sep % 14% 17% 16% 37% 4% May % 20% 16% 14% 34% 4% Oct % 15% 19% 18% 38% 4% Sep % 13% 22% 14% 42% 4% Aug % 13% 19% 13% 41% 7% Sep % 12% 15% 15% 50% 1% May % 16% 15% 11% 45% 4% Oct % 9% 13% 10% 54% 7% Sep % 10% 15% 8% 51% 7% Aug % 8% 15% 9% 51% 7% Sep % 11% 13% 13% 47% 6% May % 10% 16% 7% 52% 7% A B C D F Don t 32
33 Improving the condition of the country s roads, bridges, and transit systems Improving public education Protecting the environment Excellent Very Good Average Below Average Failing know Oct % 18% 27% 15% 26% 7% Sep % 17% 24% 13% 27% 14% Aug % 14% 25% 13% 30% 11% Sep % 13% 27% 12% 26% 14% May % 14% 22% 14% 27% 16% Oct % 13% 21% 15% 38% 8% Sep % 15% 21% 13% 39% 9% Aug % 11% 20% 14% 38% 11% Sep % 14% 20% 15% 40% 8% May % 13% 20% 11% 41% 9% Oct % 12% 15% 12% 50% 3% Sep % 15% 16% 9% 48% 5% Aug % 12% 16% 11% 48% 6% Sep % 12% 19% 12% 47% 4% May % 12% 17% 9% 51% 5% PrimNews What is your primary source for news? Oct Sep Aug May Feb Oct Sep Aug Cable television, such as Fox, CNN, or MSNBC 31% 30% 28% 28% 31% 29% 30% 28% Internet (other than social media)* 21% 27% 25% 28% 28% 33% 32% 28% Network television, such as ABC, CBS, or NBC 18% 20% 20% 15% 18% 19% 20% 21% Radio 10% 6% 9% 8% 8% 7% 7% 6% Daily newspaper (such as the Inquirer or Post-Gazette ) 9% 8% 7% 12% 8% 7% 8% 11% Social media (Twitter, Facebook, SnapChat, Instagram) 7% 5% 5% 4% 3% Neighborhood newspaper 2% 1% 2% 3% 1% 2% 2% 2% Other 3% 4% 9% 2% 3% 4% 2% 3% Do not know 0% 0% 0% 1% 1% 0% 1% 1% *updated to exclude social media in February
34 CabNet Which cable network do you rely on the most? Oct 2018 Sep 2018 Aug-18 May-17 Feb-17 (cable television respondents) n=166 n=159 n=141 n=180 n=252 Fox News Channel 52% 53% 43% 50% 44% CNN 24% 22% 22% 22% 29% MSNBC 19% 16% 20% 18% 15% HLN 0% 2% 0% 1% 0% NBC 0% 1% 0% 3% -- CBS 0% 1% 0% 0% 0% PBS 0% 0% 3% 0% 0% Fox Business Network 0% 0% 0% 0% 1% One America News Network 0% 0% 0% 1% 0% None, nothing 0% 0% 1% 0% 1% Other 6% 5% 7% 5% 10% Do not know 0% 0% 3% 2% 2% FinToday. We are interested in how people are getting along financially these days. Would you say that you and your family are better off, worse off, or about the same financially as you were a year ago? Oct 2018 Sep 2018 Sep 2017 Feb 2017 Oct 2016 Sep 2016 Aug 2016 Better off 28% 31% 16% 21% 22% 23% 24% Worse off 11% 13% 13% 19% 24% 21% 24% About the same 61% 56% 69% 60% 53% 56% 52% Don t know 0% 1% 2% 1% 1% 1% 1% FinFut. Now looking ahead, do you think that a year from now, you and your family will be better off financially than you are now, worse off, or about the same as you are now? Oct 2018 Sep 2018 Feb 2017 Oct 2016 Sep 2016 Aug 2016 Better off 27% 31% 28% 25% 25% 25% Worse off 11% 10% 15% 7% 7% 8% About the same 56% 55% 49% 49% 52% 53% Don t know 6% 5% 8% 19% 16% 14% DEMO I now have a final few questions for statistical purposes only. CNTY. Region of state (What is the name of the county you live in?) 36% Central 18% Southeast 12% Philadelphia 12% Northeast 9% Allegheny 5% Northwest 8% Southwest 34
35 AGE. What was your age on your last birthday? 8% % % % % % 65 and older EDUC. What was the highest level of schooling you have completed? 1% Non high school graduate 22% High school graduate or GED 20% Some college 9% Associate s degree or technical degree 28% Bachelor s degree 20% Post graduate degree MAR. What is your CURRENT marital status are you single, married, separated, divorced, or a widower? 57% Married 29% Single, Never Married 7% Divorced 7% Widow or widower 1% Separated IDEO. Politically speaking, do you consider yourself to be a liberal, a moderate, or a conservative? Liberal Moderate Conservative Don t know Oct % 36% 35% 0% Sep % 36% 31% 5% Aug % 33% 37% 5% Jun % 40% 33% 0% Mar % 40% 33% 0% May % 41% 30% 2% Feb % 42% 31% 0% Oct % 29% 34% 4% Sep % 28% 38% 4% Aug % 32% 33% 4% Jul % 30% 33% 4% Mar % 35% 37% 3% Feb % 33% 37% 3% Jan % 39% 36% 4% Oct % 38% 37% 4% Aug % 36% 40% 3% Jun % 35% 39% 4% Oct % 37% 36% 3% 35
36 Sept % 36% 38% 5% Aug % 39% 36% 5% Jun % 36% 34% 5% Jan % 43% 28% 5% Oct % 39% 31% 6% Aug % 42% 33% 3% May % 39% 31% 6% Feb % 36% 35% 3% Oct % 39% 35% 5% Sep % 34% 35% 5% Aug % 40% 36% 4% Jun % 34% 36% 5% Feb % 39% 40% 4% Jan % 39% 36% 4% Oct % 39% 33% 8% Aug % 32% 37% 7% Mar % 33% 41% 10% Oct % 37% 39% 8% Sep % 34% 40% 10% Aug % 32% 40% 9% May % 32% 40% 9% Mar % 35% 40% 8% Feb % 33% 37% 9% Jan % 30% 42% 9% PARTY. Regardless of how you are registered in politics, as of today, do you think of yourself as a Republican, a Democrat, or an Independent? 24% Strong Republican 7% Republican 9% Lean Republican 7% Independent 13% Lean Democrat 9% Democrat 28% Strong Democrat 4% Don t know GUN. Are you a gun owner? 34% Yes 66% No 36
37 GUN2. Generally speaking, do you favor or oppose creating more laws that regulate gun ownership? Strongly Somewhat favor favor Somewhat oppose Strongly oppose Don t know Oct % 19% 9% 24% 2% Sep % 20% 8% 23% 3% Aug % 17% 12% 22% 2% Jun % 15% 9% 20% 2% Mar % 20% 7% 19% 3% Sep % 23% 11% 24% 4% Feb % 19% 14% 23% 2% Oct % 27% 12% 21% 4% Sep % 21% 10% 23% 3% Aug % 16% 16% 26% 3% Jul % 18% 10% 25% 4% Mar % 17% 10% 28% 3% Feb % 16% 13% 29% 3% Jan % 15% 13% 29% 3% Oct % 13% 10% 31% 4% Aug % 14% 10% 32% 5% Jun % 13% 12% 33% 5% Oct % 12% 8% 37% 2% Sep % 14% 10% 32% 5% Aug % 14% 10% 31% 6% Jun % 12% 9% 31% 5% Jan % 12% 9% 32% 6% Oct % 16% 9% 24% 5% Aug % 12% 13% 33% 4% May % 14% 11% 30% 3% Aug % 20% 14% 23% 3% Jun % 15% 12% 31% 3% Feb % 17% 15% 26% 3% LABR. Are you or is any member of your household a member of a LABOR UNION? 21% Yes 78% No 1% Do not know VET. Are you a military veteran? 10% Yes 90% No 37
38 Hisp. Are you Hispanic or Latino, or not? 2% Yes 98% No RACE. Which of the following categories best describes your racial background? 89% White 11% Non-white REL. Do you consider yourself to be Protestant, Catholic, some other religion, or not affiliated with any religion? 26% Protestant 30% Catholic 16% Some other religion 28% Not affiliated with any religion 1% Do not know BAC. Do you consider yourself to be a born-again Christian or fundamentalist, or not? 19% Yes 79% No 2% Don t know ABORT. Do you think that abortion should be legal under any circumstances, legal under certain circumstances, or illegal in all circumstances? Legal under any circumstances Legal under certain circumstances Illegal in all circumstances Don t know Oct % 53% 12% 1% Sep % 51% 12% 2% Aug % 54% 15% 1% Jun % 56% 19% 2% Sep % 56% 22% 2% Aug % 61% 19% 3% May % 58% 19% 2% Mar % 56% 23% 2% Feb % 57% 22% 2% Jan % 50% 24% 3% Oct % 54% 23% 3% Aug % 54% 23% 2% Jun % 58% 22% 2% Aug % 56% 21% 1% Jun % 58% 20% 1% Feb % 53% 26% 1% 38
39 NUMC. How many children under 18 years of age currently live in your household? 72% None 13% One 12% 2-3 2% 4-5 0% 6 or more WORK. Are you currently working fulltime, part-time, going to school, keeping house or something else? 53% Full-time 25% Retired 14% Part-time 2% Disabled 3% Something else 2% Going to school 1% Unemployed INCOME. And, just for statistical purposes, we need to know if your total family income is above or below $50,000 per year? 9% Under $25,000 7% $25-$35,000 11% $35-50,000 22% $50-75,000 21% $75-100,000 26% Over $100,000 4% Don t know DONE. Sex of respondent: 48% Male 52% Female 39
August Franklin & Marshall. College Poll SUMMARY OF FINDINGS. Prepared by: Center for Opinion Research. Floyd Institute for Public Policy
 For immediate release August 30, 2018 August 2018 Franklin & Marshall College Poll SUMMARY OF FINDINGS Prepared by: Center for Opinion Research Floyd Institute for Public Policy Franklin & Marshall College
June Franklin & Marshall. College Poll SUMMARY OF FINDINGS. Prepared by: Center for Opinion Research. Floyd Institute for Public Policy
 For immediate release June 14, 2018 June 2018 Franklin & Marshall College Poll SUMMARY OF FINDINGS Prepared by: Center for Opinion Research Floyd Institute for Public Policy Franklin & Marshall College
May 2017 Franklin n & Marshall College Poll SUMMARY OF FINDINGS
 For immediate release May 11, 2017 May 2017 Franklinn & Marshall College Poll SUMMAR RY OF FINDINGS Prepared by: Center for Opinionn Research Floyd Institute for Public Policy Franklin & Marshall College
March Franklin & Marshall. College Poll SUMMARY OF FINDINGS. Prepared by: Center for Opinion Research. Floyd Institute for Public Policy
 For immediate release March 28, 2019 March 2019 Franklin & Marshall College Poll SUMMARY OF FINDINGS Prepared by: Center for Opinion Research Floyd Institute for Public Policy Franklin & Marshall College
March Franklin & Marshall. College Poll SUMMARY OF FINDINGS. Prepared by: Center for Opinion Research. Floyd Institute for Public Policy
 For immediate release March 29, 2018 March 2018 Franklin & Marshall College Poll SUMMARY OF FINDINGS Prepared by: Center for Opinion Research Floyd Institute for Public Policy Franklin & Marshall College
October 31, 2013 SUMMAR BERWOOD A. YOST AFFAIRS AND PUBLIC KAY K. HUEBNER OPINION RESEARCH
 For immediatee release October 31, 2013 Franklinn & Marshall College Poll SURVEY OF PENNSYLVANIANS SUMMAR RY OF FINDINGS Prepared by: Center for Opinionn Research Floyd Institute for Public Policy Franklin
Franklin & Marshall College Poll
 For immediate release August 16, 2012 Franklin & Marshall College Poll SURVEY OF PENNSYLVANIANS SUMMARY OF FINDINGS Prepared by: Center for Opinion Research Floyd Institute for Public Policy Franklin &
August 27, 2015 SUMMAR BERWOOD A. YOST AFFAIRS AND PUBLIC KAY K. HUEBNER OPINION RESEARCH SCOTTIE THOMPSON
 For immediate release August 27, 2015 Franklinn & Marshall College Poll SURVEY OF PENNSYLVANIANS SUMMAR RY OF FINDINGS Prepared by: Center for Opinionn Research Floyd Institute for Public Policy Franklin
SUMMAR BERWOOD A. YOST AFFAIRS AND PUBLIC KAY K. HUEBNER OPINION RESEARCH
 For immediate release May 14, Franklinn & Marshall College Poll SURVEY OF PENNSYLVANIANS SUMMAR RY OF FINDINGS Prepared by: Center for Opinionn Research Floyd Institute for Public Policy Franklin & Marshall
Franklin & Marshall College Poll
 For immediate release February 7, 2013 Franklin & Marshall College Poll SURVEY OF PENNSYLVANIANS SUMMARY OF FINDINGS Prepared by: Center for Opinion Research Floyd Institute for Public Policy Franklin
October Franklin & Marshall College Poll SURVEY OF PENNSYLVANIANS SUMMARY OF FINDINGS
 For immediate release Wednesday, October 27, 2010 October 2010 Franklin & Marshall College Poll SURVEY OF PENNSYLVANIANS SUMMARY OF FINDINGS Prepared by: Center for Opinion Research Floyd Institute for
Franklin & Marshall College Poll
 For immediate release September 26, 2012 Franklin & Marshall College Poll SURVEY OF PENNSYLVANIANS SUMMARY OF FINDINGS Prepared by: Center for Opinion Research Floyd Institute for Public Policy Franklin
June 2007 Pennsylvania Keystone Poll
 For immediate release Thursday, June 7, 2007 June 2007 Pennsylvania Keystone Poll SUMMARY OF FINDINGS Prepared by: Center for Opinion Research Floyd Institute for Public Policy Franklin & Marshall College
March Franklin & Marshall College Poll SURVEY OF PENNSYLVANIANS SUMMARY OF FINDINGS
 For immediate release Thursday, March 20, 2008 March 2008 Franklin & Marshall College Poll SURVEY OF PENNSYLVANIANS SUMMARY OF FINDINGS Prepared by: Center for Opinion Research Floyd Institute for Public
SUMMAR BERWOOD A. YOST AFFAIRS AND PUBLIC KAY K. HUEBNER OPINION RESEARCH
 For immediate release July 2, 2014 Franklinn & Marshall College Poll SURVEY OF PENNSYLVANIANS SUMMAR RY OF FINDINGS Prepared by: Center for Opinionn Research Floyd Institute for Public Policy Franklin
August Franklin & Marshall College Poll SURVEY OF PENNSYLVANIANS SUMMARY OF FINDINGS
 For immediate release Thursday, August 26, August Franklin & Marshall College Poll SURVEY OF PENNSYLVANIANS SUMMARY OF FINDINGS Prepared by: Center for Opinion Research Floyd Institute for Public Policy
October 29, 2014 SUMMAR BERWOOD A. YOST AFFAIRS AND PUBLIC KAY K. HUEBNER OPINION RESEARCH
 For immediatee release October 29, 2014 Franklinn & Marshall College Poll SURVEY OF PENNSYLVANIANS SUMMAR RY OF FINDINGS Prepared by: Center for Opinionn Research Floyd Institute for Public Policy Franklin
Franklin & Marshall College Poll
 For immediate release September 1, 2011 Franklin & Marshall College Poll SURVEY OF PENNSYLVANIANS SUMMARY OF FINDINGS Prepared by: Center for Opinion Research Floyd Institute for Public Policy Franklin
October Franklin & Marshall College Poll NATIONAL SURVEY SUMMARY OF FINDINGS
 For immediate release Wednesday, October 22, 2008 October 2008 Franklin & Marshall College Poll NATIONAL SURVEY SUMMARY OF FINDINGS Prepared By: Center for Opinion Research Center for Politics & Public
February Franklin & Marshall College Poll PHILADELPHIA STATE OF THE CITY SUMMARY OF FINDINGS
 For immediate release Thursday, February 10, 2011 February 2011 Franklin & Marshall College Poll PHILADELPHIA STATE OF THE CITY SUMMARY OF FINDINGS Prepared by: Center for Opinion Research Floyd Institute
Marquette Law School Poll Toplines- September 13-16, 2012 (Reported total sample size may differ from 705 due to rounding of weighted data.
 Marquette Law School Poll Toplines- September 13-16, 2012 (Reported total sample size may differ from 705 due to rounding of weighted data.) S2 Gender Male 335 48 Female 370 52 S4 Region Milwaukee City
North Carolina Statewide Unaffiliated Survey 2016
 North Carolina Statewide Unaffiliated Survey 2016 Interview Schedule N = 400 North Carolina Unaffiliated Voters Margin of Error +/- 4.90% Field Dates: August 11-14, 2016 (ASK ALL) 1. First, are you registered
Right direction 33% 34% Wrong track 57% 56% Neither 3% 2% Don t know / Refused 7% 7%
 Heartland Monitor Poll XIII ALLSTATE/NATIONAL JOURNAL HEARTLAND MONITOR POLL XIII National Sample of 1000 ADULTS AGE 18+ (Margin of Error = +/-3.1% in 95 out of 100 cases) Conducted May 19-23, 2012 via
Morning Consult National Tracking Poll # April 05-07, Crosstabulation Results
 Morning Consult National Tracking Poll #180408 April 05-07, 2018 Crosstabulation Results Methodology: This poll was conducted from April 05-07, 2018, among a national sample of 1994 Registered Voters.
Western New England University Polling Institute May 29-31, 2012
 Western New England University Polling Institute May 29-31, 2012 TABLES Please tell me if you have a favorable or unfavorable opinion of the following people. If you haven't heard of them or don't have
National Tracking Poll # July 13-14, Crosstabulation Results
 National Tracking Poll #180724 July 13-14, 2018 Crosstabulation Results Methodology: This poll was conducted from July 13-14, 2018, among a national sample of 1991 registered voters. The interviews were
S2 Gender N % Male % Female %
 Marquette Law School Poll Toplines January 19-22, 2012 (Reported total sample size may differ from 701 due to rounding of weighted data.) S2 Gender Male 356 51% Female 345 49% S4 Region Milwaukee City
Interview dates: October 23-30, 2006 Interviews: 900 black respondents, 706 registered voters, 361 likely voters (202)
") 1101 Connecticut Avenue NW, Suite 200 Washington, DC 20036 Interview dates: October 23-30, 2006 Interviews: 900 black respondents, 706 registered voters, 361 likely voters (202) 463-7300 Margin of error:
1101 Connecticut Avenue NW, Suite 200 Washington, DC 20036 Interview dates: October 23-30, 2006 Interviews: 900 black respondents, 706 registered voters, 361 likely voters (202) 463-7300 Margin of error:
Marquette Law School Poll Toplines- June 13-16, 2012 (Reported total sample size may differ from 707 due to rounding of weighted data.
 Marquette Law School Poll Toplines- June 13-16, 2012 (Reported total sample size may differ from 707 due to rounding of weighted data.) S2 Gender Male 337 48 Female 370 52 S4 Region Milwaukee City 94 13
NALEO/Latino Decisions Tracking Poll 2018 CALIFORNIA CROSSTABS
 Q1. Many people are busy and don t get a chance to vote in every election. Thinking ahead to the November 2018 election, what would you say the chances are that you will vote in the election U.S. Congress
Morning Consult National Tracking Poll # March 08-12, Crosstabulation Results
 Morning Consult National Tracking Poll #180312 March 08-12, 2018 Crosstabulation Results Methodology: This poll was conducted from March 08-12, 2018, among a national sample of 1997 registered voters.
Marist College Institute for Public Opinion 2455 South Road, Poughkeepsie, NY Phone Fax
 Marist College Institute for Public Opinion 2455 South Road, Poughkeepsie, NY 12601 Phone 845.575.5050 Fax 845.575.5111 www.maristpoll.marist.edu POLL MUST BE SOURCED: McClatchy-Marist Poll* Clinton with
Center for Public Policy : Polls
 Center for Public Policy : Polls Where policy matters. A Survey of 804 Likely Voters - Virginia Statewide - July, 2014 Area: Southwest: 18.0 % DC Suburbs: 25.0 % Southeast: 4.0 % Tidewater-Hampton Roads:
Morning Consult National Tracking Poll # September 14-17, Crosstabulation Results
 Morning Consult National Tracking Poll #170911 September 14-17, 2017 Crosstabulation Results Methodology: This poll was conducted from September 14-17, 2017, among a national sample of 1994 registered
National Tracking Poll # March 01-03, Crosstabulation Results
 National Tracking Poll #190301 March 01-03, 2019 Crosstabulation Results Methodology: This poll was conducted between March 1-March 3, 2019 among a national sample of 1993 Registered Voters. The interviews
HOW THE POLL WAS CONDUCTED
 HOW THE POLL WAS CONDUCTED This poll was conducted for Telemundo by Mason-Dixon Polling & Strategy, Inc. of Jacksonville, Florida from October 25 through October 30, 2018. A total of 625 registered Hispanic
Morning Consult National Tracking Poll # January 18-20, Crosstabulation Results
 Morning Consult National Tracking Poll #180111 January 18-20, 2018 Crosstabulation Results Methodology: This poll was conducted from January 18-20, 2018, among a national sample of 1994 Registered Voters.
Marist College Institute for Public Opinion Poughkeepsie, NY Phone Fax
 Marist College Institute for Public Opinion Poughkeepsie, NY 12601 Phone 845.575.5050 Fax 845.575.5111 www.maristpoll.marist.edu POLL MUST BE SOURCED: NBC News/Marist Poll* Colorado: Udall Ahead of Gardner
For release after 10:00AM/ET Monday, November 6, VIRGINIA
 For release after 10:00AM/ET Monday, November 6, 2017. VIRGINIA The Fox News Poll is conducted under the joint direction of Anderson Robbins Research (D) and Shaw & Company Research (R). The poll was conducted
WBUR Poll Survey of 399 Republican Primary Voters in Massachusetts Field Dates: June 22-25, 2018
 Conducted for WBUR by WBUR Poll Survey of 399 Republican Primary Voters in Massachusetts Field Dates: June 22-25, 2018 I'm going to read you the names of several people and groups who are active in public
National Tracking Poll # February 15-19, Crosstabulation Results
 National Tracking Poll #190232 February 15-19, 2019 Crosstabulation Results Methodology: This poll was conducted from February 15-19, 2019, among a national sample of 1914 Registered Voters. The interviews
National Tracking Poll # March 01-03, Crosstabulation Results
 National Tracking Poll #190301 March 01-03, 2019 Crosstabulation Results Methodology: This poll was conducted from March 01-03, 2019, among a national sample of 1993 Registered Voters. The interviews were
Methodology. Results based on the full sample have a margin of sampling error of plus or minus three percentage points.
 Questions 1-21 and 46-47 are for release after 6:00PM/ET Tuesday, February 14, 2017. Questions 22-26 are for release after 6:00PM/ET Wednesday, February 15, 2017. Questions 42-45 are for release after
Morning Consult National Tracking Poll # January 11-16, Crosstabulation Results
 Morning Consult National Tracking Poll #180108 January 11-16, 2018 Crosstabulation Results Methodology: This poll was conducted from January 11-16, 2018, among a national sample of 1993 registered voters.
2010 Pennsylvania General Election T racking Poll
 M U H L E NB E R G C O L L E G E /M O RNIN G C A L L 2010 Pennsylvania General Election T racking Poll RELEASE #8 October 27, 2010 FIELDING PERIOD October 23-26, 2010 SAMPLE 457 Likely Voters in Pennsylvania
Results of SurveyUSA Election Poll # Page 1
 In North Carolina, Tillis-Hagan U.S. Senate Race Ends Where it Started, Exactly Even: One week till votes are counted in the high-profile, spare-no-expense contest for United States Senator from North
Morning Consult National Tracking Poll # May 12-14, Crosstabulation Results
 Morning Consult National Tracking Poll #170507 May 12-14, 2017 Crosstabulation Results Methodology: This poll was conducted from May 12-14, 2017, among a national sample of 2001 registered voters. The
THE AP-GfK POLL. Conducted by GfK Roper Public Affairs & Media
 GfK Custom Research North America THE AP-GfK POLL Conducted by GfK Roper Public Affairs & Media Interview dates: September 27-30, 2008 Interviews: 1,160 adults; 808 likely voters Margin of error: +/- 2.9
National Tracking Poll # December 04-04, Crosstabulation Results
 National Tracking Poll #181159 December 04-04, 2018 Crosstabulation Results Methodology: This poll was conducted from December 04-04, 2018, among a national sample of 1975 Registered Voters. The interviews
Time Warner Cable News/Siena College Poll September 4, 7-9, Likely Voters Congressional District 19 MOE +/- 4.0%
 Q1. Is the United States on the right track, or is it headed in the wrong direction? Right track 23% 40% 14% 17% 27% 19% 41% 13% 28% 20% 19% 22% 24% 21% 17% 34% 45% 25% 6% Wrong direction 64% 45% 77% 68%
Morning Consult National Tracking Poll # December 08-11, Crosstabulation Results
 Morning Consult National Tracking Poll #171203 December 08-11, 2017 Crosstabulation Results Methodology: This poll was conducted from December 08-11, 2017, among a national sample of 1955 registered voters.
Morning Consult National Tracking Poll # January 04-05, Crosstabulation Results
 Morning Consult National Tracking Poll #180102 January 04-05, 2018 Crosstabulation Results Methodology: This poll was conducted from January 04-05, 2018, among a national sample of 1988 registered voters.
Hello, my name is from HAI, a national research firm.
 Copyright 2014 April 24-30, 2014 400 Interviews New Hampshire HAI3235 Margin of Error: +/- 4.9% Hello, my name is from HAI, a national research firm. [IF LANDLINE] We're conducting a survey in New Hampshire
THE AP-GfK POLL May, 2014
 Public Affairs & Corporate Communications THE AP-GfK POLL May, 2014 Conducted by GfK Public Affairs & Corporate Communications A survey of the American general population (ages 18+) Interview dates: May
Vanderbilt University Poll December Survey Results
 Vanderbilt University Poll December 2012 Survey Results Vanderbilt University Poll December 2012 Toplines for REGISTERED VOTERS N = 829; Margin of Error +/- 4.3% SEX. Record Respondent s sex Male 48% Female
Marist College Institute for Public Opinion Poughkeepsie, NY Phone Fax
 Marist College Institute for Public Opinion Poughkeepsie, NY 12601 Phone 845.575.5050 Fax 845.575.5111 www.maristpoll.marist.edu POLL MUST BE SOURCED: NBC News/Marist Poll* Kentucky: McConnell Outpaces
Marist College Institute for Public Opinion Poughkeepsie, NY Phone Fax
 Marist College Institute for Public Opinion Poughkeepsie, NY 12601 Phone 845.575.5050 Fax 845.575.5111 www.maristpoll.marist.edu POLL MUST BE SOURCED: NBC News/Marist Poll* New Hampshire Election 2014
Western New England University Polling Institute May 29-31, 2012
 Western New England University Polling Institute May 29-31, TABLES Do you approve or disapprove of the way Barack Obama is handling his job as president? May 29-31, Obama Job Approval Approve Disapprove
NATIONAL: FEW SAY TRUMP HIRES BEST PEOPLE
 Please attribute this information to: Monmouth University Poll West Long Branch, NJ 07764 www.monmouth.edu/polling Follow on Twitter: @MonmouthPoll Released: Monday, August 20, Contact: PATRICK MURRAY
Marquette Law School Poll Toplines- July 5-8, 2012 (Reported total sample size may differ from 1,000 due to rounding of weighted data.
 Marquette Law School Poll Toplines- July 5-8, 2012 (Reported total sample size may differ from 1,000 due to rounding of weighted data.) S2 Gender Male 475 48 Female 525 53 S4 Region Milwaukee City 101
GRANITE STATE POLL THE UNIVERSITY OF NEW HAMPSHIRE
 GRANITE STATE POLL THE UNIVERSITY OF NEW HAMPSHIRE McCAIN LEADS CLINTON AND OBAMA IN NH By: Andrew E. Smith, Ph.D. 603/862-2226 FOR RELEASE andrew.smith@unh.edu May 3, 2008 www.unh.edu/survey-center DURHAM,
National Tracking Poll # July 06-10, Crosstabulation Results
 National Tracking Poll #180708 July 06-10, 2018 Crosstabulation Results Methodology: This poll was conducted from July 06-10, 2018, among a national sample of 1999 Registered Voters. The interviews were
National Tracking Poll # May 18-22, Crosstabulation Results
 National Tracking Poll #180538 May 18-22, 2018 Crosstabulation Results Methodology: This poll was conducted from May 18-22, 2018, among a national sample of 1993 Registered Voters. The interviews were
THE GEORGE WASHINGTON BATTLEGROUND POLL
 THE GEORGE WASHINGTON BATTLEGROUND POLL A national survey of 1,000 Registered Likely Voters Do you feel things in the country are going in the right direction, or do you feel things have gotten off on
Western New England University Polling Institute Massachusetts Statewide Survey, Oct. 23 Nov. 2, 2016 Tables
 Western New England University Polling Institute Massachusetts Statewide Survey, Tables Next, please tell me if you have a favorable or unfavorable opinion of the following people. If you haven't heard
Marist College Institute for Public Opinion Poughkeepsie, NY Phone Fax
 Marist College Institute for Public Opinion Poughkeepsie, NY 12601 Phone 845.575.5050 Fax 845.575.5111 www.maristpoll.marist.edu NY1/YNN-Marist Poll Obama Leads Romney by 26 Percentage Points in New York
THE WMUR GRANITE STATE POLL THE UNIVERSITY OF NEW HAMPSHIRE SURVEY CENTER
 THE WMUR GRANITE STATE POLL THE UNIVERSITY OF NEW HAMPSHIRE SURVEY CENTER October 10, 2014 OBAMA STAYS UNPOPULAR IN NH, HURTS DEMOCRATS ELECTION CHANCES By: Andrew E. Smith, Ph.D. Zachary S. Azem, M.A.
How the Survey was Conducted Nature of the Sample: NBC News/WSJ/Marist New Hampshire Poll of 2,059 Adults
 How the Survey was Conducted Nature of the Sample: NBC News/WSJ/Marist New Hampshire Poll of 2,059 Adults This survey of 2,059 adults was conducted January 2 nd through January 7 th, 2016 by The Marist
Marist College Institute for Public Opinion Poughkeepsie, NY Phone Fax
 Marist College Institute for Public Opinion Poughkeepsie, NY 12601 Phone 845.575.5050 Fax 845.575.5111 www.maristpoll.marist.edu POLL MUST BE SOURCED: MSNBC/Telemundo/Marist Poll* Clinton Leads Trump and
How the Survey was Conducted Nature of the Sample: NBC News/WSJ/Marist New Hampshire Poll of 1,108 Adults
 How the Survey was Conducted Nature of the Sample: NBC News/WSJ/Marist New Hampshire Poll of 1,108 Adults This survey of 1,108 adults was conducted September 6 th through September 8 th, 2016 by The Marist
National Tracking Poll # January 25-27, Crosstabulation Results
 National Tracking Poll #190156 January 25-27, 2019 Crosstabulation Results Methodology: This poll was conducted from January 25-27, 2019, among a national sample of 1997 Registered Voters. The interviews
How the Survey was Conducted Nature of the Sample: NBC 4 NY/WSJ/Marist Poll of 1,213 New York City Adults
 How the Survey was Conducted Nature of the Sample: NBC 4 NY/WSJ/Marist Poll of 1,213 New York City Adults This survey of 1,213 New York City adults was conducted July 8 th and July 9 th, 2013. Adults 18
THE WMUR GRANITE STATE POLL THE UNIVERSITY OF NEW HAMPSHIRE SURVEY CENTER
 THE WMUR GRANITE STATE POLL THE UNIVERSITY OF NEW HAMPSHIRE SURVEY CENTER August 16, 2012 NH DIVIDED ON INCOME TAX AMENDMENT, CONTINUE TO OPPOSE REPEAL OF GAY MARRIAGE By: Andrew E. Smith, Ph.D. Chad S.
National Tracking Poll # January 18-22, Crosstabulation Results
 National Tracking Poll #190140 January 18-22, 2019 Crosstabulation Results Methodology: This poll was conducted from January 18-22, 2019, among a national sample of 1996 Registered Voters. The interviews
Women Voters Ages 50+ and the 2016 Election. Annotated Questionnaire for Women Ages 50+ in Florida* TOTAL Unweighted N=
 Women Voters Ages 50+ and the 2016 Election Annotated Questionnaire for Women Ages 50+ in Florida* Please note that all results shown are percentages. TOTAL 50-69 70+ Unweighted N= 717 475 242 Northeast...
June 12-16, 2009 N= 895. All trends are from New York Times/CBS News polls unless otherwise noted. An asterisk indicates registered respondents only.
 z POLL June 12-16, 2009 N= 895 All trends are from New York Times/CBS News polls unless otherwise noted. An asterisk indicates registered respondents only. 6. Do you approve or disapprove of the way Barack
2016 AARP SURVEY: GUBERNATORIAL ISSUES FACING NORTH CAROLINA VOTERS AGES 45+
 2016 AARP SURVEY: GUBERNATORIAL ISSUES FACING NORTH CAROLINA VOTERS AGES 45+ This AARP survey of 1,000 registered voters ages 45 and older found nearly all plan on voting in November. Among the number
THE AP-GfK POLL March, 2014
 Public Affairs & Corporate Communications THE AP-GfK POLL March, 2014 Conducted by GfK Public Affairs & Corporate Communications A survey of the American general population (ages 18+) Interview dates:
Women Voters Ages 50+ and the 2016 Election: Thoughts on Social Security and the Presidential Candidates
 Women Voters Ages 50+ and the 2016 Election: Thoughts on Social Security and the Presidential Candidates Annotated Questionnaire for Full Sample of 1500 Women Ages 50+ Across 15 Battleground States* (AZ,
Georgia Newspaper Partnership Poll Sept 2010
 Georgia Newspaper Partnership Poll Sept 2010 RECOGNIZE RECOGNIZE RECOGNIZE DON'T FAVORABLE UNFAVORABLE NEUTRAL RECOGNIZE SENATE Johnny Isakson 44% 14% 35% 7% Mike Thurmond 22% 7% 34% 37% QUESTION: If the
Morning Consult National Tracking Poll # February 22-26, Crosstabulation Results
 Morning Consult National Tracking Poll #180217 February 22-26, 2018 Crosstabulation Results Methodology: This poll was conducted from February 22-26, 2018, among a national sample of 1992 registered voters.
THE WMUR GRANITE STATE POLL THE UNIVERSITY OF NEW HAMPSHIRE SURVEY CENTER
 THE WMUR GRANITE STATE POLL THE UNIVERSITY OF NEW HAMPSHIRE SURVEY CENTER October 8, 2014 SHAHEEN AND BROWN RACE REMAINS TIGHT By: Andrew E. Smith, Ph.D. Zachary S. Azem, M.A. UNH Survey Center 603/862-2226
Marist College Institute for Public Opinion Poughkeepsie, NY Phone Fax
 Marist College Institute for Public Opinion Poughkeepsie, NY 12601 Phone 845.575.5050 Fax 845.575.5111 www.maristpoll.marist.edu POLL MUST BE SOURCED: NBC News/Marist Poll* Tossup for U.S. Senate in Iowa,
The Associated Press-GfK Poll: Health Care Reform. Conducted by GfK September 25, 2012
 2100 Geng Road, Suite 210 Palo Alto, CA 94303 www.gfk.com Interview dates: August 31 September 7, 2010 Interviews: 1251 adults Sampling margin of error for a 50% statistic with 95% confidence is: ±3.9
The St. Norbert College Wisconsin Public Radio. Wisconsin Survey Fall 2011
 The St. Norbert College Wisconsin Public Radio Wisconsin Survey Fall 2011 Congressional and State Legislature Approval Biggest Problem Facing Wisconsin Courts Survey Information: Random Selection, Landline
Not One Penny National Online Survey
 Not One Penny National Online Survey February 9-16, 2018 2000 Respondents Q.2 Are you currently registered to vote in (STATE FROM SAMPLE)? Yes... 100 No... - (Don't know/refused)... - (ref:screen1) Q.3
20% 40% 60% 80% 100% AARP
 AARP Survey of Idaho Registered Voters ages 30 64: State Health Insurance Exchange Prepared by Jennifer H. Sauer State Research, AARP State health insurance exchanges are a provision of the new health
THE POLITICO-GW BATTLEGROUND POLL
 THE POLITICO-GW BATTLEGROUND POLL A national survey of 1,000 Registered Likely Voters Do you feel things in the country are going in the right direction, or do you feel things have gotten off on the wrong
AARP March 10-13, Q1. Can you please tell me your current age? Trump Total (n=605)
") AARP March 10-13, 2017 #4197 Power of 50+ 605 Registered 50+ Nationwide Who Voted In The 2016 Election SCREENERS Q1. Can you please tell me your current age? 49 years or younger 0 0 50 to 54 years 20 16
AARP March 10-13, 2017 #4197 Power of 50+ 605 Registered 50+ Nationwide Who Voted In The 2016 Election SCREENERS Q1. Can you please tell me your current age? 49 years or younger 0 0 50 to 54 years 20 16
PEW SOCIAL & DEMOGRAPHIC TRENDS JULY 2012 MIDDLE CLASS UPDATE SURVEY FINAL TOPLINE JULY 16-JULY 26, 2012 TOTAL N=2,508
 1 PEW SOCIAL & DEMOGRAPHIC TRENDS JULY 2012 MIDDLE CLASS UPDATE SURVEY FINAL TOPLINE JULY 16-JULY 26, 2012 TOTAL N=2,508 NOTE: ALL NUMBERS ARE PERCENTAGES. THE PERCENTAGES GREATER THAN ZERO BUT LESS THAN
Morning Consult National Tracking Poll # August 24-28, Crosstabulation Results
 Morning Consult National Tracking Poll #170814 August 24-28, 2017 Crosstabulation Results Methodology: This poll was conducted from August 24-28, 2017, among a national sample of 1999 registered voters.
PENSION POLL 2015 TOPLINE RESULTS
 PENSION POLL 2015 TOPLINE RESULTS RELEASED: FEBRUARY 6, 2015 The Reason-Rupe Pension Poll interviewed 1,003 adults on both mobile (501) and landline (502) phones, including 290 respondents without landlines,
North Carolina Statewide April 2017
 North Carolina Statewide April 2017 Interview Schedule N = 600 Registered Voters (30% Cell Phones) Margin of Error: +/- 4.00% Field Dates: April 20, 22-23, 2017 (ASK ALL) 1. First, are you registered to
Marist College Institute for Public Opinion Poughkeepsie, NY Phone Fax
 Marist College Institute for Public Opinion Poughkeepsie, NY 12601 Phone 845.575.5050 Fax 845.575.5111 www.maristpoll.marist.edu POLL MUST BE SOURCED: The Wall Street Journal/NBC 4 New York/Marist Poll*
May 5, To: Oregon Public Broadcasting From: DHM Research Re: Quarterly Omnibus Survey Topline Results
 239 NW 13 th Ave., #205 Portland, OR 97209 503.220.0575 www.dhmresearch.com Portland Seattle Washington DC May 5, 2014 To: Oregon Public Broadcasting From: DHM Research Re: Quarterly Omnibus Survey Topline
THE AP-GfK POLL December, 2013
 Public Affairs & Corporate Communications THE AP-GfK POLL December, 2013 Conducted by GfK Public Affairs & Corporate Communications A survey of the American general population (ages 18+) Interview dates:
La Plata County Ballot Measure Poll May 2015
 480 likely voters in La Plata County Field: May 18 21, 2015 La Plata County Ballot Measure Poll May 2015 Hello, may I please I speak with name on the list? My name is name of interviewer. I m calling from
Hello, my name is from HAI, a national research firm.
 Copyright 2014 April 24-30, 2014 502 Interviews Michigan HAI3237 Margin of Error: +/- 4.4% Hello, my name is from HAI, a national research firm. [IF LANDLINE] We're conducting a survey in Michigan to get
THE AP-GfK POLL October, 2013
 Public Affairs & Corporate Communications THE AP-GfK POLL October, 2013 Conducted by GfK Public Affairs & Corporate Communications A survey of the American general population (ages 18+) Interview dates:
HuffPost: Tuesday news August 21-22, US Adults
 1. Feel about the news Which better describes how you feel about news and current events? News and current events matter a lot in my daily life 50% 61% 53% 48% 44% 36% 54% 67% 55% 41% 32% 48% News and