March Franklin & Marshall. College Poll SUMMARY OF FINDINGS. Prepared by: Center for Opinion Research. Floyd Institute for Public Policy
|
|
|
- Augustus Morgan
- 6 years ago
- Views:
Transcription

1 For immediate release March 29, 2018 March 2018 Franklin & Marshall College Poll SUMMARY OF FINDINGS Prepared by: Center for Opinion Research Floyd Institute for Public Policy Franklin & Marshall College
2 Table of Contents TABLE OF CONTENTS... 2 KEY FINDINGS... 3 VOTER INTEREST... 4 PRESIDENT TRUMP: JOB PERFORMANCE... 4 SENATOR CASEY: JOB PERFORMANCE... 6 GOVERNOR WOLF: JOB PERFORMANCE... 6 STATE ISSUES... 9 METHODOLOGY ATTACHMENT A ATTACHMENT A ATTACHMENT A MARGINAL FREQUENCY REPORT
3 Key Findings The March 2018 Franklin & Marshall College Poll finds that nearly half (48%) of the state s registered voters are very interested in the 2018 mid-term elections; more Democrats (60%) than Republicans (41%) or independents (26%) say they are very interested. The current survey shows that more registered voters expect to vote for the Democratic party candidate for the US House in November (42%) than expect to vote for the Republican candidate (35%), but the Democratic candidates advantage is much larger, 53% to 30%, among those very interested in the election. At the moment, both Governor Tom Wolf and Senator Bob Casey hold comfortable leads against their Republican challengers, but a large portion of voters are undecided in those races. More than two in five (43%) registered voters in Pennsylvania believe Governor Wolf is doing an excellent or good job as governor, which is an increase from the September survey (38%). Two in five (37%) registered voters believe Senator Casey is doing an excellent or good job as the state s US Senator, which is consistent with his ratings in the September survey. About one in three (30%) registered voters in Pennsylvania believes President Trump is doing an excellent or good job as president, which is consistent with his ratings in the September survey. Nearly half (46%) of the state s registered voters believe the state is headed in the right direction, which is the first time since 2009 that more voters chose that option than said the state was on the wrong track. Three in five (60%) registered voters believe the state s congressional districts created after the 2010 census were unfairly drawn. Most registered voters in Pennsylvania strongly favor enhancing the gun background check system (86%), banning assault style weapons (61%), and raising the minimum age to purchase a gun to 21 (59%). 3
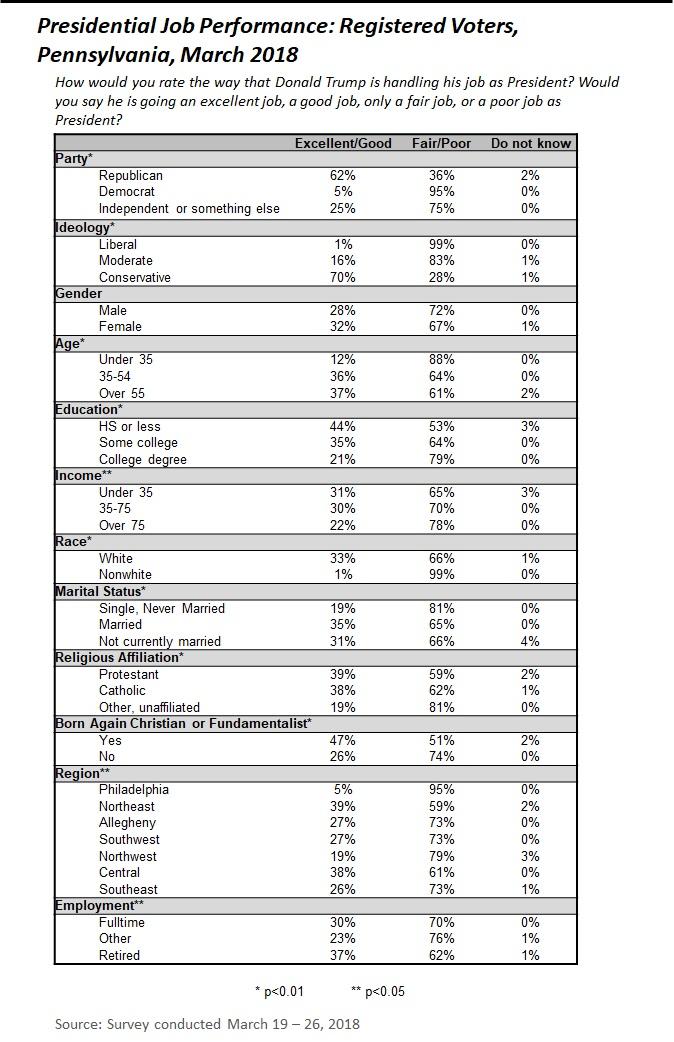
4 Voter Interest Nearly half (48%) of the state s registered voters say they are very interested in the 2018 elections. Voter interest is related to both political party and political ideology. At the moment, more Democrats (60%) than Republicans (41%) or independents (26%) say they are very interested. More self-described liberals (60%) than conservatives (47%) or moderates (40%) say they are very interested. The outcomes of the 2018 mid-terms will be driven by differences in voter interest if that translates into different turnout rates among partisans. The current survey shows that more registered voters expect to vote for the Democratic party candidate for the US House in November (42%) than expect to vote for the Republican candidate (35%), but the Democratic candidates advantage is much larger, 53% to 30%, among those very interested in the election. President Trump: Job Performance About one in three (30%) registered voters in Pennsylvania believes President Trump is doing an excellent or good job as president, which is consistent with his ratings in the September survey. Figure 1 compares President Trump s job ratings to President Obama s job ratings; President Trump s current rating is below President Obama s rating in Pennsylvania at a similar point in his Presidency. A majority of Republicans (62%) rate the President s performance positively, while fewer Democrats (5%) or Independents (25%) do so. Conservatives (70%) are more likely than moderates (16%) or liberals (1%) to give the President positive job approval ratings. 4
5 Figure 1: 5
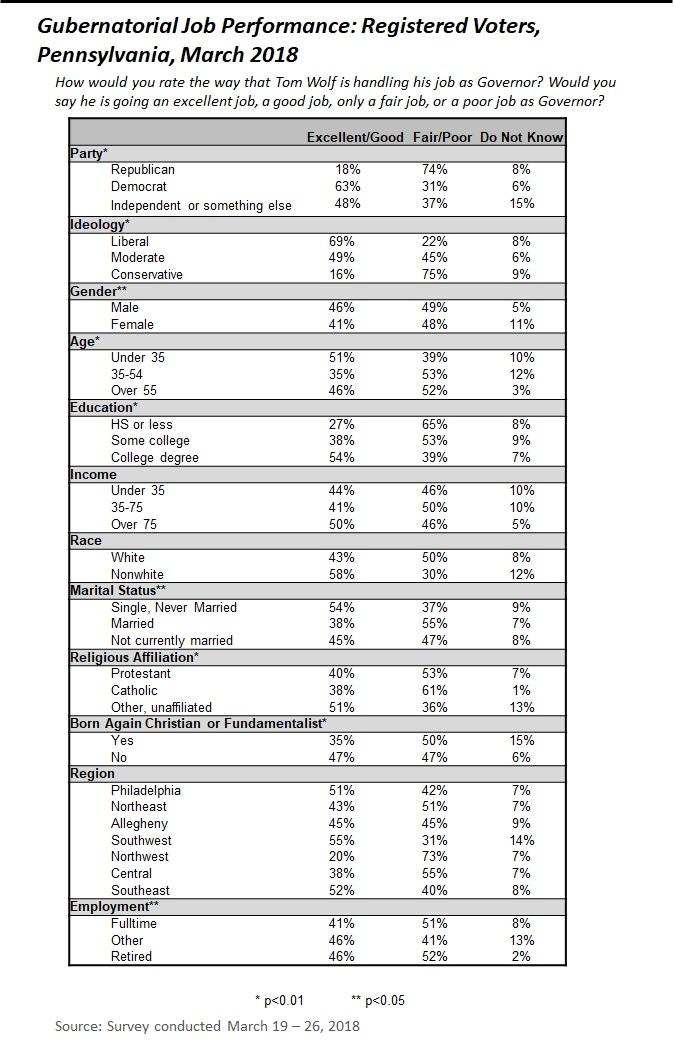
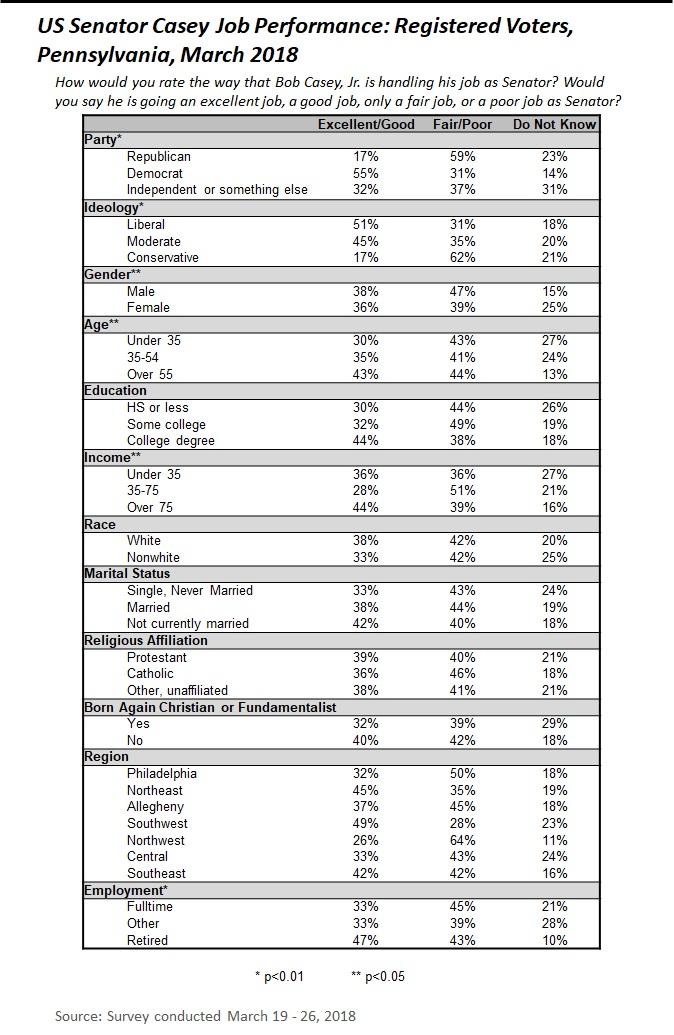
6 Senator Casey: Job Performance Two in five (37%) registered voters in Pennsylvania believe Senator Casey is doing an excellent or good job as the state s US Senator, which is consistent to his ratings in the September survey. Half (55%) of registered Democrats, one in three (32%) independents, and one in five (17%) Republicans provide positive ratings of the Senator s job performance. Interestingly, a sizable group of Independents (31%), Republicans (23%), and Democrats (14%) say they do not know how they would rate the Senator s performance. Senator Casey (43%) currently holds a comfortable lead over his Republican challenger, Representative Lou Barletta (25%), although nearly one in three (30%) voters remains undecided. Governor Wolf: Job Performance More than two in five (43%) registered voters in Pennsylvania believe Governor Wolf is doing an excellent or good job as governor, which is an increase from the September survey (38%). Two in three (63%) Democrats, nearly half (48%) of independents, and one in five (18%) Republicans provide positive ratings of the Governor s job performance. Governor Wolf s improved job performance ratings increased because more Democrats (50% in September) and independents (32% in September) rate his performance favorably. Figure 2 compares Governor Wolf s job performace ratings to his recent predecessors. Wolf s job performance rating is similar to Governor Rendell s and better than Governor Corbett s at similar points during their terms in office. 6
7 Figure 2: Governor Wolf currently leads all three of his Republican challengers, as Table 1 shows. 1 The Republican candidates performed similarly when matched against Governor Wolf, with each receiving about one in four votes. Still, there are many undecided voters in the race. 1 The Republican candidate in the gubernatorial race was randomly selected so that each respondent was asked only about a single candidate, either Ellsworth, Mango, or Wagner. Randomization checks show that the distribution of respondents into each subgroup were statistically equivalent, meaning there were no difference by party, ideology, race, age, income, or geography. The distribution by gender did differ, with the samples for Ellsworth and Wagner having more females than the sample for Mango. There was no significant difference in the relative performance of the Republican candidates. 7
8 Table 1: 8
9 State Issues Nearly half (46%) of the state s registered voters believe the state is headed in the right direction. As Figure 3 shows, it is the first time since 2009 that more voters chose that option than said the state was on the wrong track. More Democrats (52%) than independents (46%) or Republicans (38%) believe the state is headed in the right direction. Registered voters mention unemployment and the economy (17%), government and politicians (16%), taxes (15%), crime (10%), education (9%), and an assortment of other issues as being the most important problems facing the state. Figure 3: 9
10 Three in five (60%) registered voters believe the state s congressional districts created after the 2010 census were unfairly drawn and most (67%) have heard about the State Supreme Court s order that the map be re-drawn. Democrats (69%) are most likely to believe the 2010 map was unfairly drawn, but a majority of Republicans (52%) and independents (51%) also believe the map was drawn unfairly. Most registered voters in Pennsylvania strongly favor enhancing the gun background check system (86%), banning assault style weapons (61%), and raising the minimum age to purchase a gun to 21 (59%). There are sizable differences in support for these proposals by party and political ideology. Gun owners are less likely to support these proposals as well, although a majority of gun owners do favor all of the proposals: banning assault weapons (52%), enhanced background checks (86%), and raising the minimum age to purchase a weapon to 21 (58%). 10
11 Methodology The survey findings presented in this release are based on the results of interviews conducted March 19 26, The interviews were conducted at the Center for Opinion Research at Franklin & Marshall College on behalf of the Center for Politics and Public Affairs. The poll was designed and administered by the staff of the Center for Opinion Research. The data included in this release represent the responses of 423 Pennsylvania registered voters, including 201 Democrats, 163 Republicans, and 58 Independents. The sample of registered voters was obtained from L2, formerly Labels & Lists. All sampled respondents were notified by letter about the survey. Interviews were completed over the phone and online depending on each respondent s preference. Survey results were weighted (age, gender, education, ideology, and party registration) using an iterative weighting algorithm to reflect the known distribution of those characteristics as reported by the Pennsylvania Department of State and Pennsylvania exit polls. The sample error for this survey is +/- 6.8 percentage points when the design effects from weighting are considered. In addition to sampling error, this poll is also subject to other sources of non-sampling error. Generally speaking, two sources of error concern researchers most. Nonresponse bias is created when selected participants either choose not to participate in the survey or are unavailable for interviewing. Response errors are the product of the question and answer process. Surveys that rely on self-reported behaviors and attitudes are susceptible to biases related to the way respondents process and respond to survey questions. 11
12 Attachment A-1 12
13 Attachment A-2 13
14 Attachment A-3 14
15 Marginal Frequency Report Responses may not total 100% due to rounding. REG. Some people are registered to vote, and many others are not. Are you currently registered to vote at your present address? 100% Yes 0% No RegPARTY. Are you currently registered as a Republican, a Democrat, an Independent, or as something else? 39% Republican 48% Democrat 13% Independent 1% Something else Vot16. Did you vote in the last presidential election in 2016, or not? Yes No Mar % 8% Sep % 4% May % 3% 15
16 ChgVote16 As of today, do you feel comfortable with your choice for President or do you wish you could change how you voted? March 2018 Clinton Trump Other (Respondents who voted in last presidential election) n=187 n=149 n=50 Comfortable with your choice 98% 91% 73% Wish you could change 2% 4% 19% Do not know 0% 5% 9% September 2017 Clinton Trump Other (Respondents who voted in last presidential election) n=193 n=138 n=29 Comfortable with your choice 92% 93% 86% Wish you could change 4% 3% 10% Do not know 3% 4% 4% May 2017 Clinton Trump Other (Respondents who voted in last presidential election) n=313 n=247 n=49 Comfortable with your choice 96% 94% 76% Wish you could change 2% 3% 21% Do not know 2% 2% 3% Vote_Nov. Many people will vote in the election for governor and congress in November, however, many other people will not. What would you say are the chances you will vote in the November election? Are you certain to vote, will you probably vote, are the chances fifty-fifty you will vote, OR don't you think that you will vote in the November election? 71% Certain to vote 16% Probably vote 8% Chances fifty-fifty 5% Don t think will vote Pol_Int. Some people don't pay much attention to political campaigns. How about you? Would you say that you are very much interested, somewhat interested or not very interested in the 2018 elections? 48% Very much interested 43% Somewhat interested 8% Not very interested 1% Do not know 16
17 Please let me know your opinion of some people involved in politics today. Is your opinion of [FILL name] favorable, unfavorable, undecided, or haven t you heard enough about [FILL name] to have an opinion? (rotated) Strongly favorable Somewhat favorable Somewhat unfavorable Strongly unfavorable Undecided Don t know TOM WOLF Mar % 31% 16% 16% 6% 12% Sep % 20% 8% 34% 12% 10% Feb % 29% 15% 19% 13% 11% Feb % 25% 16% 27% 9% 9% Oct % 23% 13% 20% 16% 13% Aug % 21% 9% 17% 18% 13% Jun % 23% 10% 17% 19% 11% Mar % 18% 11% 16% 22% 11% Oct % 20% 7% 18% 18% 16% Sept % 21% 9% 13% 18% 21% Aug % 19% 7% 10% 22% 24% Jun % 20% 5% 7% 20% 32% BOB CASEY Mar % 26% 13% 12% 8% 25% Sep % 28% 10% 14% 11% 20% Feb % 25% 13% 12% 14% 21% Oct % 23% 10% 13% 16% 27% Aug % 22% 11% 13% 17% 26% May % 26% 9% 13% 17% 18% Feb % 27% 11% 13% 16% 21% Oct % 20% 12% 19% 14% 19% Sep % 23% 13% 16% 13% 22% Aug % 25% 12% 10% 16% 27% June % 24% 10% 8% 14% 29% Jan % 20% 9% 8% 18% 35% Mar % 19% 11% 8% 19% 37% May % 23% 9% 11% 16% 31% Mar % 24% 10% 11% 17% 29% Feb % 20% 9% 9% 15% 34% Jan % 23% 11% 9% 17% 31% Oct % 21% 9% 12% 15% 32% Aug % 24% 10% 8% 17% 24% Jun % 21% 12% 5% 17% 34% Feb % 19% 9% 8% 21% 32% LOU BARLETTA Mar % 7% 4% 9% 4% 69% Sep % 9% 3% 6% 8% 68% 17
18 Strongly Somewhat Somewhat Strongly Don t Undecided favorable favorable unfavorable unfavorable know DONALD TRUMP Mar % 15% 11% 49% 2% 2% Sep % 22% 9% 36% 6% 6% Feb % 14% 6% 51% 6% 1% Oct % 12% 6% 56% 3% 1% Sep % 12% 6% 54% 6% 1% Aug % 14% 7% 51% 5% 1% Jul % 13% 5% 57% 5% 0% Mar % 14% 9% 56% 7% 1% Feb % 15% 11% 51% 10% 1% Vote_Gov1. If the 2018 election for governor were being held today and the candidates included (rotated) [Laura Ellsworth, the Republican and Tom Wolf, the Democrat], would you vote for Laura Ellsworth, Tom Wolf some other candidate, or aren't you sure how you would vote? n=143 22% Laura Ellsworth, the Republican 51% Tom Wolf, the Democrat 2% Some other candidate 25% Do not know Vote_Gov2. If the 2018 election for governor were being held today and the candidates included (rotated) [Paul Mango, the Republican and Tom Wolf, the Democrat], would you vote for Paul Mango, Tom Wolf some other candidate, or aren't you sure how you would vote? n=143 22% Paul Mango, the Republican 49% Tom Wolf, the Democrat 4% Some other candidate 25% Do not know Vote_Gov3. If the 2018 election for governor were being held today and the candidates included (rotated) [Scott Wagner, the Republican and Tom Wolf, the Democrat], would you vote for Scott Wagner, Tom Wolf some other candidate, or aren't you sure how you would vote? n=137 21% Scott Wagner, the Republican 38% Tom Wolf, the Democrat 6% Some other candidate 35% Do not know 18
19 Sen2018 If the November 2018 general election for U.S. Senator was being held today and the candidates were (rotated) [Lou Barletta, the Republican and Bob Casey Jr., the Democrat], would you vote for: Lou Barletta, Bob Casey, Jr., some other candidate, or aren't you sure how you would vote? 25% Lou Barletta, the Republican 43% Bob Casey, Jr., the Democrat 2% Some other candidate 30% Do not know GenBalH If the 2018 elections for the United States House of Representatives were being held today, would you vote for (rotated) [the Republican Party s candidate or the Democratic Party s] for the House in your district? 35% Republican Party s candidate 42% Democratic Party s candidate 23% Do not know Rate_Gov. How would you rate the way that Tom Wolf is handling his job as Governor? Would you say he is doing an excellent job, a good job, only a fair job, or a poor job as Governor? Excellent job Good job Only a fair job Poor job Don t know Mar % 37% 33% 16% 8% Sep % 34% 36% 19% 7% May % 36% 35% 17% 8% Feb % 34% 35% 19% 8% Feb % 27% 32% 29% 7% Jan % 28% 36% 26% 6% Oct % 30% 37% 21% 6% Aug % 32% 34% 17% 10% Jun % 31% 34% 16% 13% Mar % 31% 29% 14% 19% 19
20 RateSenC. How would you rate the way that Bob Casey is handling his job as US Senator? Would you say he is doing an excellent job, a good job, only a fair job, or a poor job as US Senator? Excellent Job Good Job Only a Fair Don t Poor Job Job Know Mar % 30% 32% 11% 20% Sep % 29% 27% 15% 22% May % 28% 33% 17% 13% Feb % 27% 31% 14% 18% Oct % 25% 34% 17% 20% Aug % 23% 39% 15% 19% Oct % 31% 33% 18% 12% Sep % 31% 32% 15% 16% Aug % 32% 37% 11% 16% June % 33% 32% 8% 21% Feb % 26% 43% 12% 15% Jan % 31% 36% 11% 19% Oct % 33% 38% 9% 16% Aug % 27% 43% 9% 16% Mar % 26% 39% 9% 23% Feb % 31% 32% 10% 20% Aug % 37% 36% 7% 15% RatePres. How would you rate the way that Donald Trump is handling his job as president? Would you say he is doing an excellent job, a good job, only a fair job, or a poor job as President? Excellent Job Good Job Only a Fair Don t Poor Job Job Know Mar % 17% 16% 54% 1% Sep % 16% 18% 53% 1% May % 24% 14% 49% 2% Feb % 19% 13% 54% 1% 20
21 RightDir All in all, do you think things in Pennsylvania are generally headed in the right direction, or do you feel that things are off on the wrong track? Headed in Right Direction Off on the Wrong Track Don t know Mar % 40% 15% Sep % 48% 16% May % 50% 19% Feb % 52% 13% Mar % 66% 10% Feb % 67% 12% Jan % 67% 12% Oct % 62% 12% Aug % 54% 13% Jun % 47% 17% Mar % 47% 15% Oct % 61% 11% Sept % 60% 11% Aug % 61% 13% Jun % 59% 11% Jan % 62% 13% Oct % 61% 13% Aug % 62% 12% May % 58% 13% Aug % 56% 13% June % 57% 13% Feb % 56% 13% Jan % 47% 15% Oct % 49% 13% Aug % 53% 13% Mar % 53% 10% Oct % 64% 9% Sep % 59% 10% Aug % 58% 12% May % 55% 10% Mar % 58% 10% Feb % 50% 13% Jan % 53% 8% 21
22 MIP_PA. What do you think is the most important problem facing Pennsylvania today? Oct Mar Jun Aug Oct Jan Feb Mar Feb May Sep Mar % 16% 17% 22% 39% 38% 47% 45% 24% 22% 30% 16% Government, politicians 9% 17% 12% 12% 9% 9% 10% 7% 11% 12% 11% 15% Taxes 20% 15% 18% 15% 12% 8% 9% 13% 12% 8% 9% 12% Unemployment, personal finances 2% 3% 2% 3% 2% 3% 2% 1% 5% 5% 6% 10% Crime, drugs, violence, guns 25% 19% 18% 21% 16% 18% 12% 13% 16% 17% 11% 9% Education, school 1% 1% 1% 1% 1% 1% 0% 1% 2% 2% 1% 6% Social issues 5% 6% 7% 4% 4% 4% 4% 5% 3% 3% 7% 5% Economy, finances 2% 4% 5% 3% 2% 2% 1% 2% 4% 4% 2% 3% Roads, infrastructure, transportation 2% 4% 1% 1% 2% 2% 1% 2% 4% 8% 4% 2% Healthcare, insurance 1% 1% 1% 1% 1% 1% 1% 1% 2% 3% 1% 2% Environment 0% 0% 0% 0% 0% 0% 0% 0% 0% 0% 2% 1% Bipartisanship 1% 1% 1% 0% 0% 0% 1% 0% 1% 1% 1% 1% Immigration 1% 1% 0% 1% 1% 0% 0% 1% 1% 0% 1% 1% Welfare 0% 0% 0% 0% 0% 0% 0% 0% 1% 0% 1% 1% Racism 0% 0% 1% 1% 1% 0% 1% 1% 2% 1% 0% 1% Retaining, attracting businesses 0% 0% 0% 0% 0% 0% 0% 0% 1% 0% 0% 1% Justice system, Lawyers 0% 0% 0% 0% 0% 0% 0% 0% 0% 0% 0% 1% Population loss, movement out of state 5% 3% 6% 5% 2% 2% 2% 2% 3% 1% 3% 0% Energy issues, gas prices 1% 2% 1% 2% 0% 1% 1% 1% 1% 0% 1% 0% Values, morals 0% 1% 0% 0% 0% 0% 0% 0% 1% 0% 1% 0% Civil liberties 0% 0% 0% 0% 0% 0% 0% 0% 0% 0% 1% 0% Population, urban sprawl 1% 1% 6% 1% 1% 1% 0% 0% 0% 1% 0% 0% Senior issues, social security 2% 2% 3% 2% 3% 4% 4% 3% 4% 5% 2% 5% Other 8% 5% 0% 6% 6% 8% 5% 3% 6% 7% 5% 13% Don't know 22
23 ReDist1. Do you think the state s congressional districts, as drawn after the 2010 Census, were fairly created or do you think that the districts were created to give one party an advantage over another? 16% Fairly created 60% Were created to give one party an advantage over another 24% Do not know ReDist2. Pennsylvania s Supreme Court ordered that the state s congressional districts should be re-drawn for the upcoming election. Have you heard or read anything about their decision? 67% Yes 31% No 2% Do not know C1. Now I d like to ask you a few questions about the environment and energy in the state. Do you think the state of Pennsylvania should do more to address the problems associated with climate change, or not? 47% Yes, definitely 20% Yes, probably 14% No, probably not 16% No, not at all 3% Do not know C2. Do you think climate change is causing problems now, do you think the problems created by climate change will not happen until sometime in the future, or do you think climate change will never create any serious problems? 62% Causing problems now 17% Problems will not happen until sometime in the future 12% Will never create any serious problems 5% Doesn t believe that climate change is happening (accepted if volunteered) 4% Do not know C3. Have you personally experienced any problems that you think are related to climate change, or not? (Respondents who believe climate change is happening.) n=402 39% Yes 53% No 8% Do not know 23
24 C4. Do you think it is more important for Pennsylvania to pursue energy policies that prioritize the availability of renewable energy such as solar and wind, or do you think it is more important for Pennsylvania to pursue energy policies that prioritize fossil fuel extraction from coal and natural gas? 69% Prioritize availability of renewable energy 18% Prioritize fossil fuel extraction from coal and natural gas 7% Best value (cheapest) for consumers (accept if volunteered) 6% Do not know MS1. In general, would you say that you strongly support, somewhat support, somewhat oppose, or strongly oppose the extraction of natural gas from shale deposits in Pennsylvania? 17% Strongly support 33% Somewhat support 16% Somewhat oppose 26% Strongly oppose 9% Do not know MS2. In general, do you approve or disapprove of the way the state legislature has handled the issue of natural gas development in the state? 3% Strongly approve 16% Somewhat approve 26% Somewhat disapprove 25% Strongly disapprove 30% Do not know MS3. In general, do you approve or disapprove of the way the Wolf administration has handled the issue of natural gas development in the state? 4% Strongly approve 22% Somewhat approve 27% Somewhat disapprove 13% Strongly disapprove 34% Do not know 24
25 MS4. Is your opinion of the natural gas drilling industry favorable or unfavorable? Aug 2011 Jan 2014 Mar % 35% 13% Strongly favorable 35% 29% 34% Somewhat favorable 12% 12% 23% Somewhat unfavorable 11% 15% 20% Strongly unfavorable 11% 10% 9% Do not know MS5. Do you believe the potential economic benefits of natural gas drilling outweigh the possible environmental damage that drilling might cause or do you think the potential environmental risks of drilling outweigh the potential economic benefits? Aug 2011 Jan 2014 Mar % 40% 30% Economic benefits outweigh the possible environmental damage 35% 37% 55% Potential environmental risks outweigh the potential economic benefits 26% 22% 15% Do not know MS6. Do you think that natural gas drilling in Pennsylvania has improved or reduced the quality of life in those communities where drilling is taking place? Aug 2011 Jan 2014 Mar % 16% 7% Greatly improved the quality of life 20% 22% 22% Somewhat improved the quality of life 17% 13% 23% Somewhat reduced the quality of life 9% 13% 16% Greatly reduced the quality of life % Has not affected the quality of life (only if volunteered) 40% 37% 29% Do not know MS7. Some people who lease land to natural gas drilling companies say they have not been paid what they are owed by those companies. Do you believe the state of Pennsylvania needs to strengthen the law that regulates how companies pay landowners or should these agreements and disputes be left to the landowners and companies to work out in court? 67% State needs to strengthen the law 23% Disputes be left to the landowners and companies to work out 10% Do not know 25
26 MS8. Have you had any personal experience with the shale gas industry, or not? 13% Yes 86% No 1% Do not know n=56 (Respondent who have personal experience with shale gas industry) (rotated) Yes No Do not know Do you or a household member work in the industry? 5% 95% 0% Do you lease land to a shale gas company 10% 90% 0% Do you have a neighbor who leases land to a shale gas company? 25% 74% 2% MS8d. Has your experience with the shale gas industry been positive or negative? n=56 18% Mostly positive 24% Somewhat positive 10% Somewhat negative 27% Mostly negative 20% Do not know DEMO I now have a final few questions for statistical purposes only. CNTY. Region of state (What is the name of the county you live in?) 37% Central 18% Southeast 12% Northeast 12% Allegheny 9% Philadelphia 7% Southwest 5% Northwest AGE. What was your age on your last birthday? 9% % % % % % 65 and older 26
27 EDUC. What was the highest level of schooling you have completed? 1% Non high school graduate 17% High school graduate or GED 19% Some college 14% Associate s degree or technical degree 27% Bachelor s degree 21% Post graduate degree MAR. What is your CURRENT marital status are you single, married, separated, divorced, or a widower? 55% Married 26% Single, Never Married 8% Divorced 7% Widow or widower 4% Separated 27
28 IDEO. Politically speaking, do you consider yourself to be a liberal, a moderate, or a conservative? Liberal Moderate Conservative Don t know Mar % 40% 33% 0% May % 41% 30% 2% Feb % 42% 31% 0% Oct % 29% 34% 4% Sep % 28% 38% 4% Aug % 32% 33% 4% Jul % 30% 33% 4% Mar % 35% 37% 3% Feb % 33% 37% 3% Jan % 39% 36% 4% Oct % 38% 37% 4% Aug % 36% 40% 3% Jun % 35% 39% 4% Oct % 37% 36% 3% Sept % 36% 38% 5% Aug % 39% 36% 5% Jun % 36% 34% 5% Jan % 43% 28% 5% Oct % 39% 31% 6% Aug % 42% 33% 3% May % 39% 31% 6% Feb % 36% 35% 3% Oct % 39% 35% 5% Sep % 34% 35% 5% Aug % 40% 36% 4% June % 34% 36% 5% Feb % 39% 40% 4% Jan % 39% 36% 4% Oct % 39% 33% 8% Aug % 32% 37% 7% Mar % 33% 41% 10% Oct % 37% 39% 8% Sep % 34% 40% 10% Aug % 32% 40% 9% May % 32% 40% 9% Mar % 35% 40% 8% Feb % 33% 37% 9% Jan % 30% 42% 9% 28
29 PARTY. Regardless of how you are registered in politics, as of today, do you think of yourself as a Republican, a Democrat, or an Independent? 20% Strong Republican 10% Republican 13% Lean Republican 5% Independent 15% Lean Democrat 10% Democrat 25% Strong Democrat 2% Don t know 29
30 GUN. Are you a gun owner? 35% Yes 65% No GUN2. Generally speaking, do you favor or oppose creating more laws that regulate gun ownership? Strongly Somewhat favor favor Somewhat oppose Strongly oppose Don t know Mar % 20% 7% 19% 3% Sep % 23% 11% 24% 4% Feb % 19% 14% 23% 2% Oct % 27% 12% 21% 4% Sep % 21% 10% 23% 3% Aug % 16% 16% 26% 3% Jul % 18% 10% 25% 4% Mar % 17% 10% 28% 3% Feb % 16% 13% 29% 3% Jan % 15% 13% 29% 3% Oct % 13% 10% 31% 4% Aug % 14% 10% 32% 5% Jun % 13% 12% 33% 5% Oct % 12% 8% 37% 2% Sept % 14% 10% 32% 5% Aug % 14% 10% 31% 6% Jun % 12% 9% 31% 5% Jan % 12% 9% 32% 6% Oct % 16% 9% 24% 5% Aug % 12% 13% 33% 4% May % 14% 11% 30% 3% Feb 2013* 43% 15% 10% 28% 4% Aug % 20% 14% 23% 3% Jun % 15% 12% 31% 3% Feb % 17% 15% 26% 3% 30
31 GUN3_A. Would you favor or oppose new laws that banned the sale of assault-style weapons in the state? n=282 61% Strongly support 7% Somewhat support 9% Somewhat oppose 18% Strongly oppose 4% Do not know GUN4. Would you favor or oppose enhancements to the background check system required to purchase a firearm? 86% Strongly support 8% Somewhat support 1% Somewhat oppose 4% Strongly oppose 1% Do not know GUN5. Do you favor or oppose raising the minimum age to purchase a firearm to 21? 59% Strongly support 13% Somewhat support 10% Somewhat oppose 15% Strongly oppose 6% Do not know LABR. Are you or is any member of your household a member of a LABOR UNION? 22% Yes 75% No 2% Do not know VET. Are you a military veteran? 10% Yes 90% No 31
32 Hisp. Are you Hispanic or Latino, or not? 3% Yes 97% No RACE. Which of the following categories best describes your racial background? 90% White 10% Non-white REL. Do you consider yourself to be Protestant, Catholic, some other religion, or not affiliated with any religion? 31% Protestant 26% Catholic 18% Some other religion 25% Not affiliated with any religion BAC. Do you consider yourself to be a born-again Christian or fundamentalist, or not? 21% Yes 76% No 3% Don t know NUMC. How many children under 18 years of age currently live in your household? 73% None 12% One 14% 2-3 1% 4-5 WORK. Are you currently working fulltime, part-time, going to school, keeping house or something else? 47% Full-time 26% Retired 13% Part-time 5% Going to school 4% Disabled 3% Something else 2% Unemployed 32
33 INCOME. And, just for statistical purposes, we need to know if your total family income is above or below $50,000 per year? 14% Under $25,000 11% $25-$35,000 9% $35-50,000 26% $50-75,000 15% $75-100,000 24% Over $100,000 1% Don t know DONE. Sex of respondent: 48% Male 52% Female 33
June Franklin & Marshall. College Poll SUMMARY OF FINDINGS. Prepared by: Center for Opinion Research. Floyd Institute for Public Policy
 For immediate release June 14, 2018 June 2018 Franklin & Marshall College Poll SUMMARY OF FINDINGS Prepared by: Center for Opinion Research Floyd Institute for Public Policy Franklin & Marshall College
May 2017 Franklin n & Marshall College Poll SUMMARY OF FINDINGS
 For immediate release May 11, 2017 May 2017 Franklinn & Marshall College Poll SUMMAR RY OF FINDINGS Prepared by: Center for Opinionn Research Floyd Institute for Public Policy Franklin & Marshall College
March Franklin & Marshall. College Poll SUMMARY OF FINDINGS. Prepared by: Center for Opinion Research. Floyd Institute for Public Policy
 For immediate release March 28, 2019 March 2019 Franklin & Marshall College Poll SUMMARY OF FINDINGS Prepared by: Center for Opinion Research Floyd Institute for Public Policy Franklin & Marshall College
August Franklin & Marshall. College Poll SUMMARY OF FINDINGS. Prepared by: Center for Opinion Research. Floyd Institute for Public Policy
 For immediate release August 30, 2018 August 2018 Franklin & Marshall College Poll SUMMARY OF FINDINGS Prepared by: Center for Opinion Research Floyd Institute for Public Policy Franklin & Marshall College
October 31, 2013 SUMMAR BERWOOD A. YOST AFFAIRS AND PUBLIC KAY K. HUEBNER OPINION RESEARCH
 For immediatee release October 31, 2013 Franklinn & Marshall College Poll SURVEY OF PENNSYLVANIANS SUMMAR RY OF FINDINGS Prepared by: Center for Opinionn Research Floyd Institute for Public Policy Franklin
Franklin & Marshall College Poll
 For immediate release August 16, 2012 Franklin & Marshall College Poll SURVEY OF PENNSYLVANIANS SUMMARY OF FINDINGS Prepared by: Center for Opinion Research Floyd Institute for Public Policy Franklin &
August 27, 2015 SUMMAR BERWOOD A. YOST AFFAIRS AND PUBLIC KAY K. HUEBNER OPINION RESEARCH SCOTTIE THOMPSON
 For immediate release August 27, 2015 Franklinn & Marshall College Poll SURVEY OF PENNSYLVANIANS SUMMAR RY OF FINDINGS Prepared by: Center for Opinionn Research Floyd Institute for Public Policy Franklin
Franklin & Marshall College Poll
 For immediate release February 7, 2013 Franklin & Marshall College Poll SURVEY OF PENNSYLVANIANS SUMMARY OF FINDINGS Prepared by: Center for Opinion Research Floyd Institute for Public Policy Franklin
SUMMAR BERWOOD A. YOST AFFAIRS AND PUBLIC KAY K. HUEBNER OPINION RESEARCH
 For immediate release May 14, Franklinn & Marshall College Poll SURVEY OF PENNSYLVANIANS SUMMAR RY OF FINDINGS Prepared by: Center for Opinionn Research Floyd Institute for Public Policy Franklin & Marshall
SUMMAR BERWOOD A. YOST AFFAIRS AND PUBLIC KAY K. HUEBNER OPINION RESEARCH
 For immediate release July 2, 2014 Franklinn & Marshall College Poll SURVEY OF PENNSYLVANIANS SUMMAR RY OF FINDINGS Prepared by: Center for Opinionn Research Floyd Institute for Public Policy Franklin
October Franklin & Marshall College Poll SURVEY OF PENNSYLVANIANS SUMMARY OF FINDINGS
 For immediate release Wednesday, October 27, 2010 October 2010 Franklin & Marshall College Poll SURVEY OF PENNSYLVANIANS SUMMARY OF FINDINGS Prepared by: Center for Opinion Research Floyd Institute for
October Franklin & Marshall. College Poll SUMMARY OF FINDINGS. Prepared by: Center for Opinion Research. Floyd Institute for Public Policy
 For immediate release November 1, 2018 October 2018 Franklin & Marshall College Poll SUMMARY OF FINDINGS Prepared by: Center for Opinion Research Floyd Institute for Public Policy Franklin & Marshall College
June 2007 Pennsylvania Keystone Poll
 For immediate release Thursday, June 7, 2007 June 2007 Pennsylvania Keystone Poll SUMMARY OF FINDINGS Prepared by: Center for Opinion Research Floyd Institute for Public Policy Franklin & Marshall College
Franklin & Marshall College Poll
 For immediate release September 26, 2012 Franklin & Marshall College Poll SURVEY OF PENNSYLVANIANS SUMMARY OF FINDINGS Prepared by: Center for Opinion Research Floyd Institute for Public Policy Franklin
Franklin & Marshall College Poll
 For immediate release September 1, 2011 Franklin & Marshall College Poll SURVEY OF PENNSYLVANIANS SUMMARY OF FINDINGS Prepared by: Center for Opinion Research Floyd Institute for Public Policy Franklin
October 29, 2014 SUMMAR BERWOOD A. YOST AFFAIRS AND PUBLIC KAY K. HUEBNER OPINION RESEARCH
 For immediatee release October 29, 2014 Franklinn & Marshall College Poll SURVEY OF PENNSYLVANIANS SUMMAR RY OF FINDINGS Prepared by: Center for Opinionn Research Floyd Institute for Public Policy Franklin
March Franklin & Marshall College Poll SURVEY OF PENNSYLVANIANS SUMMARY OF FINDINGS
 For immediate release Thursday, March 20, 2008 March 2008 Franklin & Marshall College Poll SURVEY OF PENNSYLVANIANS SUMMARY OF FINDINGS Prepared by: Center for Opinion Research Floyd Institute for Public
August Franklin & Marshall College Poll SURVEY OF PENNSYLVANIANS SUMMARY OF FINDINGS
 For immediate release Thursday, August 26, August Franklin & Marshall College Poll SURVEY OF PENNSYLVANIANS SUMMARY OF FINDINGS Prepared by: Center for Opinion Research Floyd Institute for Public Policy
February Franklin & Marshall College Poll PHILADELPHIA STATE OF THE CITY SUMMARY OF FINDINGS
 For immediate release Thursday, February 10, 2011 February 2011 Franklin & Marshall College Poll PHILADELPHIA STATE OF THE CITY SUMMARY OF FINDINGS Prepared by: Center for Opinion Research Floyd Institute
October Franklin & Marshall College Poll NATIONAL SURVEY SUMMARY OF FINDINGS
 For immediate release Wednesday, October 22, 2008 October 2008 Franklin & Marshall College Poll NATIONAL SURVEY SUMMARY OF FINDINGS Prepared By: Center for Opinion Research Center for Politics & Public
Western New England University Polling Institute May 29-31, 2012
 Western New England University Polling Institute May 29-31, TABLES Do you approve or disapprove of the way Barack Obama is handling his job as president? May 29-31, Obama Job Approval Approve Disapprove
Western New England University Polling Institute May 29-31, 2012
 Western New England University Polling Institute May 29-31, 2012 TABLES Please tell me if you have a favorable or unfavorable opinion of the following people. If you haven't heard of them or don't have
Interview dates: October 23-30, 2006 Interviews: 900 black respondents, 706 registered voters, 361 likely voters (202)
") 1101 Connecticut Avenue NW, Suite 200 Washington, DC 20036 Interview dates: October 23-30, 2006 Interviews: 900 black respondents, 706 registered voters, 361 likely voters (202) 463-7300 Margin of error:
1101 Connecticut Avenue NW, Suite 200 Washington, DC 20036 Interview dates: October 23-30, 2006 Interviews: 900 black respondents, 706 registered voters, 361 likely voters (202) 463-7300 Margin of error:
How the Survey was Conducted Nature of the Sample: McClatchy-Marist National Poll of 1,197 Adults
 How the Survey was Conducted Nature of the Sample: McClatchy-Marist National Poll of 1,197 Adults This survey of 1,197 adults was conducted February 4 th through February 9 th, 2014 by The Marist Poll
2010 Pennsylvania General Election T racking Poll
 M U H L E NB E R G C O L L E G E /M O RNIN G C A L L 2010 Pennsylvania General Election T racking Poll RELEASE #8 October 27, 2010 FIELDING PERIOD October 23-26, 2010 SAMPLE 457 Likely Voters in Pennsylvania
S2 Gender N % Male % Female %
 Marquette Law School Poll Toplines January 19-22, 2012 (Reported total sample size may differ from 701 due to rounding of weighted data.) S2 Gender Male 356 51% Female 345 49% S4 Region Milwaukee City
Center for Public Policy : Polls
 Center for Public Policy : Polls Where policy matters. A Survey of 804 Likely Voters - Virginia Statewide - July, 2014 Area: Southwest: 18.0 % DC Suburbs: 25.0 % Southeast: 4.0 % Tidewater-Hampton Roads:
Marquette Law School Poll Toplines- June 13-16, 2012 (Reported total sample size may differ from 707 due to rounding of weighted data.
 Marquette Law School Poll Toplines- June 13-16, 2012 (Reported total sample size may differ from 707 due to rounding of weighted data.) S2 Gender Male 337 48 Female 370 52 S4 Region Milwaukee City 94 13
North Carolina Statewide Unaffiliated Survey 2016
 North Carolina Statewide Unaffiliated Survey 2016 Interview Schedule N = 400 North Carolina Unaffiliated Voters Margin of Error +/- 4.90% Field Dates: August 11-14, 2016 (ASK ALL) 1. First, are you registered
Vanderbilt University Poll December Survey Results
 Vanderbilt University Poll December 2012 Survey Results Vanderbilt University Poll December 2012 Toplines for REGISTERED VOTERS N = 829; Margin of Error +/- 4.3% SEX. Record Respondent s sex Male 48% Female
Morning Consult National Tracking Poll # September 14-17, Crosstabulation Results
 Morning Consult National Tracking Poll #170911 September 14-17, 2017 Crosstabulation Results Methodology: This poll was conducted from September 14-17, 2017, among a national sample of 1994 registered
Hello, my name is from HAI, a national research firm.
 Copyright 2014 April 24-30, 2014 400 Interviews New Hampshire HAI3235 Margin of Error: +/- 4.9% Hello, my name is from HAI, a national research firm. [IF LANDLINE] We're conducting a survey in New Hampshire
Morning Consult National Tracking Poll # January 11-16, Crosstabulation Results
 Morning Consult National Tracking Poll #180108 January 11-16, 2018 Crosstabulation Results Methodology: This poll was conducted from January 11-16, 2018, among a national sample of 1993 registered voters.
How the Survey was Conducted Nature of the Sample: NBC News/WSJ/Marist New Hampshire Poll of 1,108 Adults
 How the Survey was Conducted Nature of the Sample: NBC News/WSJ/Marist New Hampshire Poll of 1,108 Adults This survey of 1,108 adults was conducted September 6 th through September 8 th, 2016 by The Marist
Marquette Law School Poll Toplines- September 13-16, 2012 (Reported total sample size may differ from 705 due to rounding of weighted data.
 Marquette Law School Poll Toplines- September 13-16, 2012 (Reported total sample size may differ from 705 due to rounding of weighted data.) S2 Gender Male 335 48 Female 370 52 S4 Region Milwaukee City
Morning Consult National Tracking Poll # January 18-20, Crosstabulation Results
 Morning Consult National Tracking Poll #180111 January 18-20, 2018 Crosstabulation Results Methodology: This poll was conducted from January 18-20, 2018, among a national sample of 1994 Registered Voters.
The Mercyhurst Poll State of the Economy and the Impact of Gas Extraction from the Marcellus Shale Formation
 The Mercyhurst Poll State of the Economy and the Impact of Gas Extraction from the Marcellus Shale Formation A poll of 579 adult residents of Pennsylvania Prepared by: The Mercyhurst Center for Applied
Morning Consult National Tracking Poll # April 05-07, Crosstabulation Results
 Morning Consult National Tracking Poll #180408 April 05-07, 2018 Crosstabulation Results Methodology: This poll was conducted from April 05-07, 2018, among a national sample of 1994 Registered Voters.
National Tracking Poll # July 13-14, Crosstabulation Results
 National Tracking Poll #180724 July 13-14, 2018 Crosstabulation Results Methodology: This poll was conducted from July 13-14, 2018, among a national sample of 1991 registered voters. The interviews were
Marist College Institute for Public Opinion Poughkeepsie, NY Phone Fax
 Marist College Institute for Public Opinion Poughkeepsie, NY 12601 Phone 845.575.5050 Fax 845.575.5111 www.maristpoll.marist.edu POLL MUST BE SOURCED: NBC News/Marist Poll* Colorado: Udall Ahead of Gardner
National Tracking Poll # May 18-22, Crosstabulation Results
 National Tracking Poll #180538 May 18-22, 2018 Crosstabulation Results Methodology: This poll was conducted from May 18-22, 2018, among a national sample of 1993 Registered Voters. The interviews were
National Tracking Poll # February 15-19, Crosstabulation Results
 National Tracking Poll #190232 February 15-19, 2019 Crosstabulation Results Methodology: This poll was conducted from February 15-19, 2019, among a national sample of 1914 Registered Voters. The interviews
How the Survey was Conducted Nature of the Sample: NBC News/WSJ/Marist North Carolina Poll of 1,136 Adults
 How the Survey was Conducted Nature of the Sample: NBC News/WSJ/Marist North Carolina Poll of 1,136 Adults This survey of 1,136 adults was conducted October 25 th and October 26 th, 2016 by The Marist
How the Survey was Conducted Nature of the Sample: NBC News/WSJ/Marist North Carolina Poll of 1,150 Adults
 How the Survey was Conducted Nature of the Sample: NBC News/WSJ/Marist North Carolina Poll of 1,150 Adults This survey of 1,150 adults was conducted October 10 th through October 12 th, 2016 by The Marist
20% 40% 60% 80% 100% AARP
 AARP Survey of Idaho Registered Voters ages 30 64: State Health Insurance Exchange Prepared by Jennifer H. Sauer State Research, AARP State health insurance exchanges are a provision of the new health
National Tracking Poll # December 04-04, Crosstabulation Results
 National Tracking Poll #181159 December 04-04, 2018 Crosstabulation Results Methodology: This poll was conducted from December 04-04, 2018, among a national sample of 1975 Registered Voters. The interviews
Women Voters Ages 50+ and the 2016 Election. Annotated Questionnaire for Women Ages 50+ in Florida* TOTAL Unweighted N=
 Women Voters Ages 50+ and the 2016 Election Annotated Questionnaire for Women Ages 50+ in Florida* Please note that all results shown are percentages. TOTAL 50-69 70+ Unweighted N= 717 475 242 Northeast...
How the Survey was Conducted Nature of the Sample: NBC News/WSJ/Marist New Hampshire Poll of 2,059 Adults
 How the Survey was Conducted Nature of the Sample: NBC News/WSJ/Marist New Hampshire Poll of 2,059 Adults This survey of 2,059 adults was conducted January 2 nd through January 7 th, 2016 by The Marist
Morning Consult National Tracking Poll # March 08-12, Crosstabulation Results
 Morning Consult National Tracking Poll #180312 March 08-12, 2018 Crosstabulation Results Methodology: This poll was conducted from March 08-12, 2018, among a national sample of 1997 registered voters.
THE AP-GfK POLL May, 2014
 Public Affairs & Corporate Communications THE AP-GfK POLL May, 2014 Conducted by GfK Public Affairs & Corporate Communications A survey of the American general population (ages 18+) Interview dates: May
Women Voters Ages 50+ and the 2016 Election: Thoughts on Social Security and the Presidential Candidates
 Women Voters Ages 50+ and the 2016 Election: Thoughts on Social Security and the Presidential Candidates Annotated Questionnaire for Full Sample of 1500 Women Ages 50+ Across 15 Battleground States* (AZ,
Morning Consult National Tracking Poll # February 22-26, Crosstabulation Results
 Morning Consult National Tracking Poll #180217 February 22-26, 2018 Crosstabulation Results Methodology: This poll was conducted from February 22-26, 2018, among a national sample of 1992 registered voters.
Morning Consult National Tracking Poll # May 12-14, Crosstabulation Results
 Morning Consult National Tracking Poll #170507 May 12-14, 2017 Crosstabulation Results Methodology: This poll was conducted from May 12-14, 2017, among a national sample of 2001 registered voters. The
Western New England University Polling Institute Massachusetts Statewide Survey, Oct. 23 Nov. 2, 2016 Tables
 Western New England University Polling Institute Massachusetts Statewide Survey, Tables Next, please tell me if you have a favorable or unfavorable opinion of the following people. If you haven't heard
Marist College Institute for Public Opinion 2455 South Road, Poughkeepsie, NY Phone Fax
 Marist College Institute for Public Opinion 2455 South Road, Poughkeepsie, NY 12601 Phone 845.575.5050 Fax 845.575.5111 www.maristpoll.marist.edu POLL MUST BE SOURCED: McClatchy-Marist Poll* Clinton with
National Tracking Poll # March 01-03, Crosstabulation Results
 National Tracking Poll #190301 March 01-03, 2019 Crosstabulation Results Methodology: This poll was conducted between March 1-March 3, 2019 among a national sample of 1993 Registered Voters. The interviews
Production & Offshore Drilling July 2014
 Production & Offshore Drilling July 2014 Created for: American Petroleum Institute Presented by: Nielsen Interviewing: July 10 July 13, 2014 Respondents: 1012 Registered Voters Method: Telephone Sample:
THE WMUR GRANITE STATE POLL THE UNIVERSITY OF NEW HAMPSHIRE SURVEY CENTER
 THE WMUR GRANITE STATE POLL THE UNIVERSITY OF NEW HAMPSHIRE SURVEY CENTER October 8, 2014 SHAHEEN AND BROWN RACE REMAINS TIGHT By: Andrew E. Smith, Ph.D. Zachary S. Azem, M.A. UNH Survey Center 603/862-2226
May 5, To: Oregon Public Broadcasting From: DHM Research Re: Quarterly Omnibus Survey Topline Results
 239 NW 13 th Ave., #205 Portland, OR 97209 503.220.0575 www.dhmresearch.com Portland Seattle Washington DC May 5, 2014 To: Oregon Public Broadcasting From: DHM Research Re: Quarterly Omnibus Survey Topline
HOW THE POLL WAS CONDUCTED
 HOW THE POLL WAS CONDUCTED This poll was conducted for Telemundo by Mason-Dixon Polling & Strategy, Inc. of Jacksonville, Florida from October 25 through October 30, 2018. A total of 625 registered Hispanic
THE AP-GfK POLL October, 2013
 Public Affairs & Corporate Communications THE AP-GfK POLL October, 2013 Conducted by GfK Public Affairs & Corporate Communications A survey of the American general population (ages 18+) Interview dates:
The August 2018 AP-NORC Center Poll
 The August 2018 Center Poll Conducted by The Associated Press-NORC Center for Public Affairs Research With funding from The Associated Press and NORC at the University of Chicago Interviews: 1,055 adults
How the Survey was Conducted Nature of the Sample: NBC News/WSJ/Marist North Carolina Poll of 1,033 Adults
 How the Survey was Conducted Nature of the Sample: NBC News/WSJ/Marist North Carolina Poll of 1,033 Adults This survey of 1,033 adults was conducted July 5 th through July 11 th, 2016 by The Marist Poll
For release after 10:00AM/ET Monday, November 6, VIRGINIA
 For release after 10:00AM/ET Monday, November 6, 2017. VIRGINIA The Fox News Poll is conducted under the joint direction of Anderson Robbins Research (D) and Shaw & Company Research (R). The poll was conducted
National Tracking Poll # July 06-10, Crosstabulation Results
 National Tracking Poll #180708 July 06-10, 2018 Crosstabulation Results Methodology: This poll was conducted from July 06-10, 2018, among a national sample of 1999 Registered Voters. The interviews were
Hello, my name is from HAI, a national research firm.
 Copyright 2014 April 24-30, 2014 502 Interviews Michigan HAI3237 Margin of Error: +/- 4.4% Hello, my name is from HAI, a national research firm. [IF LANDLINE] We're conducting a survey in Michigan to get
Right direction 33% 34% Wrong track 57% 56% Neither 3% 2% Don t know / Refused 7% 7%
 Heartland Monitor Poll XIII ALLSTATE/NATIONAL JOURNAL HEARTLAND MONITOR POLL XIII National Sample of 1000 ADULTS AGE 18+ (Margin of Error = +/-3.1% in 95 out of 100 cases) Conducted May 19-23, 2012 via
Women Voters Ages 50+ and the 2016 Election
 Women Voters Ages 50+ and the 2016 Election Annotated Questionnaire for Latina Women Ages 50+ Across 15 Battleground States* (AZ, CO, FL, GA, IA, MI, MN, NC, NH, NM, NV, OH, PA, VA, and WI) Please note
National Tracking Poll # January 25-27, Crosstabulation Results
 National Tracking Poll #190156 January 25-27, 2019 Crosstabulation Results Methodology: This poll was conducted from January 25-27, 2019, among a national sample of 1997 Registered Voters. The interviews
Women Voters Ages 50+ and the 2016 Election
 Women Voters Ages 50+ and the 2016 Election Annotated Questionnaire for African American/Black Women Ages 50+ Across 15 Battleground States* (AZ, CO, FL, GA, IA, MI, MN, NC, NH, NM, NV, OH, PA, VA, and
THE AP-GfK POLL March, 2014
 Public Affairs & Corporate Communications THE AP-GfK POLL March, 2014 Conducted by GfK Public Affairs & Corporate Communications A survey of the American general population (ages 18+) Interview dates:
Morning Consult National Tracking Poll # August 24-28, Crosstabulation Results
 Morning Consult National Tracking Poll #170814 August 24-28, 2017 Crosstabulation Results Methodology: This poll was conducted from August 24-28, 2017, among a national sample of 1999 registered voters.
Marquette Law School Poll Toplines- July 5-8, 2012 (Reported total sample size may differ from 1,000 due to rounding of weighted data.
 Marquette Law School Poll Toplines- July 5-8, 2012 (Reported total sample size may differ from 1,000 due to rounding of weighted data.) S2 Gender Male 475 48 Female 525 53 S4 Region Milwaukee City 101
THE POLITICO-GW BATTLEGROUND POLL
 THE POLITICO-GW BATTLEGROUND POLL A national survey of 1,000 Registered Likely Voters Do you feel things in the country are going in the right direction, or do you feel things have gotten off on the wrong
NUMBERS, FACTS AND TRENDS SHAPING THE WORLD FOR RELEASE DECEMBER 19, 2013
 NUMBERS, FACTS AND TRENDS SHAPING THE WORLD FOR RELEASE DECEMBER 19, 2013 FOR FURTHER INFORMATION ON THIS REPORT: Michael Dimock, Director, Pew Research Center for the People & the Press Carroll Doherty,
How the Survey was Conducted Nature of the Sample: NBC 4 NY/WSJ/Marist Poll of 1,213 New York City Adults
 How the Survey was Conducted Nature of the Sample: NBC 4 NY/WSJ/Marist Poll of 1,213 New York City Adults This survey of 1,213 New York City adults was conducted July 8 th and July 9 th, 2013. Adults 18
Morning Consult National Tracking Poll # December 08-11, Crosstabulation Results
 Morning Consult National Tracking Poll #171203 December 08-11, 2017 Crosstabulation Results Methodology: This poll was conducted from December 08-11, 2017, among a national sample of 1955 registered voters.
How the Survey was Conducted Nature of the Sample: NBC News/WSJ/Marist Colorado Poll of 1,037 Adults
 How the Survey was Conducted Nature of the Sample: NBC News/WSJ/Marist Colorado Poll of 1,037 Adults This survey of 1,037 adults was conducted August 4 th through August 10 th, 2016 by The Marist Poll
National Tracking Poll # August 02-06, Crosstabulation Results
 National Tracking Poll #180805 August 02-06, 2018 Crosstabulation Results Methodology: This poll was conducted from August 02-06, 2018, among a national sample of 1994 Registered Voters. The interviews
THE AP-GfK POLL December, 2013
 Public Affairs & Corporate Communications THE AP-GfK POLL December, 2013 Conducted by GfK Public Affairs & Corporate Communications A survey of the American general population (ages 18+) Interview dates:
National Tracking Poll # March 01-03, Crosstabulation Results
 National Tracking Poll #190301 March 01-03, 2019 Crosstabulation Results Methodology: This poll was conducted from March 01-03, 2019, among a national sample of 1993 Registered Voters. The interviews were
GRANITE STATE POLL THE UNIVERSITY OF NEW HAMPSHIRE
 GRANITE STATE POLL THE UNIVERSITY OF NEW HAMPSHIRE McCAIN LEADS CLINTON AND OBAMA IN NH By: Andrew E. Smith, Ph.D. 603/862-2226 FOR RELEASE andrew.smith@unh.edu May 3, 2008 www.unh.edu/survey-center DURHAM,
THE AP-GfK POLL December, 2013
 Public Affairs & Corporate Communications THE AP-GfK POLL December, 2013 Conducted by GfK Public Affairs & Corporate Communications A survey of the American general population (ages 18+) Interview dates:
Morning Consult National Tracking Poll # January 04-05, Crosstabulation Results
 Morning Consult National Tracking Poll #180102 January 04-05, 2018 Crosstabulation Results Methodology: This poll was conducted from January 04-05, 2018, among a national sample of 1988 registered voters.
National Tracking Poll
 National Tracking Poll Project: 180115 N Size: 20429 Registered Voters Margin of Error: ± 1% Topline Report January 16-29, 2018 P1 Question Response Frequency Percentage Now, generally speaking, would
Georgia Newspaper Partnership Poll Sept 2010
 Georgia Newspaper Partnership Poll Sept 2010 RECOGNIZE RECOGNIZE RECOGNIZE DON'T FAVORABLE UNFAVORABLE NEUTRAL RECOGNIZE SENATE Johnny Isakson 44% 14% 35% 7% Mike Thurmond 22% 7% 34% 37% QUESTION: If the
National Tracking Poll # January 18-22, Crosstabulation Results
 National Tracking Poll #190140 January 18-22, 2019 Crosstabulation Results Methodology: This poll was conducted from January 18-22, 2019, among a national sample of 1996 Registered Voters. The interviews
What America Is Thinking About Energy Issues February 2016 Presented by: Harris Poll
 What America Is Thinking About Energy Issues February 2016 Virginia Presented by: Harris Poll Interviewing: January 22 February 1, 2016 Respondents: 630 Registered Voters Method: Telephone Weighting: Results
What America Is Thinking On Energy Issues February 2016
 What America Is Thinking On Energy Issues February 2016 South Carolina Presented by: Harris Poll Interviewing: January 22-31, 2016 Respondents: 600 Registered Voters Method: Telephone Weighting: Results
North Carolina Survey Results
 North Carolina Survey Results Q1 Q2 Q3 Q4 Would you strongly support, somewhat support, somewhat oppose or strongly oppose efforts to reform North Carolina s bail system? 33%... 41%......... 8% 4%... 14%
2016 AARP SURVEY: GUBERNATORIAL ISSUES FACING NORTH CAROLINA VOTERS AGES 45+
 2016 AARP SURVEY: GUBERNATORIAL ISSUES FACING NORTH CAROLINA VOTERS AGES 45+ This AARP survey of 1,000 registered voters ages 45 and older found nearly all plan on voting in November. Among the number
How the Survey was Conducted Nature of the Sample: MSNBC/Telemundo/Marist Poll of 1,446 National Adults
 How the Survey was Conducted Nature of the Sample: MSNBC/Telemundo/Marist Poll of 1,446 This survey of 1,446 adults was conducted March 23 rd through April 5 th, 2015 by The Marist Poll sponsored and funded
June 12-16, 2009 N= 895. All trends are from New York Times/CBS News polls unless otherwise noted. An asterisk indicates registered respondents only.
 z POLL June 12-16, 2009 N= 895 All trends are from New York Times/CBS News polls unless otherwise noted. An asterisk indicates registered respondents only. 6. Do you approve or disapprove of the way Barack
THE WMUR GRANITE STATE POLL THE UNIVERSITY OF NEW HAMPSHIRE SURVEY CENTER
 THE WMUR GRANITE STATE POLL THE UNIVERSITY OF NEW HAMPSHIRE SURVEY CENTER October 10, 2014 OBAMA STAYS UNPOPULAR IN NH, HURTS DEMOCRATS ELECTION CHANCES By: Andrew E. Smith, Ph.D. Zachary S. Azem, M.A.
Marist College Institute for Public Opinion Poughkeepsie, NY Phone Fax
 Marist College Institute for Public Opinion Poughkeepsie, NY 12601 Phone 845.575.5050 Fax 845.575.5111 www.maristpoll.marist.edu POLL MUST BE SOURCED: NBC News/Marist Poll* New Hampshire Election 2014
What America Is Thinking On Energy Issues January 2015
 What America Is Thinking On Energy Issues January 2015 South Carolina Offshore Drilling Presented by: Harris Poll Interviewing: January 13-15, 2015 Respondents: 604 Registered Voters Method: Telephone
PENSION POLL 2015 TOPLINE RESULTS
 PENSION POLL 2015 TOPLINE RESULTS RELEASED: FEBRUARY 6, 2015 The Reason-Rupe Pension Poll interviewed 1,003 adults on both mobile (501) and landline (502) phones, including 290 respondents without landlines,
WESTERN NEW ENGLAND UNIVERSITY POLLING INSTITUTE 2018 Massachusetts Statewide Survey October 10-27, 2018
 WESTERN NEW ENGLAND UNIVERSITY POLLING INSTITUTE 2018 Massachusetts Statewide Survey October 10-27, 2018 TABLES First, we'd like to ask you a few questions about public officials. Do you approve or disapprove
NATIONAL: FEW SAY TRUMP HIRES BEST PEOPLE
 Please attribute this information to: Monmouth University Poll West Long Branch, NJ 07764 www.monmouth.edu/polling Follow on Twitter: @MonmouthPoll Released: Monday, August 20, Contact: PATRICK MURRAY