June Franklin & Marshall. College Poll SUMMARY OF FINDINGS. Prepared by: Center for Opinion Research. Floyd Institute for Public Policy
|
|
|
- Maude York
- 5 years ago
- Views:
Transcription

1 For immediate release June 14, 2018 June 2018 Franklin & Marshall College Poll SUMMARY OF FINDINGS Prepared by: Center for Opinion Research Floyd Institute for Public Policy Franklin & Marshall College
2 Table of Contents TABLE OF CONTENTS... 2 KEY FINDINGS... 3 VOTER INTEREST AND TURNOUT... 4 PRESIDENT TRUMP: JOB PERFORMANCE... 4 SENATOR CASEY: JOB PERFORMANCE... 6 GOVERNOR WOLF: JOB PERFORMANCE... 8 STATE ISSUES METHODOLOGY METHODOLOGICAL NOTES ATTACHMENT A ATTACHMENT A ATTACHMENT A MARGINAL FREQUENCY REPORT
3 Key Findings The June 2018 Franklin & Marshall College Poll finds that more than half (55%) of the state s registered voters are very interested in the 2018 mid-term elections; more Democrats (62%) than Republicans (50%) or independents (41%) say they are very interested. At the moment, both Governor Tom Wolf and Senator Bob Casey hold comfortable leads against their Republican challengers, but a large portion of voters, notably Republicans and independents, are undecided in those races and neither Republican candidate is well known yet among voters. More than two in five (45%) registered voters in Pennsylvania believe Governor Wolf is doing an excellent or good job as governor, which is similar to our March survey. Two in five (42%) registered voters believe Senator Casey is doing an excellent or good job as the state s US Senator, which is a bit higher than his ratings in the March survey. About one in three (35%) registered voters in Pennsylvania believes President Trump is doing an excellent or good job as president, which is higher than his ratings in the March survey. Three in four (72%) of the state s registered voters believe state government needs reformed, with large majorities favoring reforms to campaign finance laws, the structure and operation of the state legislature, redistricting, and state and local government financing. More than seven in ten (71%) favor holding a constitutional convention to review these matters. 3
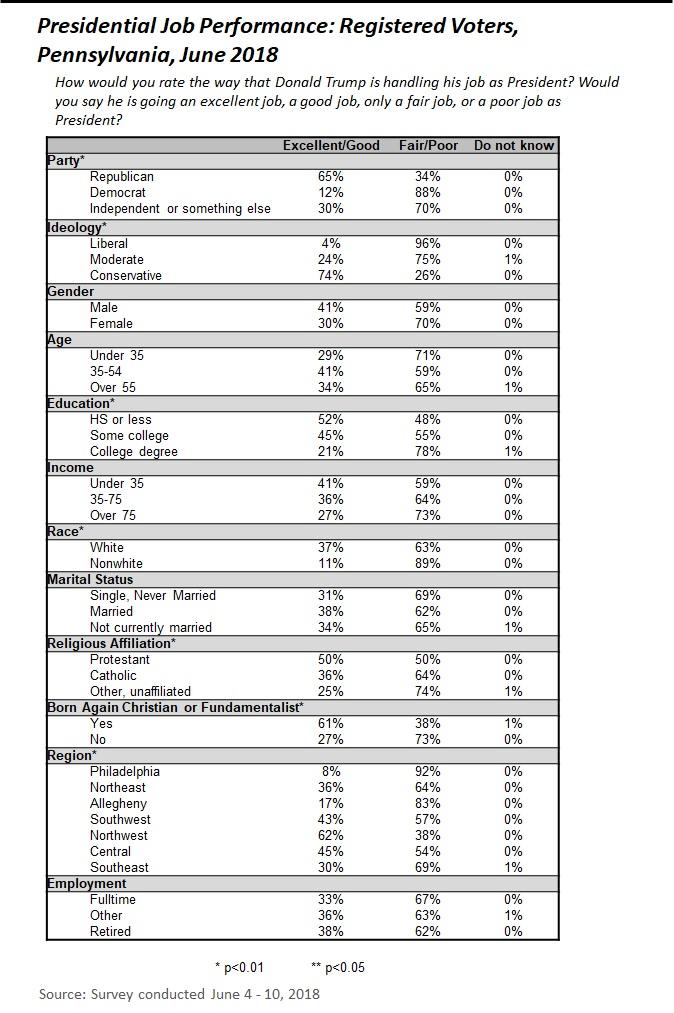
4 Voter Interest and Turnout Nearly half (55%) of the state s registered voters say they are very interested in the 2018 elections. Voter interest is related to both political party and political ideology. At the moment, more Democrats (62%) than Republicans (50%) or independents (41%) say they are very interested. More self-described liberals (67%) than conservatives (54%) or moderates (45%) say they are very interested. Interest in the election has increased among all groups since our March survey. The outcomes of the 2018 mid-terms will be driven by differences in voter turnout among partisans, but likely voter models based on administrative data and self-described interest produce different results. For example, two in five (44%) voters in the sample have voted in the past three general elections; this produces similar proportions of Republicans (47%) and Democrats (45%) being likely to vote if past voting is an indicator of interest and turnout. But more Democrats (60%) than Republicans (46%) qualify as likely voters when self-described interest and intention to vote is used to measure turnout. President Trump: Job Performance About one in three (35%) registered voters in Pennsylvania believes President Trump is doing an excellent or good job as president, which is an improvement compared to his ratings in the March survey. Figure 1 compares President Trump s job ratings to President Obama s job ratings; President Trump s current rating is below President Obama s rating in Pennsylvania at a similar point in his Presidency. A majority of Republicans (65%) rate the President s performance positively, while fewer Democrats (12%) or independents (30%) do so. Conservatives (74%) are more likely than moderates (24%) or liberals (4%) to give the President positive job approval ratings. 4
5 Figure 1: 5
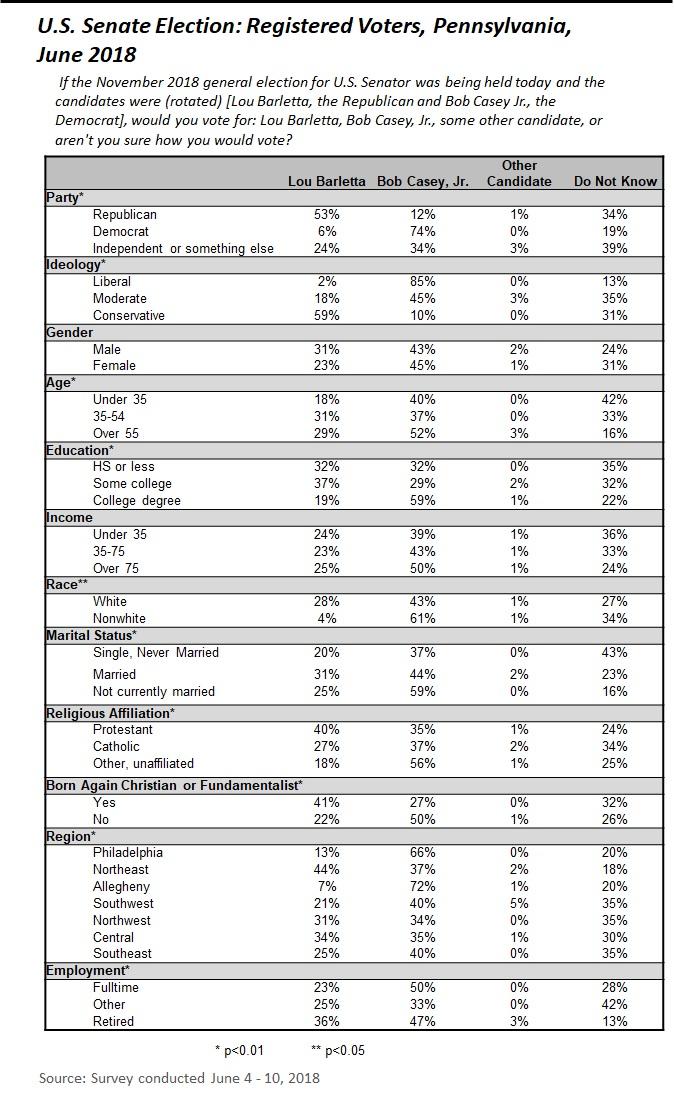
6 About one in three (33%) voters say they have had an increase in their income because of the tax cut passed in December, although most (63%) of these respondents report seeing only a small increase. Republicans (46%) are more likely than Democrats (21%) or independent voters (36%) to say they have seen an increase in their incomes. Most respondents do not believe (37%) or do not know (23%) that the Trump Administration has made significant changes to the Affordable Care Act (ACA). Half (52%) of those who believe administrative changes to the ACA have been made say those changes will make the healthcare system worse for them. Voters judgments about tax cuts and administrative changes to the Affordable Care Act relate to voters ratings of the President. Senator Casey: Job Performance Two in five (42%) registered voters in Pennsylvania believe Senator Casey is doing an excellent or good job as the state s US Senator, which is slightly higher than his ratings in the March survey. Two-thirds (64%) of registered Democrats, two in five (42%) independents, and one in five (17%) Republicans provide positive ratings of the Senator s job performance. Senator Casey (44%) currently holds a comfortable lead over his Republican challenger, Representative Lou Barletta (27%), although nearly one in three (28%) voters remains undecided. More independents (39%) and Republicans (34%) than Democrats (19%) are currently undecided. The dynamics of the race have changed little since our March survey (see Figure 2) and reflect the fact that two in three (66%) voters don t know enough about Mr. Barletta to have an opinion. 6
7 Figure 2: 7
8 Governor Wolf: Job Performance More than two in five (45%) registered voters in Pennsylvania believe Governor Wolf is doing an excellent or good job as governor, which is similar to his ratings in our March survey. Two in three (69%) Democrats, two in five (40%) independents, and one in five (16%) Republicans provides positive ratings of the Governor s job performance. Figure 3 compares Governor Wolf s job performance ratings to his recent predecessors. Wolf s job performance rating is similar to Governor Rendell s and better than Governor Corbett s at similar points during their terms in office. Figure 3: 8
9 Governor Wolf currently leads his Republican challenger, as Figure 4 shows. Governor Wolf (48%) currently holds a comfortable lead over his Republican challenger, State Senator Scott Wagner (29%), although nearly one in four (23%) voters remains undecided. As in the U.S. Senate race, more independents (23%) and Republicans (30%) than Democrats (16%) are currently undecided. The dynamics of the race have changed little since our March survey (see Figure 4) and reflect the fact that half (47%) the state s voters don t know enough about Senator Wagner to have an opinion. Figure 4: 9
10 State Issues Nearly half (45%) of the state s registered voters believe the state is headed in the right direction. Registered voters mention unemployment and the economy (14%), government and politicians (13%), taxes (12%), crime (8%), education (7%), and an assortment of other issues as being the most important problems facing the state. Three in four (72%) of the state s registered voters believe state government needs reformed, with large majorities favoring reforms to campaign finance laws, the structure and operation of the state legislature, redistricting, and state and local government financing (see Table 1). More than seven in ten (71%) favor holding a constitutional convention to review these matters. Table 1: 10
11 Methodology The survey findings presented in this release are based on the results of interviews conducted June 4-10, The interviews were conducted at the Center for Opinion Research at Franklin & Marshall College on behalf of the Center for Politics and Public Affairs. The poll was designed and administered by the staff of the Center for Opinion Research. The data included in this release represent the responses of 472 Pennsylvania registered voters, including 224 Democrats, 185 Republicans, and 63 independents. The sample of registered voters was obtained from L2, formerly Labels & Lists. All sampled respondents were notified by letter about the survey. Interviews were completed over the phone and online depending on each respondent s preference. Survey results were weighted (age, gender, education, ideology, and party registration) using an iterative weighting algorithm to reflect the known distribution of those characteristics as reported by the Pennsylvania Department of State and Pennsylvania exit polls. The sample error for this survey is +/- 6.5 percentage points when the design effects from weighting are considered. In addition to sampling error, this poll is also subject to other sources of non-sampling error. Generally speaking, two sources of error concern researchers most. Nonresponse bias is created when selected participants either choose not to participate in the survey or are unavailable for interviewing. Response errors are the product of the question and answer process. Surveys that rely on self-reported behaviors and attitudes are susceptible to biases related to the way respondents process and respond to survey questions. 11
12 Methodological Notes There are notable differences in the characteristics of respondents depending on how they completed the survey (see Figure 5). The web respondents are more educated, are more liberal, and appear to be more likely to vote than telephone respondents. These demographic differences result in both Democratic candidates performing better among web-respondents than among telephone respondents. Figure 5: 12
13 Attachment A-1 13

14 Attachment A-2 14
15 Attachment A-3 15
16 Marginal Frequency Report Responses may not total 100% due to rounding. REG. Some people are registered to vote, and many others are not. Are you currently registered to vote at your present address? 100% Yes 0% No RegPARTY. Are you currently registered as a Republican, a Democrat, an independent, or as something else? 39% Republican 48% Democrat 12% Independent 1% Something else Vot16. Did you vote in the last presidential election in 2016, or not? Yes No Jun % 6% Mar % 8% Sep % 4% May % 3% ChgVote16 As of today, do you feel comfortable with your choice for President or do you wish you could change how you voted? June 2018 Clinton Trump Other (Respondents who voted in last presidential election) n=224 n=188 n=27 Comfortable with your choice 94% 90% 85% Wish you could change 4% 6% 10% Do not know 2% 3% 5% March 2018 Clinton Trump Other (Respondents who voted in last presidential election) n=187 n=149 n=50 Comfortable with your choice 98% 91% 73% Wish you could change 2% 4% 19% Do not know 0% 5% 9% September 2017 Clinton Trump Other (Respondents who voted in last presidential election) n=193 n=138 n=29 Comfortable with your choice 92% 93% 86% Wish you could change 4% 3% 10% Do not know 3% 4% 4% 16
17 May 2017 Clinton Trump Other (Respondents who voted in last presidential election) n=313 n=247 n=49 Comfortable with your choice 96% 94% 76% Wish you could change 2% 3% 21% Do not know 2% 2% 3% Vote_Nov. Many people will vote in the election for governor and congress in November, however, many other people will not. What would you say are the chances you will vote in the November election? 76% Certain to vote 12% Probably vote 8% Chances are fifty-fifty you will vote 4% Don't think that you will vote 1% Do not know Pol_Int. Some people don't pay much attention to political campaigns. How about you? Would you say that you are very much interested, somewhat interested or not very interested in the 2018 elections? Very much Somewhat Not very interested interested interested Don t know Jun % 40% 6% 0% Mar % 43% 8% 1% Please let me know your opinion of some people involved in politics today. Is your opinion of [FILL name] favorable, unfavorable, undecided, or haven t you heard enough about [FILL name] to have an opinion? (rotated) Strongly favorable Somewhat favorable Somewhat unfavorable Strongly unfavorable Undecided Don t know TOM WOLF Jun % 30% 14% 19% 5% 13% Mar % 31% 16% 16% 6% 12% Sep % 20% 8% 34% 12% 10% Feb % 29% 15% 19% 13% 11% Feb % 25% 16% 27% 9% 9% Oct % 23% 13% 20% 16% 13% Aug % 21% 9% 17% 18% 13% Jun % 23% 10% 17% 19% 11% Mar % 18% 11% 16% 22% 11% Oct % 20% 7% 18% 18% 16% Sept % 21% 9% 13% 18% 21% Aug % 19% 7% 10% 22% 24% Jun % 20% 5% 7% 20% 32% 17
18 Strongly Somewhat Somewhat Strongly Don t Undecided favorable favorable unfavorable unfavorable know SCOTT WAGNER Jun % 13% 11% 19% 6% 47% LOU BARLETTA Jun % 6% 6% 11% 3% 66% Mar % 7% 4% 9% 4% 69% Sep % 9% 3% 6% 8% 68% BOB CASEY Jun % 26% 10% 13% 5% 29% Mar % 26% 13% 12% 8% 25% Sep % 28% 10% 14% 11% 20% Feb % 25% 13% 12% 14% 21% Oct % 23% 10% 13% 16% 27% Aug % 22% 11% 13% 17% 26% May % 26% 9% 13% 17% 18% Feb % 27% 11% 13% 16% 21% Oct % 20% 12% 19% 14% 19% Sep % 23% 13% 16% 13% 22% Aug % 25% 12% 10% 16% 27% June % 24% 10% 8% 14% 29% Jan % 20% 9% 8% 18% 35% Mar % 19% 11% 8% 19% 37% May % 23% 9% 11% 16% 31% Mar % 24% 10% 11% 17% 29% Feb % 20% 9% 9% 15% 34% Jan % 23% 11% 9% 17% 31% Oct % 21% 9% 12% 15% 32% Aug % 24% 10% 8% 17% 24% Jun % 21% 12% 5% 17% 34% Feb % 19% 9% 8% 21% 32% DONALD TRUMP Jun % 14% 7% 51% 3% 0% Mar % 15% 11% 49% 2% 2% Sep % 22% 9% 36% 6% 6% Feb % 14% 6% 51% 6% 1% Oct % 12% 6% 56% 3% 1% Sep % 12% 6% 54% 6% 1% Aug % 14% 7% 51% 5% 1% Jul % 13% 5% 57% 5% 0% Mar % 14% 9% 56% 7% 1% Feb % 15% 11% 51% 10% 1% 18
19 Vote_Gov. If the 2018 election for governor were being held today and the candidates included (rotated) [Scott Wagner, the Republican and Tom Wolf, the Democrat], would you vote for Scott Wagner, Tom Wolf some other candidate, or aren't you sure how you would vote? 29% Scott Wagner, the Republican 48% Tom Wolf, the Democrat 1% Some other candidate 23% Do not know Sen2018 If the November 2018 general election for U.S. Senator was being held today and the candidates were (rotated) [Lou Barletta, the Republican and Bob Casey Jr., the Democrat], would you vote for: Lou Barletta, Bob Casey, Jr., some other candidate, or aren't you sure how you would vote? 27% Lou Barletta, the Republican 44% Bob Casey, Jr., the Democrat 1% Some other candidate 28% Do not know GenBalH If the 2018 elections for the United States House of Representatives were being held today, would you vote for (rotated) [the Republican Party s candidate or the Democratic Party s] for the House in your district? 36% Republican Party s candidate 50% Democratic Party s candidate 15% Do not know Rate_Gov. How would you rate the way that Tom Wolf is handling his job as Governor? Would you say he is doing an excellent job, a good job, only a fair job, or a poor job as Governor? Excellent job Good job Only a fair job Poor job Don t know Jun % 36% 33% 16% 6% Mar % 37% 33% 16% 8% Sep % 34% 36% 19% 7% May % 36% 35% 17% 8% Feb % 34% 35% 19% 8% Feb % 27% 32% 29% 7% Jan % 28% 36% 26% 6% Oct % 30% 37% 21% 6% Aug % 32% 34% 17% 10% Jun % 31% 34% 16% 13% Mar % 31% 29% 14% 19% 19
20 RateSenC. How would you rate the way that Bob Casey is handling his job as US Senator? Would you say he is doing an excellent job, a good job, only a fair job, or a poor job as US Senator? Excellent Job Good Job Only a Fair Don t Poor Job Job Know Jun % 32% 29% 14% 15% Mar % 30% 32% 11% 20% Sep % 29% 27% 15% 22% May % 28% 33% 17% 13% Feb % 27% 31% 14% 18% Oct % 25% 34% 17% 20% Aug % 23% 39% 15% 19% Oct % 31% 33% 18% 12% Sep % 31% 32% 15% 16% Aug % 32% 37% 11% 16% June % 33% 32% 8% 21% Feb % 26% 43% 12% 15% Jan % 31% 36% 11% 19% Oct % 33% 38% 9% 16% Aug % 27% 43% 9% 16% Mar % 26% 39% 9% 23% Feb % 31% 32% 10% 20% Aug % 37% 36% 7% 15% RatePres. How would you rate the way that Donald Trump is handling his job as president? Would you say he is doing an excellent job, a good job, only a fair job, or a poor job as President? Excellent Job Good Job Only a Fair Job Poor Job Don t Know Jun % 18% 13% 52% 0% Mar % 17% 16% 54% 1% Sep % 16% 18% 53% 1% May % 24% 14% 49% 2% Feb % 19% 13% 54% 1% TAX1. Congress passed the Tax Cut and Job Act in December. Have you seen an increase in your household income because of this legislation? 33% Yes 59% No 8% Do not know 20
21 TAX2. Would you say it is a small, moderate, or large increase? n=153 63% Small increase 35% Moderate increase 2% Large increase HC1. How well does the current healthcare system meet the needs of you and your family? 24% Very well 45% Pretty well 18% Not too well 11% Not well at all 3% Do not know HC1NOT. Why is the current healthcare system not meeting your needs? n=135 55% Cost (ACA/Obamacare): out of pocket expense (premiums or deductibles) too high 7% Cost (in general): out of pocket expense (premiums or deductibles) too high 6% Cost (Medicare): out of pocket expense (premiums or deductibles) too high 5% Constantly changing 4% Link to employment 4% Coverage: plan does not cover much/enough 4% Lack of available options 2% Restrictive: limits choices of where to get services 1% Profit driven, lack of concern for people 1% Need for universal healthcare 8% Other 4% Do not know HC2. As far as you know, has the Trump administration made any significant changes to the Affordable Care Act? 41% Yes 37% No 23% Do not know 21
22 HC3. Do you think the changes to the regulations for the Affordable Care Act will make the healthcare system better or worse for your family? n=191 8% Much better 18% Somewhat better 20% Somewhat worse 32% Much worse 22% Do not know RightDir All in all, do you think things in Pennsylvania are generally headed in the right direction, or do you feel that things are off on the wrong track? Headed in Right Direction Off on the Wrong Track Don t know Jun % 39% 16% Mar % 40% 15% Sep % 48% 16% May % 50% 19% Feb % 52% 13% Mar % 66% 10% Feb % 67% 12% Jan % 67% 12% Oct % 62% 12% Aug % 54% 13% Jun % 47% 17% Mar % 47% 15% Oct % 61% 11% Sept % 60% 11% Aug % 61% 13% Jun % 59% 11% Jan % 62% 13% Oct % 61% 13% Aug % 62% 12% May % 58% 13% Aug % 56% 13% June % 57% 13% Feb % 56% 13% Jan % 47% 15% Oct % 49% 13% Aug % 53% 13% Mar % 53% 10% Oct % 64% 9% Sep % 59% 10% Aug % 58% 12% May % 55% 10% Mar % 58% 10% 22
23 MIP_PA. What do you think is the most important problem facing Pennsylvania today? Oct Mar Jun Aug Oct Jan Feb Mar Feb May Sep Mar June % 16% 17% 22% 39% 38% 47% 45% 24% 22% 30% 16% 13% Government, politicians 9% 17% 12% 12% 9% 9% 10% 7% 11% 12% 11% 15% 12% Taxes 5% 6% 7% 4% 4% 4% 4% 5% 3% 3% 7% 5% 9% Economy, finances 2% 3% 2% 3% 2% 3% 2% 1% 5% 5% 6% 10% 8% Crime, drugs, violence, guns 25% 19% 18% 21% 16% 18% 12% 13% 16% 17% 11% 9% 7% Education, school 2% 4% 5% 3% 2% 2% 1% 2% 4% 4% 2% 3% 7% Roads, infrastructure, transportation 20% 15% 18% 15% 12% 8% 9% 13% 12% 8% 9% 12% 5% Unemployment, personal finances 2% 4% 1% 1% 2% 2% 1% 2% 4% 8% 4% 2% 5% Healthcare, insurance 1% 1% 1% 0% 0% 0% 1% 0% 1% 1% 1% 1% 3% Immigration 5% 3% 6% 5% 2% 2% 2% 2% 3% 1% 3% 0% 3% Energy issues, gas prices 1% 1% 1% 1% 1% 1% 1% 1% 2% 3% 1% 2% 2% Environment 0% 0% 0% 0% 0% 0% 0% 0% 0% 0% 2% 1% 2% Bipartisanship 1% 1% 1% 1% 1% 1% 0% 1% 2% 2% 1% 6% 1% Social issues 1% 1% 0% 1% 1% 0% 0% 1% 1% 0% 1% 1% 1% Welfare 0% 0% 0% 0% 0% 0% 0% 0% 1% 0% 1% 1% 1% Racism 0% 0% 0% 0% 0% 0% 0% 0% 1% 0% 0% 1% 1% Justice system, Lawyers 1% 2% 1% 2% 0% 1% 1% 1% 1% 0% 1% 0% 1% Values, morals 1% 1% 6% 1% 1% 1% 0% 0% 0% 1% 0% 0% 1% Senior issues, social security 0% 0% 0% 0% 0% 0% 0% 0% 0% 0% 0% 0% 1% Daycare 0% 0% 1% 1% 1% 0% 1% 1% 2% 1% 0% 1% 0% Retaining, attracting businesses 0% 0% 0% 0% 0% 0% 0% 0% 0% 0% 0% 1% 0% Population loss, movement out of state 0% 1% 0% 0% 0% 0% 0% 0% 1% 0% 1% 0% 0% Civil liberties 0% 0% 0% 0% 0% 0% 0% 0% 0% 0% 1% 0% 0% Population, urban sprawl 2% 2% 3% 2% 3% 4% 4% 3% 4% 5% 2% 5% 3% Other 8% 5% 0% 6% 6% 8% 5% 3% 6% 7% 5% 13% 14% Don't know PAgov1. Generally speaking, do you think Pennsylvania s state government needs reform, or not? 72% Yes 16% No 12% Do not know PAgov2. How strongly do you feel about this: Very strongly, somewhat strongly, not too strongly, not strongly at all? n=337 47% Very strongly 47% Somewhat strongly 5% Not too strongly 0% Not strongly at all 1% Do not know 23
24 INTREF. I would like you to tell me if you think each area needs to be reformed. The way campaigns are financed The structure and operations of the state legislature, including the size of the legislature and term limits for elected officials The way state legislative districts are created The way state and local governments are financed Yes, definitely Yes, probably No, probably not No, not at all Don t know 57% 20% 8% 5% 9% 50% 20% 14% 7% 9% 43% 21% 14% 8% 14% 37% 35% 9% 5% 15% Redistrict. State legislative districts are currently re-drawn every ten years based on changes to the state s population. New legislative districts are re-drawn by state legislators and the state supreme court. Do you think state legislative districts should be created by an independent commission or do you think these districts should continue to be drawn by state legislators? 69% Independent commission 16% State legislators 3% Both 2% Neither 10% Do not know ConCon. Pennsylvania s constitution establishes the fundamental law of the state, ensuring basic rights to citizens, outlining the structure of state government, and providing rules by which state legislators are elected and how they conduct the state s business. The state s current constitution was adopted in 1874 and the last constitutional convention was held in Would you favor or oppose a state constitutional convention to review the state s constitution? 39% Strongly favor 32% Somewhat favor 11% Somewhat oppose 9% Strongly oppose 10% Do not know Gamb1 Generally speaking, do you think having casinos in Pennsylvania has been more positive than negative OR more negative than positive for the state? 43% More positive than negative 31% More negative than positive for the state 27% Do not know 24
25 Gamb2 The state legislature approved a bill that creates ten new mini-casinos and allows gambling at truck stops, airports, and online. In general, do you strongly support, somewhat support, somewhat oppose, or strongly oppose this expansion of legalized gambling in Pennsylvania? 11% Strongly favor 29% Somewhat favor 25% Somewhat oppose 29% Strongly oppose 7% Do not know Gamb3 A recent Supreme Court decision allows state-authorized sports betting. In general, would you strongly support, somewhat support, somewhat oppose, or strongly oppose sports betting in Pennsylvania? 15% Strongly favor 33% Somewhat favor 21% Somewhat oppose 22% Strongly oppose 9% Do not know DEMO I now have a final few questions for statistical purposes only. CNTY. Region of state (What is the name of the county you live in?) 36% Central 16% Southeast 13% Philadelphia 10% Northeast 10% Allegheny 8% Southwest 8% Northwest AGE. What was your age on your last birthday? 8% % % % % % 65 and older EDUC. What was the highest level of schooling you have completed? 1% Non high school graduate 21% High school graduate or GED 16% Some college 14% Associate s degree or technical degree 25% Bachelor s degree 23% Post graduate degree 25
26 MAR. What is your CURRENT marital status are you single, married, separated, divorced, or a widower? 58% Married 29% Single, Never Married 7% Divorced 5% Widow or widower 1% Separated 26
27 IDEO. Politically speaking, do you consider yourself to be a liberal, a moderate, or a conservative? Liberal Moderate Conservative Don t know Jun % 40% 33% 0% Mar % 40% 33% 0% May % 41% 30% 2% Feb % 42% 31% 0% Oct % 29% 34% 4% Sep % 28% 38% 4% Aug % 32% 33% 4% Jul % 30% 33% 4% Mar % 35% 37% 3% Feb % 33% 37% 3% Jan % 39% 36% 4% Oct % 38% 37% 4% Aug % 36% 40% 3% Jun % 35% 39% 4% Oct % 37% 36% 3% Sept % 36% 38% 5% Aug % 39% 36% 5% Jun % 36% 34% 5% Jan % 43% 28% 5% Oct % 39% 31% 6% Aug % 42% 33% 3% May % 39% 31% 6% Feb % 36% 35% 3% Oct % 39% 35% 5% Sep % 34% 35% 5% Aug % 40% 36% 4% June % 34% 36% 5% Feb % 39% 40% 4% Jan % 39% 36% 4% Oct % 39% 33% 8% Aug % 32% 37% 7% Mar % 33% 41% 10% Oct % 37% 39% 8% Sep % 34% 40% 10% Aug % 32% 40% 9% May % 32% 40% 9% Mar % 35% 40% 8% Feb % 33% 37% 9% Jan % 30% 42% 9% 27
28 PARTY. Regardless of how you are registered in politics, as of today, do you think of yourself as a Republican, a Democrat, or an independent? 20% Strong Republican 10% Republican 11% Lean Republican 6% Independent 12% Lean Democrat 13% Democrat 26% Strong Democrat 2% Don t know GUN. Are you a gun owner? 31% Yes 69% No 28
29 GUN2. Generally speaking, do you favor or oppose creating more laws that regulate gun ownership? Strongly Somewhat favor favor Somewhat oppose Strongly oppose Don t know Jun % 15% 9% 20% 2% Mar % 20% 7% 19% 3% Sep % 23% 11% 24% 4% Feb % 19% 14% 23% 2% Oct % 27% 12% 21% 4% Sep % 21% 10% 23% 3% Aug % 16% 16% 26% 3% Jul % 18% 10% 25% 4% Mar % 17% 10% 28% 3% Feb % 16% 13% 29% 3% Jan % 15% 13% 29% 3% Oct % 13% 10% 31% 4% Aug % 14% 10% 32% 5% Jun % 13% 12% 33% 5% Oct % 12% 8% 37% 2% Sept % 14% 10% 32% 5% Aug % 14% 10% 31% 6% Jun % 12% 9% 31% 5% Jan % 12% 9% 32% 6% Oct % 16% 9% 24% 5% Aug % 12% 13% 33% 4% May % 14% 11% 30% 3% Feb 2013* 43% 15% 10% 28% 4% Aug % 20% 14% 23% 3% Jun % 15% 12% 31% 3% Feb % 17% 15% 26% 3% LABR. Are you or is any member of your household a member of a LABOR UNION? 22% Yes 77% No 1% Do not know VET. Are you a military veteran? 9% Yes 91% No Hisp. Are you Hispanic or Latino, or not? 2% Yes 97% No 29
30 RACE. Which of the following categories best describes your racial background? 91% White 9% Non-white REL. Do you consider yourself to be Protestant, Catholic, some other religion, or not affiliated with any religion? 31% Protestant 26% Catholic 16% Some other religion 27% Not affiliated with any religion 1% Do not know BAC. Do you consider yourself to be a born-again Christian or fundamentalist, or not? 23% Yes 74% No 2% Don t know NUMC. How many children under 18 years of age currently live in your household? 74% None 11% One 14% 2-3 1% 4-5 WORK. Are you currently working fulltime, part-time, going to school, keeping house or something else? 45% Full-time 26% Retired 15% Part-time 8% Something else 3% Disabled 2% Going to school 1% Unemployed INCOME. And, just for statistical purposes, we need to know if your total family income is above or below $50,000 per year? 7% Under $25,000 8% $25-$35,000 7% $35-50,000 25% $50-75,000 20% $75-100,000 31% Over $100,000 2% Don t know 30
31 DONE. Sex of respondent: 48% Male 52% Female 31
March Franklin & Marshall. College Poll SUMMARY OF FINDINGS. Prepared by: Center for Opinion Research. Floyd Institute for Public Policy
 For immediate release March 29, 2018 March 2018 Franklin & Marshall College Poll SUMMARY OF FINDINGS Prepared by: Center for Opinion Research Floyd Institute for Public Policy Franklin & Marshall College
May 2017 Franklin n & Marshall College Poll SUMMARY OF FINDINGS
 For immediate release May 11, 2017 May 2017 Franklinn & Marshall College Poll SUMMAR RY OF FINDINGS Prepared by: Center for Opinionn Research Floyd Institute for Public Policy Franklin & Marshall College
August Franklin & Marshall. College Poll SUMMARY OF FINDINGS. Prepared by: Center for Opinion Research. Floyd Institute for Public Policy
 For immediate release August 30, 2018 August 2018 Franklin & Marshall College Poll SUMMARY OF FINDINGS Prepared by: Center for Opinion Research Floyd Institute for Public Policy Franklin & Marshall College
October 31, 2013 SUMMAR BERWOOD A. YOST AFFAIRS AND PUBLIC KAY K. HUEBNER OPINION RESEARCH
 For immediatee release October 31, 2013 Franklinn & Marshall College Poll SURVEY OF PENNSYLVANIANS SUMMAR RY OF FINDINGS Prepared by: Center for Opinionn Research Floyd Institute for Public Policy Franklin
March Franklin & Marshall. College Poll SUMMARY OF FINDINGS. Prepared by: Center for Opinion Research. Floyd Institute for Public Policy
 For immediate release March 28, 2019 March 2019 Franklin & Marshall College Poll SUMMARY OF FINDINGS Prepared by: Center for Opinion Research Floyd Institute for Public Policy Franklin & Marshall College
Franklin & Marshall College Poll
 For immediate release August 16, 2012 Franklin & Marshall College Poll SURVEY OF PENNSYLVANIANS SUMMARY OF FINDINGS Prepared by: Center for Opinion Research Floyd Institute for Public Policy Franklin &
August 27, 2015 SUMMAR BERWOOD A. YOST AFFAIRS AND PUBLIC KAY K. HUEBNER OPINION RESEARCH SCOTTIE THOMPSON
 For immediate release August 27, 2015 Franklinn & Marshall College Poll SURVEY OF PENNSYLVANIANS SUMMAR RY OF FINDINGS Prepared by: Center for Opinionn Research Floyd Institute for Public Policy Franklin
Franklin & Marshall College Poll
 For immediate release February 7, 2013 Franklin & Marshall College Poll SURVEY OF PENNSYLVANIANS SUMMARY OF FINDINGS Prepared by: Center for Opinion Research Floyd Institute for Public Policy Franklin
SUMMAR BERWOOD A. YOST AFFAIRS AND PUBLIC KAY K. HUEBNER OPINION RESEARCH
 For immediate release May 14, Franklinn & Marshall College Poll SURVEY OF PENNSYLVANIANS SUMMAR RY OF FINDINGS Prepared by: Center for Opinionn Research Floyd Institute for Public Policy Franklin & Marshall
June 2007 Pennsylvania Keystone Poll
 For immediate release Thursday, June 7, 2007 June 2007 Pennsylvania Keystone Poll SUMMARY OF FINDINGS Prepared by: Center for Opinion Research Floyd Institute for Public Policy Franklin & Marshall College
October Franklin & Marshall. College Poll SUMMARY OF FINDINGS. Prepared by: Center for Opinion Research. Floyd Institute for Public Policy
 For immediate release November 1, 2018 October 2018 Franklin & Marshall College Poll SUMMARY OF FINDINGS Prepared by: Center for Opinion Research Floyd Institute for Public Policy Franklin & Marshall College
SUMMAR BERWOOD A. YOST AFFAIRS AND PUBLIC KAY K. HUEBNER OPINION RESEARCH
 For immediate release July 2, 2014 Franklinn & Marshall College Poll SURVEY OF PENNSYLVANIANS SUMMAR RY OF FINDINGS Prepared by: Center for Opinionn Research Floyd Institute for Public Policy Franklin
Franklin & Marshall College Poll
 For immediate release September 26, 2012 Franklin & Marshall College Poll SURVEY OF PENNSYLVANIANS SUMMARY OF FINDINGS Prepared by: Center for Opinion Research Floyd Institute for Public Policy Franklin
October Franklin & Marshall College Poll SURVEY OF PENNSYLVANIANS SUMMARY OF FINDINGS
 For immediate release Wednesday, October 27, 2010 October 2010 Franklin & Marshall College Poll SURVEY OF PENNSYLVANIANS SUMMARY OF FINDINGS Prepared by: Center for Opinion Research Floyd Institute for
October 29, 2014 SUMMAR BERWOOD A. YOST AFFAIRS AND PUBLIC KAY K. HUEBNER OPINION RESEARCH
 For immediatee release October 29, 2014 Franklinn & Marshall College Poll SURVEY OF PENNSYLVANIANS SUMMAR RY OF FINDINGS Prepared by: Center for Opinionn Research Floyd Institute for Public Policy Franklin
March Franklin & Marshall College Poll SURVEY OF PENNSYLVANIANS SUMMARY OF FINDINGS
 For immediate release Thursday, March 20, 2008 March 2008 Franklin & Marshall College Poll SURVEY OF PENNSYLVANIANS SUMMARY OF FINDINGS Prepared by: Center for Opinion Research Floyd Institute for Public
Franklin & Marshall College Poll
 For immediate release September 1, 2011 Franklin & Marshall College Poll SURVEY OF PENNSYLVANIANS SUMMARY OF FINDINGS Prepared by: Center for Opinion Research Floyd Institute for Public Policy Franklin
August Franklin & Marshall College Poll SURVEY OF PENNSYLVANIANS SUMMARY OF FINDINGS
 For immediate release Thursday, August 26, August Franklin & Marshall College Poll SURVEY OF PENNSYLVANIANS SUMMARY OF FINDINGS Prepared by: Center for Opinion Research Floyd Institute for Public Policy
February Franklin & Marshall College Poll PHILADELPHIA STATE OF THE CITY SUMMARY OF FINDINGS
 For immediate release Thursday, February 10, 2011 February 2011 Franklin & Marshall College Poll PHILADELPHIA STATE OF THE CITY SUMMARY OF FINDINGS Prepared by: Center for Opinion Research Floyd Institute
October Franklin & Marshall College Poll NATIONAL SURVEY SUMMARY OF FINDINGS
 For immediate release Wednesday, October 22, 2008 October 2008 Franklin & Marshall College Poll NATIONAL SURVEY SUMMARY OF FINDINGS Prepared By: Center for Opinion Research Center for Politics & Public
North Carolina Statewide Unaffiliated Survey 2016
 North Carolina Statewide Unaffiliated Survey 2016 Interview Schedule N = 400 North Carolina Unaffiliated Voters Margin of Error +/- 4.90% Field Dates: August 11-14, 2016 (ASK ALL) 1. First, are you registered
Marquette Law School Poll Toplines- September 13-16, 2012 (Reported total sample size may differ from 705 due to rounding of weighted data.
 Marquette Law School Poll Toplines- September 13-16, 2012 (Reported total sample size may differ from 705 due to rounding of weighted data.) S2 Gender Male 335 48 Female 370 52 S4 Region Milwaukee City
Interview dates: October 23-30, 2006 Interviews: 900 black respondents, 706 registered voters, 361 likely voters (202)
") 1101 Connecticut Avenue NW, Suite 200 Washington, DC 20036 Interview dates: October 23-30, 2006 Interviews: 900 black respondents, 706 registered voters, 361 likely voters (202) 463-7300 Margin of error:
1101 Connecticut Avenue NW, Suite 200 Washington, DC 20036 Interview dates: October 23-30, 2006 Interviews: 900 black respondents, 706 registered voters, 361 likely voters (202) 463-7300 Margin of error:
Morning Consult National Tracking Poll # September 14-17, Crosstabulation Results
 Morning Consult National Tracking Poll #170911 September 14-17, 2017 Crosstabulation Results Methodology: This poll was conducted from September 14-17, 2017, among a national sample of 1994 registered
Center for Public Policy : Polls
 Center for Public Policy : Polls Where policy matters. A Survey of 804 Likely Voters - Virginia Statewide - July, 2014 Area: Southwest: 18.0 % DC Suburbs: 25.0 % Southeast: 4.0 % Tidewater-Hampton Roads:
Western New England University Polling Institute May 29-31, 2012
 Western New England University Polling Institute May 29-31, 2012 TABLES Please tell me if you have a favorable or unfavorable opinion of the following people. If you haven't heard of them or don't have
Western New England University Polling Institute May 29-31, 2012
 Western New England University Polling Institute May 29-31, TABLES Do you approve or disapprove of the way Barack Obama is handling his job as president? May 29-31, Obama Job Approval Approve Disapprove
S2 Gender N % Male % Female %
 Marquette Law School Poll Toplines January 19-22, 2012 (Reported total sample size may differ from 701 due to rounding of weighted data.) S2 Gender Male 356 51% Female 345 49% S4 Region Milwaukee City
Marquette Law School Poll Toplines- June 13-16, 2012 (Reported total sample size may differ from 707 due to rounding of weighted data.
 Marquette Law School Poll Toplines- June 13-16, 2012 (Reported total sample size may differ from 707 due to rounding of weighted data.) S2 Gender Male 337 48 Female 370 52 S4 Region Milwaukee City 94 13
Women Voters Ages 50+ and the 2016 Election: Thoughts on Social Security and the Presidential Candidates
 Women Voters Ages 50+ and the 2016 Election: Thoughts on Social Security and the Presidential Candidates Annotated Questionnaire for Full Sample of 1500 Women Ages 50+ Across 15 Battleground States* (AZ,
National Tracking Poll # July 13-14, Crosstabulation Results
 National Tracking Poll #180724 July 13-14, 2018 Crosstabulation Results Methodology: This poll was conducted from July 13-14, 2018, among a national sample of 1991 registered voters. The interviews were
Morning Consult National Tracking Poll # April 05-07, Crosstabulation Results
 Morning Consult National Tracking Poll #180408 April 05-07, 2018 Crosstabulation Results Methodology: This poll was conducted from April 05-07, 2018, among a national sample of 1994 Registered Voters.
Morning Consult National Tracking Poll # January 18-20, Crosstabulation Results
 Morning Consult National Tracking Poll #180111 January 18-20, 2018 Crosstabulation Results Methodology: This poll was conducted from January 18-20, 2018, among a national sample of 1994 Registered Voters.
Women Voters Ages 50+ and the 2016 Election. Annotated Questionnaire for Women Ages 50+ in Florida* TOTAL Unweighted N=
 Women Voters Ages 50+ and the 2016 Election Annotated Questionnaire for Women Ages 50+ in Florida* Please note that all results shown are percentages. TOTAL 50-69 70+ Unweighted N= 717 475 242 Northeast...
Vanderbilt University Poll December Survey Results
 Vanderbilt University Poll December 2012 Survey Results Vanderbilt University Poll December 2012 Toplines for REGISTERED VOTERS N = 829; Margin of Error +/- 4.3% SEX. Record Respondent s sex Male 48% Female
20% 40% 60% 80% 100% AARP
 AARP Survey of Idaho Registered Voters ages 30 64: State Health Insurance Exchange Prepared by Jennifer H. Sauer State Research, AARP State health insurance exchanges are a provision of the new health
Morning Consult National Tracking Poll # May 12-14, Crosstabulation Results
 Morning Consult National Tracking Poll #170507 May 12-14, 2017 Crosstabulation Results Methodology: This poll was conducted from May 12-14, 2017, among a national sample of 2001 registered voters. The
Morning Consult National Tracking Poll # March 08-12, Crosstabulation Results
 Morning Consult National Tracking Poll #180312 March 08-12, 2018 Crosstabulation Results Methodology: This poll was conducted from March 08-12, 2018, among a national sample of 1997 registered voters.
National Tracking Poll # March 01-03, Crosstabulation Results
 National Tracking Poll #190301 March 01-03, 2019 Crosstabulation Results Methodology: This poll was conducted between March 1-March 3, 2019 among a national sample of 1993 Registered Voters. The interviews
2010 Pennsylvania General Election T racking Poll
 M U H L E NB E R G C O L L E G E /M O RNIN G C A L L 2010 Pennsylvania General Election T racking Poll RELEASE #8 October 27, 2010 FIELDING PERIOD October 23-26, 2010 SAMPLE 457 Likely Voters in Pennsylvania
National Tracking Poll # February 15-19, Crosstabulation Results
 National Tracking Poll #190232 February 15-19, 2019 Crosstabulation Results Methodology: This poll was conducted from February 15-19, 2019, among a national sample of 1914 Registered Voters. The interviews
Hello, my name is from HAI, a national research firm.
 Copyright 2014 April 24-30, 2014 400 Interviews New Hampshire HAI3235 Margin of Error: +/- 4.9% Hello, my name is from HAI, a national research firm. [IF LANDLINE] We're conducting a survey in New Hampshire
Western New England University Polling Institute Massachusetts Statewide Survey, Oct. 23 Nov. 2, 2016 Tables
 Western New England University Polling Institute Massachusetts Statewide Survey, Tables Next, please tell me if you have a favorable or unfavorable opinion of the following people. If you haven't heard
THE AP-GfK POLL October, 2013
 Public Affairs & Corporate Communications THE AP-GfK POLL October, 2013 Conducted by GfK Public Affairs & Corporate Communications A survey of the American general population (ages 18+) Interview dates:
Morning Consult National Tracking Poll # January 11-16, Crosstabulation Results
 Morning Consult National Tracking Poll #180108 January 11-16, 2018 Crosstabulation Results Methodology: This poll was conducted from January 11-16, 2018, among a national sample of 1993 registered voters.
THE AP-GfK POLL December, 2013
 Public Affairs & Corporate Communications THE AP-GfK POLL December, 2013 Conducted by GfK Public Affairs & Corporate Communications A survey of the American general population (ages 18+) Interview dates:
Women Voters Ages 50+ and the 2016 Election
 Women Voters Ages 50+ and the 2016 Election Annotated Questionnaire for Latina Women Ages 50+ Across 15 Battleground States* (AZ, CO, FL, GA, IA, MI, MN, NC, NH, NM, NV, OH, PA, VA, and WI) Please note
THE AP-GfK POLL May, 2014
 Public Affairs & Corporate Communications THE AP-GfK POLL May, 2014 Conducted by GfK Public Affairs & Corporate Communications A survey of the American general population (ages 18+) Interview dates: May
Women Voters Ages 50+ and the 2016 Election
 Women Voters Ages 50+ and the 2016 Election Annotated Questionnaire for African American/Black Women Ages 50+ Across 15 Battleground States* (AZ, CO, FL, GA, IA, MI, MN, NC, NH, NM, NV, OH, PA, VA, and
How the Survey was Conducted Nature of the Sample: McClatchy-Marist National Poll of 1,197 Adults
 How the Survey was Conducted Nature of the Sample: McClatchy-Marist National Poll of 1,197 Adults This survey of 1,197 adults was conducted February 4 th through February 9 th, 2014 by The Marist Poll
How the Survey was Conducted Nature of the Sample: NBC News/WSJ/Marist New Hampshire Poll of 1,108 Adults
 How the Survey was Conducted Nature of the Sample: NBC News/WSJ/Marist New Hampshire Poll of 1,108 Adults This survey of 1,108 adults was conducted September 6 th through September 8 th, 2016 by The Marist
June 12-16, 2009 N= 895. All trends are from New York Times/CBS News polls unless otherwise noted. An asterisk indicates registered respondents only.
 z POLL June 12-16, 2009 N= 895 All trends are from New York Times/CBS News polls unless otherwise noted. An asterisk indicates registered respondents only. 6. Do you approve or disapprove of the way Barack
National Tracking Poll # December 04-04, Crosstabulation Results
 National Tracking Poll #181159 December 04-04, 2018 Crosstabulation Results Methodology: This poll was conducted from December 04-04, 2018, among a national sample of 1975 Registered Voters. The interviews
Interview dates: October 23-25, 2006 Interviews: 1,000 respondents, 885 registered voters, 556 likely voters (202)
") 1101 Connecticut Avenue NW, Suite 200 Washington, DC 20036 Interview dates: Interviews: 1,000 respondents, 885 registered voters, 556 likely voters (202) 463-7300 Margin of error: +3.1 for all adults,
1101 Connecticut Avenue NW, Suite 200 Washington, DC 20036 Interview dates: Interviews: 1,000 respondents, 885 registered voters, 556 likely voters (202) 463-7300 Margin of error: +3.1 for all adults,
Morning Consult National Tracking Poll # December 08-11, Crosstabulation Results
 Morning Consult National Tracking Poll #171203 December 08-11, 2017 Crosstabulation Results Methodology: This poll was conducted from December 08-11, 2017, among a national sample of 1955 registered voters.
National Tracking Poll # March 01-03, Crosstabulation Results
 National Tracking Poll #190301 March 01-03, 2019 Crosstabulation Results Methodology: This poll was conducted from March 01-03, 2019, among a national sample of 1993 Registered Voters. The interviews were
HOW THE POLL WAS CONDUCTED
 HOW THE POLL WAS CONDUCTED This poll was conducted for Telemundo by Mason-Dixon Polling & Strategy, Inc. of Jacksonville, Florida from October 25 through October 30, 2018. A total of 625 registered Hispanic
Civitas Institute North Carolina Statewide Poll Results February 11 13, 2019
 Civitas Institute North Carolina Statewide Poll Results February 11 13, 2019 Q. Do you feel things in the United States are generally headed in the right direction or have things gotten off on the wrong
Morning Consult National Tracking Poll # January 04-05, Crosstabulation Results
 Morning Consult National Tracking Poll #180102 January 04-05, 2018 Crosstabulation Results Methodology: This poll was conducted from January 04-05, 2018, among a national sample of 1988 registered voters.
National Tracking Poll
 National Tracking Poll Project: 180326 N Size: 1992 Registered Voters Margin of Error: ± 2% Topline Report March 20-21, 2018 P1 Question Response Frequency Percentage Now, generally speaking, would you
THE AP-GfK POLL December, 2013
 Public Affairs & Corporate Communications THE AP-GfK POLL December, 2013 Conducted by GfK Public Affairs & Corporate Communications A survey of the American general population (ages 18+) Interview dates:
THE AP-GfK POLL March, 2014
 Public Affairs & Corporate Communications THE AP-GfK POLL March, 2014 Conducted by GfK Public Affairs & Corporate Communications A survey of the American general population (ages 18+) Interview dates:
Marquette Law School Poll Toplines- July 5-8, 2012 (Reported total sample size may differ from 1,000 due to rounding of weighted data.
 Marquette Law School Poll Toplines- July 5-8, 2012 (Reported total sample size may differ from 1,000 due to rounding of weighted data.) S2 Gender Male 475 48 Female 525 53 S4 Region Milwaukee City 101
Production & Offshore Drilling July 2014
 Production & Offshore Drilling July 2014 Created for: American Petroleum Institute Presented by: Nielsen Interviewing: July 10 July 13, 2014 Respondents: 1012 Registered Voters Method: Telephone Sample:
National Tracking Poll # July 06-10, Crosstabulation Results
 National Tracking Poll #180708 July 06-10, 2018 Crosstabulation Results Methodology: This poll was conducted from July 06-10, 2018, among a national sample of 1999 Registered Voters. The interviews were
National Tracking Poll
 National Tracking Poll Project: 180634 N Size: 1993 Registered Voters Margin of Error: ± 2% Topline Report June 20-25, 2018 P1 Question Response Frequency Percentage Now, generally speaking, would you
THE ASSOCIATED PRESS POLL CONDUCTED BY IPSOS-PUBLIC AFFAIRS RELEASE DATE: AUGUST 19, 2004 PROJECT # REGISTERED VOTERS/PARTY IDENTIFICATION
 1101 Connecticut Avenue NW, Suite 200 Washington, DC 20036 (202) 463-7300 Interview dates: Interviews: 1,001 adults Margin of error: +3.1 THE ASSOCIATED PRESS POLL CONDUCTED BY IPSOS-PUBLIC AFFAIRS RELEASE
North Carolina Survey Results
 North Carolina Survey Results Q1 Q2 Q3 Q4 Would you strongly support, somewhat support, somewhat oppose or strongly oppose efforts to reform North Carolina s bail system? 33%... 41%......... 8% 4%... 14%
National Tracking Poll # May 18-22, Crosstabulation Results
 National Tracking Poll #180538 May 18-22, 2018 Crosstabulation Results Methodology: This poll was conducted from May 18-22, 2018, among a national sample of 1993 Registered Voters. The interviews were
ASSOCIATED PRESS: SOCIAL SECURITY STUDY CONDUCTED BY IPSOS PUBLIC AFFAIRS RELEASE DATE: MAY 5, 2005 PROJECT #
 1101 Connecticut Avenue NW, Suite 200 Washington, DC 20036 (202) 463-7300 Interview dates: Interviews: 1,000 adults, 849 registered voters Margin of error: +3.1 for all adults, +3.4 for registered voters
THE AP-GfK POLL. Conducted by GfK Roper Public Affairs & Media
 GfK Custom Research North America THE AP-GfK POLL Conducted by GfK Roper Public Affairs & Media Interview dates: September 27-30, 2008 Interviews: 1,160 adults; 808 likely voters Margin of error: +/- 2.9
2016 AARP Arizona Voter Retirement Security Survey Annotation
 2016 AARP Arizona Voter Retirement Security Survey Annotation Registered Voters Age 35-70 Sampling Questions 1. Age of Respondents [35-70 Registered Voters] 35-49 37.3% 50-64 44.8% 65-70 17.9% 2. Are you
THE WMUR GRANITE STATE POLL THE UNIVERSITY OF NEW HAMPSHIRE SURVEY CENTER
 THE WMUR GRANITE STATE POLL THE UNIVERSITY OF NEW HAMPSHIRE SURVEY CENTER October 8, 2014 SHAHEEN AND BROWN RACE REMAINS TIGHT By: Andrew E. Smith, Ph.D. Zachary S. Azem, M.A. UNH Survey Center 603/862-2226
National Tracking Poll
 National Tracking Poll Project: 160812 N Size: 2001 Registered Voters Margin of Error: ± 2% Topline Report September 01-02, 2016 P1 Question Response Frequency Percentage Now, generally speaking, would
National Tracking Poll # January 18-22, Crosstabulation Results
 National Tracking Poll #190140 January 18-22, 2019 Crosstabulation Results Methodology: This poll was conducted from January 18-22, 2019, among a national sample of 1996 Registered Voters. The interviews
WBUR Poll Survey of 399 Republican Primary Voters in Massachusetts Field Dates: June 22-25, 2018
 Conducted for WBUR by WBUR Poll Survey of 399 Republican Primary Voters in Massachusetts Field Dates: June 22-25, 2018 I'm going to read you the names of several people and groups who are active in public
What America Is Thinking About Energy Issues February 2016 Presented by: Harris Poll
 What America Is Thinking About Energy Issues February 2016 Virginia Presented by: Harris Poll Interviewing: January 22 February 1, 2016 Respondents: 630 Registered Voters Method: Telephone Weighting: Results
What America Is Thinking On Energy Issues February 2016
 What America Is Thinking On Energy Issues February 2016 South Carolina Presented by: Harris Poll Interviewing: January 22-31, 2016 Respondents: 600 Registered Voters Method: Telephone Weighting: Results
Right direction 33% 34% Wrong track 57% 56% Neither 3% 2% Don t know / Refused 7% 7%
 Heartland Monitor Poll XIII ALLSTATE/NATIONAL JOURNAL HEARTLAND MONITOR POLL XIII National Sample of 1000 ADULTS AGE 18+ (Margin of Error = +/-3.1% in 95 out of 100 cases) Conducted May 19-23, 2012 via
PEW SOCIAL & DEMOGRAPHIC TRENDS JULY 2012 MIDDLE CLASS UPDATE SURVEY FINAL TOPLINE JULY 16-JULY 26, 2012 TOTAL N=2,508
 1 PEW SOCIAL & DEMOGRAPHIC TRENDS JULY 2012 MIDDLE CLASS UPDATE SURVEY FINAL TOPLINE JULY 16-JULY 26, 2012 TOTAL N=2,508 NOTE: ALL NUMBERS ARE PERCENTAGES. THE PERCENTAGES GREATER THAN ZERO BUT LESS THAN
Morning Consult National Tracking Poll # August 24-28, Crosstabulation Results
 Morning Consult National Tracking Poll #170814 August 24-28, 2017 Crosstabulation Results Methodology: This poll was conducted from August 24-28, 2017, among a national sample of 1999 registered voters.
PENSION POLL 2015 TOPLINE RESULTS
 PENSION POLL 2015 TOPLINE RESULTS RELEASED: FEBRUARY 6, 2015 The Reason-Rupe Pension Poll interviewed 1,003 adults on both mobile (501) and landline (502) phones, including 290 respondents without landlines,
THE WMUR GRANITE STATE POLL THE UNIVERSITY OF NEW HAMPSHIRE SURVEY CENTER
 THE WMUR GRANITE STATE POLL THE UNIVERSITY OF NEW HAMPSHIRE SURVEY CENTER October 10, 2014 OBAMA STAYS UNPOPULAR IN NH, HURTS DEMOCRATS ELECTION CHANCES By: Andrew E. Smith, Ph.D. Zachary S. Azem, M.A.
Morning Consult National Tracking Poll # February 22-26, Crosstabulation Results
 Morning Consult National Tracking Poll #180217 February 22-26, 2018 Crosstabulation Results Methodology: This poll was conducted from February 22-26, 2018, among a national sample of 1992 registered voters.
THE POLITICO-GW BATTLEGROUND POLL
 THE POLITICO-GW BATTLEGROUND POLL A national survey of 1,000 Registered Likely Voters Do you feel things in the country are going in the right direction, or do you feel things have gotten off on the wrong
ASSOCIATED PRESS: TAXES STUDY CONDUCTED BY IPSOS PUBLIC AFFAIRS RELEASE DATE: APRIL 7, 2005 PROJECT # REGISTERED VOTERS/ PARTY AFFILIATION
 1101 Connecticut Avenue NW, Suite 200 Washington, DC 20036 (202) 463-7300 Interview dates: Interviews: 1,001 adults Margin of error: +3.1 ASSOCIATED PRESS: TAXES STUDY CONDUCTED BY IPSOS PUBLIC AFFAIRS
What America Is Thinking Access Virginia Fall 2013
 What America Is Thinking Access Virginia Fall 2013 Created for: American Petroleum Institute Presented by: Harris Interactive Interviewing: September 24 29, 2013 Respondents: 616 Virginia Registered Voters
What America Is Thinking On Energy Issues January 2015
 What America Is Thinking On Energy Issues January 2015 South Carolina Offshore Drilling Presented by: Harris Poll Interviewing: January 13-15, 2015 Respondents: 604 Registered Voters Method: Telephone
National Tracking Poll
 National Tracking Poll Project: 180115 N Size: 20429 Registered Voters Margin of Error: ± 1% Topline Report January 16-29, 2018 P1 Question Response Frequency Percentage Now, generally speaking, would
How the Survey was Conducted Nature of the Sample: NBC News/WSJ/Marist North Carolina Poll of 1,136 Adults
 How the Survey was Conducted Nature of the Sample: NBC News/WSJ/Marist North Carolina Poll of 1,136 Adults This survey of 1,136 adults was conducted October 25 th and October 26 th, 2016 by The Marist
National Tracking Poll
 National Tracking Poll Project: 160703 N Size: 2803 Registered Voters Margin of Error: ± 2% Topline Report July 22-24, 2016 P1 Question Response Frequency Percentage Now, generally speaking, would you
How the Survey was Conducted Nature of the Sample: NBC News/WSJ/Marist North Carolina Poll of 1,136 Adults
 How the Survey was Conducted Nature of the Sample: NBC News/WSJ/Marist North Carolina Poll of 1,136 Adults This survey of 1,136 adults was conducted October 25 th and October 26 th, 2016 by The Marist
How the Survey was Conducted Nature of the Sample: NBC 4 NY/WSJ/Marist Poll of 1,213 New York City Adults
 How the Survey was Conducted Nature of the Sample: NBC 4 NY/WSJ/Marist Poll of 1,213 New York City Adults This survey of 1,213 New York City adults was conducted July 8 th and July 9 th, 2013. Adults 18
How the Survey was Conducted Nature of the Sample: NBC News/WSJ/Marist North Carolina Poll of 1,150 Adults
 How the Survey was Conducted Nature of the Sample: NBC News/WSJ/Marist North Carolina Poll of 1,150 Adults This survey of 1,150 adults was conducted October 10 th through October 12 th, 2016 by The Marist
NALEO/Latino Decisions Tracking Poll 2018 CALIFORNIA CROSSTABS
 Q1. Many people are busy and don t get a chance to vote in every election. Thinking ahead to the November 2018 election, what would you say the chances are that you will vote in the election U.S. Congress
Ohio Tracking Poll. If the election for U.S. Senate was held today, which one of the following candidates are you most likely to vote for?
 Ohio Tracking Poll Project: 180928 N Size: 1592 Registered Voters In Ohio Margin of Error: ± 2% Topline Report September 02-11, 2018 POL3 Question Response Frequency Percentage If the election for U.S.
2012 AARP Survey of New York Registered Voters Ages on the Development of a State Health Insurance Exchange
 2012 AARP Survey of New York Registered Voters Ages 30-64 on the Development of a State Health Insurance Exchange State health insurance exchanges are a provision of the new health law passed by Congress
National Tracking Poll # January 25-27, Crosstabulation Results
 National Tracking Poll #190156 January 25-27, 2019 Crosstabulation Results Methodology: This poll was conducted from January 25-27, 2019, among a national sample of 1997 Registered Voters. The interviews
The Arkansas Poll, 2014 Summary Report
 nt CONTACTS: Janine Parry, Poll Director, 479-575-6439 or 479-409-0968, parry@uark.edu Barbara Jaquish, Director of Science and Research Communication, 479-575-2683, jaquish@uark.edu The Arkansas Poll,
Marist College Institute for Public Opinion Poughkeepsie, NY Phone Fax
 Marist College Institute for Public Opinion Poughkeepsie, NY 12601 Phone 845.575.5050 Fax 845.575.5111 www.maristpoll.marist.edu POLL MUST BE SOURCED: NBC News/Marist Poll* Kentucky: McConnell Outpaces