Honors Statistics. 3. Review OTL C6#6. emphasis Normal Distributions. Chapter 6 Section 2 Day s.notebook. May 05, 2016.
|
|
|
- Myrtle Parks
- 5 years ago
- Views:
Transcription


1 Honors Statistics Aug 23-8:26 PM 3. Review OTL C6#6 emphasis Normal Distributions Aug 23-8:31 PM 1


2 Nov 21-8:16 PM Rainy days Imagine that we randomly select a day from the past 10 years. Let X be the recorded rainfall on this date at the airport in Orlando, Florida, and Y be the recorded rainfall on this date at Disney World just outside Orlando. Suppose that you know the means µ X and µ Y and the variances and of both variables. (a) Is it reasonable to take the mean of the total rainfall X+ Y to be µ X + µ Y? Explain your answer. It is reasonable to take the mean of the total rainfall because the rainfall two cities that are close in location does not depend on independence. You can always combine means of data sets. (b) Is it reasonable to take the variance of the total rainfall to be Explain your answer. It is NOT reasonable to take the variance of the total rainfall because the rainfall of two closely located cities will NOT be independent. Dec 6-11:13 PM 2


3 Get on the boat! Refer to Exercise 41. Find the expected value and standard deviation of the total amount of profit made on two randomly selected days. Show your work. Big assumption... two randomly selected days are INDEPENDENT so... go ahead and calculate! Remember... µ Y = $ = $-0.65 σ Y = $6.45 Use the formula T = Y 1 + Y 2 µ T = $ $-0.65 = $-1.30 σ Y = $6.45 so σ 2 Y = (6.45) 2 = σ 2 T = σ 2 Y1 + σ 2 Y2 σ 2 T = = σ T = = $9.12 Dec 6-11:13 PM Essay errors Typographical and spelling errors can be either nonword errors or word errors. A nonword error is not a real word, as when the is typed as teh. A word error is a real word, but not the right word, as when lose is typed as loose. When students are asked to write a 250-word essay (without spell-checking), The number of nonword errors X in a randomly selected essay has the following probability distribution: The number of word errors Y has this probability distribution: Assume that X and Y are independent. An English professor deducts 3 points from a student s essay score for each nonword error and 2 points for each word error. Find the mean and standard deviation of the total score deductions for a randomly selected essay. Show your work. Use Formula D = 3(X) + 2(Y) D = deductions, X = "non-word error" and Y = word error µ D = 3(2.1) + 2(1.0) = 8.3 points deducted The expected number of points deducted on two randomly selected essays is 8.3 points. If many, many essays are randomly selected, this is the average amount of point deductions on two essays. (In the long run!!) σ X = so σ 2 X = (1.136) 2 = σ Y = 1.0 so σ 2 Y = (1.0) 2 = 1.0 σ 2 D = (3) 2 σ 2 X + (2) 2 σ 2 Y = 9(1.136) 2 + 4(1.0) 2 = σ D = = points The standard deviation of the mean is 3.95 points. The deductions on the 2 essays will typically differ from the mean of 8.3 by 3.95 points. 3


4 (for word vs. non-word errors) deducted on a... Fewer word errors than non-word errors The results in the yellow triangle make up the event a randomly selected student makes more word errors than non-word errors. women at a college has mean 120 and standard deviation 28, and the distribution of scores The standard deviation of the mean is points. The amount of points in which the female outscores the males From the information given, can you find the probability that the woman chosen scores If we new the shape of the distribution (specifically if it was normally distributed) then we could answer the question. Currently we do not have enough information. 4
5 Exercises 57 and 58 refer to the following setting. In Exercises 14 and 18 of Section 6.1,we examined the probability distribution of the random variable X = the amount a life insurance company earns on a randomly chosen 5-year term life policy. Calculations reveal that µ X = $ and σ X = $ Life insurance The risk of insuring one person s life is reduced if we insure many people. Suppose that we insure two 21-year-old males, and that their ages at death are independent. If X1 and X2 are the insurer s income from the two insurance policies, the insurer s average income W on the two policies is Find the mean and standard deviation of W. (You see that the mean income is the same as for a single policy but the standard deviation is less.) µ W = $ $ = $ σ X = $ so σ 2 x = ( ) 2 = σ 2 W = σ 2 X1 + σ 2 X2 σ 2 W = ( ) 2 + ( ) σ 2 W = σ W = = $ Nov 30-7:46 PM Life insurance If four 21-year-old men are insured, the insurer s average income is where X i is the income from insuring one man. Assuming that the amount of income earned on individual policies is independent, find the mean and standard deviation of V. (If you compare with the results of Exercise 57, you should see that averaging over more insured individuals reduces risk.) µ V = $ $ = $ σ X = $ so σ 2 x = ( ) 2 = σ 2 V = σ 2 X1 + σ 2 X2 + σ 2 X3 + σ 2 X4 4 2 σ 2 V = ( ) 2 + ( ) 2 + ( ) 2 + ( ) 2 σ 2 V = σ V = = $ Dec 6-11:13 PM 5

6 Nov 27-10:28 PM Nov 27-9:53 PM 6
7 new σ = old σ * b σ σ new σ = old σ σ σ σ σ σ 2 a+bx =b 2 * σ2 Dec 5-7:04 PM = σ = σ Dec 5-7:26 PM 7


8 = σ = σ Dec 5-7:25 PM Nov 30-7:23 PM 8

9 Nov 30-7:23 PM Dec 1-2:08 PM 9


10 Sep 26-6:57 PM Sep 26-6:58 PM 10


11 Dec 9-9:54 AM Dec 11-7:07 PM 11


12 Dec 11-7:05 PM May 4-9:19 AM 12


 2 = 4 and σ A = 4 so σ 2 A = (4) 2 = 16 σ 2 T = σ 2 P + σ 2 A σ 2 T = 4 + 16 = 20 σ T = 20 = 4.")
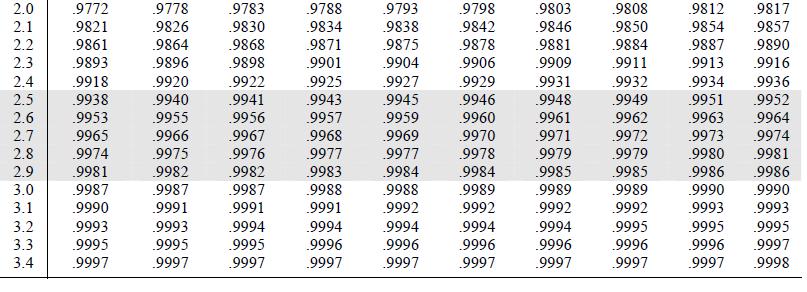
13 Nov 21-8:16 PM Time and motion A time-and-motion study measures the time required for an assembly-line worker to perform a repetitive task. The data show that the time required to bring a part from a bin to its position on an automobile chassis varies from car to car according to a Normal distribution with mean 11 seconds and standard deviation 2 seconds. The time required to attach the part to the chassis follows a Normal distribution with mean 20 seconds and standard deviation 4 seconds. The study finds that the times required for the two steps are independent. A part that takes a long time to position, for example, does not take more or less time to attach than other parts. (a) What is the distribution of the time required for the entire operation of positioning and attaching a randomly selected part? T = P + A µ T = = 31 minutes σ P = 2 so σ 2 P = (2) 2 = 4 and σ A = 4 so σ 2 A = (4) 2 = 16 σ 2 T = σ 2 P + σ 2 A σ 2 T = = 20 σ T = 20 = minutes (b) Management s goal is for the entire process to take less than 30 seconds. Find the probability that this goal will be met for a randomly selected part. X: y = 30 z = = P( Y < 30 ) = P(z < -0.22) The probability that the management will meet the goal of less than 30 seconds for a randomly selected part is approximately 41.29% Dec 6-11:13 PM 13

 What is the distribution of the total resistance of the two components in series for a randomly selected toaster?")

14 Electronic circuit The design of an electronic circuit for a toaster calls for a 100-ohm resistor and a 250-ohm resistor connected in series so that their resistances add. The components used are not perfectly uniform, so that the actual resistances vary independently according to Normal distributions. The resistance of 100-ohm resistors has mean 100 ohms and standard deviation 2.5 ohms, while that of 250-ohm resistors has mean 250 ohms and standard deviation 2.8 ohms. X and Y are independent. (a) What is the distribution of the total resistance of the two components in series for a randomly selected toaster? µ σ σ (b) Find the probability that the total resistance for a randomly selected toaster lies between 345 and 355 ohms. The probability that the total resistance for a randomly selected toaster lies between 345 and 355 ohms is approximately 81.64% Swim team Hanover High School has the best women s swimming team in the region. The 400-meter freestyle relay team is undefeated this year. In the 400-meter freestyle relay, each swimmer swims 100 meters. The times, in seconds, for the four swimmers this season are approximately Normally distributed with means and standard deviations as shown. Assume that the swimmer s individual times are independent. Find the probability that the total team time in the 400-meter freestyle relay for a randomly selected race is less than 220 seconds. Use this formula T = W + J + C + L µt = = seconds σw = 2.8 so σ 2 w = (2.8) 2 = 7.84 σj = 3.0 so σ 2 J = (3.0) 2 = 9.00 σc = 2.6 so σ 2 C = (2.6) 2 = 6.76 σl = 2.7 so σ 2 L = (2.7) 2 = 7.29 σ 2 T = σ 2 W + σ 2 J + σ 2 C + σ 2 L σ 2 T = = σ T = = or 5.56 seconds X: T = 220 z = = P( T < 220 ) = P(z < -0.76) The probability that the total team time in the 400-meter freestyle relay for a randomly selected race is less than 220 seconds is approximately 22.66% chance. 14

15 Toothpaste Ken is traveling for his business. He has a new 0.85-ounce tube of toothpaste that s supposed to last him the whole trip. The amount of toothpaste Ken squeezes out of the tube each time he brushes varies according to a Normal distribution with mean 0.13 ounces and standard deviation 0.02 ounces. If Ken brushes his teeth six times on a randomly selected trip, what s the probability that he ll use all the toothpaste in the tube? Use this formula T = D 1 + D 2 + D 3 + D 4 + D 5 + D 6 µ T = = 0.78 ounces σ D = 0.02 so σ 2 D = (0.02) 2 = σ 2 T = σ 2 D + σ 2 D + σ 2 D + σ 2 D + σ 2 D + σ 2 D σ 2 T = σ T = = or ounces X: z = = T = 0.85 P( T > 0.85 ) = P(z < 1.43) The probability that Ken will use all the toothpaste in the tube is approximately 7.64% Auto emissions The amount of nitrogen oxides (NOX) present in the exhaust of a particular type of car varies from car to car according to a Normal distribution with mean 1.4 grams per mile (g/ mi) and standard deviation 0.3 g/mi. Two randomly selected cars of this type are tested. One has 1.1 g/mi of NOX; the other has 1.9 g/mi. The test station attendant finds this difference in emissions between two similar cars surprising. If the NOX levels for two randomly chosen cars of this type are independent, find the probability that the difference is at least as large as the value the attendant observed. Use this formula µt = = 0 T = C1 - C2 σc = 0.3 g/mi so σ 2 C = (0.3) 2 = 0.09 σ 2 T = σ 2 C + σ 2 C σ 2 T = = 0.18 σ T = 0.18 = or 0.42 g/mi Difference found by attendant is or 0.8 The difference between similar cars should theoretically be 0. What is the probability that the difference is 0.8 or more or -0.8 or less? X: T = -0.8 T = 0.8 z = = P( T > 0.8 ) = P(z < 1.90) z = = P( T < -0.8 ) = P(z < -1.90) P(T > 0.8) + P(T < -0.8) = = The probability that the difference is at least as large as the value the attendant observed is approximately or 5.74% 15

16 Loser buys the pizza Leona and Fred are friendly competitors in high school. Both are about to take the ACT college entrance examination. They agree that if one of them scores 5 or more points better than the other, the loser will buy the winner a pizza. Suppose that in fact Fred and Leona have equal ability, so that each score varies Normally with mean 24 and standard deviation 2. (The variation is due to luck in guessing and the accident of the specific questions being familiar to the student.) The two scores are independent. What is the probability that the scores differ by 5 or more points in either direction? Use this formula F - L > 5 or L - F > 5 (do both ways) µd = = 0 σ D = 2 so σ 2 D = 4 σ 2 T = σ 2 D + σ 2 D σ 2 T = σ T = 8 = 2.83 X: T = -5.0 T = 5.0 z = = P( T < -5 ) = P(z < -1.77) z = = P( T > 5 ) = P(z > 1.77) P(T > 5) + P(T < 5) = = The probability that the difference between their two scores is at least 5 points is approximately or 7.68% Multiple choice: Select the best answer for Exercises 65 and 66, which refer to the following setting. The number of calories in a 1-ounce serving of a certain breakfast cereal is a random variable with mean 110 and standard deviation 10. The number of calories in a cup of whole milk is a random variable with mean 140 and standard deviation 12. For breakfast, you eat 1 ounce of the cereal with 1/2 cup of whole milk. Let T be the random variable that represents the total number of calories in this breakfast. The mean of T is (a) 110. (b) 140. (c) 180. (d) 195. (e) 250. T = 1C + 0.5M µ T = (140) = 180 calories 16
17 Multiple choice: Select the best answer for Exercises 65 and 66, which refer to the following setting. The number of calories in a 1-ounce serving of a certain breakfast cereal is a random variable with mean 110 and standard deviation 10. The number of calories in a cup of whole milk is a random variable with mean 140 and standard deviation 12. For breakfast, you eat 1 ounce of the cereal with 1/2 cup of whole milk. Let T be the random variable that represents the total number of calories in this breakfast. The standard deviation of T is (a) 22. (b) 16. (c) (d) (e) 4. D T = 1C + 0.5M σ C = 10 so σ 2 C = (10) 2 = 100 and σ M = 12 so σ 2 M = (12) 2 = 144 σ 2 T = σ 2 C + (0.5) 2 σ 2 M σ 2 T = (144)= 136 σ T = 136 = calories Dec 7-3:48 PM 17
Honors Statistics. Daily Agenda
 Honors Statistics Aug 23-8:26 PM Daily Agenda 1. Review OTL C6#7 emphasis Normal Distributions Aug 23-8:31 PM 1 1. Multiple choice: Select the best answer for Exercises 65 and 66, which refer to the following
Honors Statistics. 3. Review OTL C6#3. 4. Normal Curve Quiz. Chapter 6 Section 2 Day s Notes.notebook. May 02, 2016.
 Honors Statistics Aug 23-8:26 PM 3. Review OTL C6#3 4. Normal Curve Quiz Aug 23-8:31 PM 1 May 1-9:09 PM Apr 28-10:29 AM 2 27, 28, 29, 30 Nov 21-8:16 PM Working out Choose a person aged 19 to 25 years at
Honors Statistics. Daily Agenda
 Honors Statistics Daily Agenda 1. Review OTL C6#5 2. Quiz Section 6.1 A-Skip 35, 39, 40 Crickets The length in inches of a cricket chosen at random from a field is a random variable X with mean 1.2 inches
Honors Statistics. Daily Agenda
 Honors Statistics Aug 23-8:26 PM Daily Agenda 1. Review OTL C6#4 Chapter 6.2 rules for means and variances Aug 23-8:31 PM 1 Nov 21-8:16 PM Working out Choose a person aged 19 to 25 years at random and
Chapter 6 Section 1 Day s.notebook. April 29, Honors Statistics. Aug 23-8:26 PM. 3. Review OTL C6#2. Aug 23-8:31 PM
 Honors Statistics Aug 23-8:26 PM 3. Review OTL C6#2 Aug 23-8:31 PM 1 Apr 27-9:20 AM Jan 18-2:13 PM 2 Nov 27-10:28 PM 6.1 6.2 6.3 6.4 6.5 6.6 6.7 6.8 6.9 6.10 6.11 6.12 Nov 27-9:53 PM 3 Ask about 1 and
Chapter 6 Section Review day s.notebook. May 11, Honors Statistics. Aug 23-8:26 PM. 3. Review team test.
 Honors Statistics Aug 23-8:26 PM 3. Review team test Aug 23-8:31 PM 1 Nov 27-10:28 PM 6.1 6.2 6.3 6.4 6.5 6.6 6.7 6.8 6.9 6.10 6.11 6.12 Nov 27-9:53 PM 2 May 8-7:44 PM May 1-9:09 PM 3 Dec 1-2:08 PM Sep
Chapter 6: Random Variables
 Chapter 6: Random Variables Section 6. The Practice of Statistics, 4 th edition For AP* STARNES, YATES, MOORE Chapter 6 Random Variables 6.1 Discrete and Continuous Random Variables 6. 6.3 Binomial and
Test 7A AP Statistics Name: Directions: Work on these sheets.
 Test 7A AP Statistics Name: Directions: Work on these sheets. Part 1: Multiple Choice. Circle the letter corresponding to the best answer. 1. Suppose X is a random variable with mean µ. Suppose we observe
*****CENTRAL LIMIT THEOREM (CLT)*****
*****") Sampling Distributions and CLT Day 5 *****CENTRAL LIMIT THEOREM (CLT)***** (One of the MOST important theorems in Statistics - KNOW AND UNDERSTAND THIS!!!!!!) Draw an SRS of size n from ANY population
Sampling Distributions and CLT Day 5 *****CENTRAL LIMIT THEOREM (CLT)***** (One of the MOST important theorems in Statistics - KNOW AND UNDERSTAND THIS!!!!!!) Draw an SRS of size n from ANY population
NORMAL RANDOM VARIABLES (Normal or gaussian distribution)
") NORMAL RANDOM VARIABLES (Normal or gaussian distribution) Many variables, as pregnancy lengths, foot sizes etc.. exhibit a normal distribution. The shape of the distribution is a symmetric bell shape.
NORMAL RANDOM VARIABLES (Normal or gaussian distribution) Many variables, as pregnancy lengths, foot sizes etc.. exhibit a normal distribution. The shape of the distribution is a symmetric bell shape.
Chapter Six Probability Distributions
 6.1 Probability Distributions Discrete Random Variable Chapter Six Probability Distributions x P(x) 2 0.08 4 0.13 6 0.25 8 0.31 10 0.16 12 0.01 Practice. Construct a probability distribution for the number
Section 6.5. The Central Limit Theorem
 Section 6.5 The Central Limit Theorem Idea Will allow us to combine the theory from 6.4 (sampling distribution idea) with our central limit theorem and that will allow us the do hypothesis testing in the
AP Stats ~ Lesson 6B: Transforming and Combining Random variables
 AP Stats ~ Lesson 6B: Transforming and Combining Random variables OBJECTIVES: DESCRIBE the effects of transforming a random variable by adding or subtracting a constant and multiplying or dividing by a
Chapter 6. The Normal Probability Distributions
 Chapter 6 The Normal Probability Distributions 1 Chapter 6 Overview Introduction 6-1 Normal Probability Distributions 6-2 The Standard Normal Distribution 6-3 Applications of the Normal Distribution 6-5
PRINTABLE VERSION. Quiz 6. Suppose that x is normally distributed with a mean of 20 and a standard deviation of 3. What is P(16.91 x 24.59)?
?") PRINTABLE VERSION Quiz 6 Question 1 Suppose that x is normally distributed with a mean of 20 and a standard deviation of 3. What is P(16.91 x 24.59)? a) 0.348 b) 0.438 c) 0.353 d) 0.437 e) 0.785 Question
PRINTABLE VERSION Quiz 6 Question 1 Suppose that x is normally distributed with a mean of 20 and a standard deviation of 3. What is P(16.91 x 24.59)? a) 0.348 b) 0.438 c) 0.353 d) 0.437 e) 0.785 Question
Section 6.2 Transforming and Combining Random Variables. Linear Transformations
 Section 6.2 Transforming and Combining Random Variables Linear Transformations In Section 6.1, we learned that the mean and standard deviation give us important information about a random variable. In
Normal distribution. We say that a random variable X follows the normal distribution if the probability density function of X is given by
 Normal distribution The normal distribution is the most important distribution. It describes well the distribution of random variables that arise in practice, such as the heights or weights of people,
Homework: Due Wed, Nov 3 rd Chapter 8, # 48a, 55c and 56 (count as 1), 67a
, 67a") Homework: Due Wed, Nov 3 rd Chapter 8, # 48a, 55c and 56 (count as 1), 67a Announcements: There are some office hour changes for Nov 5, 8, 9 on website Week 5 quiz begins after class today and ends at
Homework: Due Wed, Nov 3 rd Chapter 8, # 48a, 55c and 56 (count as 1), 67a Announcements: There are some office hour changes for Nov 5, 8, 9 on website Week 5 quiz begins after class today and ends at
Example - Let X be the number of boys in a 4 child family. Find the probability distribution table:
 Chapter8 Probability Distributions and Statistics Section 8.1 Distributions of Random Variables tthe value of the result of the probability experiment is a RANDOM VARIABLE. Example - Let X be the number
STAT 3090 Test 2 - Version B Fall Student s Printed Name: PLEASE READ DIRECTIONS!!!!
 Student s Printed Name: Instructor: XID: Section #: Read each question very carefully. You are permitted to use a calculator on all portions of this exam. You are NOT allowed to use any textbook, notes,
No, because np = 100(0.02) = 2. The value of np must be greater than or equal to 5 to use the normal approximation.
 = 2. The value of np must be greater than or equal to 5 to use the normal approximation.") 1) If n 100 and p 0.02 in a binomial experiment, does this satisfy the rule for a normal approximation? Why or why not? No, because np 100(0.02) 2. The value of np must be greater than or equal to 5 to
1) If n 100 and p 0.02 in a binomial experiment, does this satisfy the rule for a normal approximation? Why or why not? No, because np 100(0.02) 2. The value of np must be greater than or equal to 5 to
Uniform Probability Distribution. Continuous Random Variables &
 Continuous Random Variables & What is a Random Variable? It is a quantity whose values are real numbers and are determined by the number of desired outcomes of an experiment. Is there any special Random
University of California, Los Angeles Department of Statistics. Normal distribution
 University of California, Los Angeles Department of Statistics Statistics 110A Instructor: Nicolas Christou Normal distribution The normal distribution is the most important distribution. It describes
Lecture 9. Probability Distributions. Outline. Outline
 Outline Lecture 9 Probability Distributions 6-1 Introduction 6- Probability Distributions 6-3 Mean, Variance, and Expectation 6-4 The Binomial Distribution Outline 7- Properties of the Normal Distribution
Department of Quantitative Methods & Information Systems. Business Statistics. Chapter 6 Normal Probability Distribution QMIS 120. Dr.
 Department of Quantitative Methods & Information Systems Business Statistics Chapter 6 Normal Probability Distribution QMIS 120 Dr. Mohammad Zainal Chapter Goals After completing this chapter, you should
Homework: Due Wed, Feb 20 th. Chapter 8, # 60a + 62a (count together as 1), 74, 82
, 74, 82") Announcements: Week 5 quiz begins at 4pm today and ends at 3pm on Wed If you take more than 20 minutes to complete your quiz, you will only receive partial credit. (It doesn t cut you off.) Today: Sections
Announcements: Week 5 quiz begins at 4pm today and ends at 3pm on Wed If you take more than 20 minutes to complete your quiz, you will only receive partial credit. (It doesn t cut you off.) Today: Sections
Lecture 9. Probability Distributions
 Lecture 9 Probability Distributions Outline 6-1 Introduction 6-2 Probability Distributions 6-3 Mean, Variance, and Expectation 6-4 The Binomial Distribution Outline 7-2 Properties of the Normal Distribution
The Central Limit Theorem for Sample Means (Averages)
") The Central Limit Theorem for Sample Means (Averages) By: OpenStaxCollege Suppose X is a random variable with a distribution that may be known or unknown (it can be any distribution). Using a subscript
The Central Limit Theorem for Sample Means (Averages) By: OpenStaxCollege Suppose X is a random variable with a distribution that may be known or unknown (it can be any distribution). Using a subscript
6.1 Discrete & Continuous Random Variables. Nov 4 6:53 PM. Objectives
 6.1 Discrete & Continuous Random Variables examples vocab Objectives Today we will... - Compute probabilities using the probability distribution of a discrete random variable. - Calculate and interpret
ECON 214 Elements of Statistics for Economists 2016/2017
 ECON 214 Elements of Statistics for Economists 2016/2017 Topic The Normal Distribution Lecturer: Dr. Bernardin Senadza, Dept. of Economics bsenadza@ug.edu.gh College of Education School of Continuing and
SECTION 6.2 (DAY 1) TRANSFORMING RANDOM VARIABLES NOVEMBER 16 TH, 2017
 TRANSFORMING RANDOM VARIABLES NOVEMBER 16 TH, 2017") SECTION 6.2 (DAY 1) TRANSFORMING RANDOM VARIABLES NOVEMBER 16 TH, 2017 TODAY S OBJECTIVES Describe the effects of transforming a random variable by: adding or subtracting a constant multiplying or dividing
SECTION 6.2 (DAY 1) TRANSFORMING RANDOM VARIABLES NOVEMBER 16 TH, 2017 TODAY S OBJECTIVES Describe the effects of transforming a random variable by: adding or subtracting a constant multiplying or dividing
EXERCISES RANDOM VARIABLES ON THE COMPUTER
 Exercises 383 RANDOM VARIABLES ON THE COMPUTER Statistics packages deal with data, not with random variables. Nevertheless, the calculations needed to find means and standard deviations of random variables
Top Incorrect Problems
 What is the z-score for scores in the bottom 5%? a) -1.645 b) 1.645 c).4801 d) The score is not listed in the table. A professor grades 120 research papers and reports that the average score was an 80%.
ECON 214 Elements of Statistics for Economists
 ECON 214 Elements of Statistics for Economists Session 7 The Normal Distribution Part 1 Lecturer: Dr. Bernardin Senadza, Dept. of Economics Contact Information: bsenadza@ug.edu.gh College of Education
Example. Chapter 8 Probability Distributions and Statistics Section 8.1 Distributions of Random Variables
 Chapter 8 Probability Distributions and Statistics Section 8.1 Distributions of Random Variables You are dealt a hand of 5 cards. Find the probability distribution table for the number of hearts. Graph
Unit 04 Review. Probability Rules
 Unit 04 Review Probability Rules A sample space contains all the possible outcomes observed in a trial of an experiment, a survey, or some random phenomenon. The sum of the probabilities for all possible
I. Standard Error II. Standard Error III. Standard Error 2.54
 1) Original Population: Match the standard error (I, II, or III) with the correct sampling distribution (A, B, or C) and the correct sample size (1, 5, or 10) I. Standard Error 1.03 II. Standard Error
8.2 The Standard Deviation as a Ruler Chapter 8 The Normal and Other Continuous Distributions 8-1
 8.2 The Standard Deviation as a Ruler Chapter 8 The Normal and Other Continuous Distributions For Example: On August 8, 2011, the Dow dropped 634.8 points, sending shock waves through the financial community.
AMS7: WEEK 4. CLASS 3
 AMS7: WEEK 4. CLASS 3 Sampling distributions and estimators. Central Limit Theorem Normal Approximation to the Binomial Distribution Friday April 24th, 2015 Sampling distributions and estimators REMEMBER:
Lecture 6: Normal distribution
 Lecture 6: Normal distribution Statistics 101 Mine Çetinkaya-Rundel February 2, 2012 Announcements Announcements HW 1 due now. Due: OQ 2 by Monday morning 8am. Statistics 101 (Mine Çetinkaya-Rundel) L6:
AP Statistics Section 6.1 Day 1 Multiple Choice Practice. a) a random variable. b) a parameter. c) biased. d) a random sample. e) a statistic.
 a random variable. b) a parameter. c) biased. d) a random sample. e) a statistic.") A Statistics Section 6.1 Day 1 ultiple Choice ractice Name: 1. A variable whose value is a numerical outcome of a random phenomenon is called a) a random variable. b) a parameter. c) biased. d) a random
A Statistics Section 6.1 Day 1 ultiple Choice ractice Name: 1. A variable whose value is a numerical outcome of a random phenomenon is called a) a random variable. b) a parameter. c) biased. d) a random
Econ 250 Fall Due at November 16. Assignment 2: Binomial Distribution, Continuous Random Variables and Sampling
 Econ 250 Fall 2010 Due at November 16 Assignment 2: Binomial Distribution, Continuous Random Variables and Sampling 1. Suppose a firm wishes to raise funds and there are a large number of independent financial
EDCC charges $50 per credit. Let T = tuition charge for a randomly-selected fulltime student. T = 50X. Tuit. T $600 $650 $700 $750 $800 $850 $900
 Chapter 7 Random Variables n 7.1 Discrete and Continuous Random Variables n 6.2 n Example: El Dorado Community College El Dorado Community College considers a student to be full-time if he or she is taking
VII The Normal Distribution
 MATHEMATICS 360-255-LW Quantitative Methods II Martin Huard Winter 2013 1. Find the area under the normal curve a) between z = 0 and z = 1.90 b) between z = -1.75 and z = 0 c) between z = 1.25 and z =
CHAPTER 6 Random Variables
 CHAPTER 6 Random Variables 6.2 Transforming and Combining Random Variables The Practice of Statistics, 5th Edition Starnes, Tabor, Yates, Moore Bedford Freeman Worth Publishers 6.2 Reading Quiz (T or F)
The Central Limit Theorem: Homework
 The Central Limit Theorem: Homework EXERCISE 1 X N(60, 9). Suppose that you form random samples of 25 from this distribution. Let X be the random variable of averages. Let X be the random variable of sums.
Introduction to Business Statistics QM 120 Chapter 6
 DEPARTMENT OF QUANTITATIVE METHODS & INFORMATION SYSTEMS Introduction to Business Statistics QM 120 Chapter 6 Spring 2008 Chapter 6: Continuous Probability Distribution 2 When a RV x is discrete, we can
X = x p(x) 1 / 6 1 / 6 1 / 6 1 / 6 1 / 6 1 / 6. x = 1 x = 2 x = 3 x = 4 x = 5 x = 6 values for the random variable X
 1 / 6 1 / 6 1 / 6 1 / 6 1 / 6 1 / 6. x = 1 x = 2 x = 3 x = 4 x = 5 x = 6 values for the random variable X") Calculus II MAT 146 Integration Applications: Probability Calculating probabilities for discrete cases typically involves comparing the number of ways a chosen event can occur to the number of ways all
Calculus II MAT 146 Integration Applications: Probability Calculating probabilities for discrete cases typically involves comparing the number of ways a chosen event can occur to the number of ways all
Review of commonly missed questions on the online quiz. Lecture 7: Random variables] Expected value and standard deviation. Let s bet...
![Review of commonly missed questions on the online quiz. Lecture 7: Random variables] Expected value and standard deviation. Let s bet...](/thumbs/83/87696499.jpg "Review of commonly missed questions on the online quiz. Lecture 7: Random variables] Expected value and standard deviation. Let s bet...") Recap Review of commonly missed questions on the online quiz Lecture 7: ] Statistics 101 Mine Çetinkaya-Rundel OpenIntro quiz 2: questions 4 and 5 September 20, 2011 Statistics 101 (Mine Çetinkaya-Rundel)
Recap Review of commonly missed questions on the online quiz Lecture 7: ] Statistics 101 Mine Çetinkaya-Rundel OpenIntro quiz 2: questions 4 and 5 September 20, 2011 Statistics 101 (Mine Çetinkaya-Rundel)
and µ Asian male > " men
 A.P. Statistics Sampling Distributions and the Central Limit Theorem Definitions A parameter is a number that describes the population. A parameter always exists but in practice we rarely know its value
Math 14, Homework 6.2 p. 337 # 3, 4, 9, 10, 15, 18, 19, 21, 22 Name
 Name 3. Population in U.S. Jails The average daily jail population in the United States is 706,242. If the distribution is normal and the standard deviation is 52,145, find the probability that on a randomly
MULTIPLE CHOICE. Choose the one alternative that best completes the statement or answers the question.
 Exam Name The bar graph shows the number of tickets sold each week by the garden club for their annual flower show. ) During which week was the most number of tickets sold? ) A) Week B) Week C) Week 5
STAT 201 Chapter 6. Distribution
 STAT 201 Chapter 6 Distribution 1 Random Variable We know variable Random Variable: a numerical measurement of the outcome of a random phenomena Capital letter refer to the random variable Lower case letters
6.2.1 Linear Transformations
 6.2.1 Linear Transformations In Chapter 2, we studied the effects of transformations on the shape, center, and spread of a distribution of data. Recall what we discovered: 1. Adding (or subtracting) a
Chapter 6 Statistics Extra Practice Exercises
 6.1 Statistics For each situation construct a histogram and use it to answer the question. (For Exercises 1 5, histograms may vary.) 1. Blue Book Values A random sample of thirty-two cars parked at Emmett
8.1 Estimation of the Mean and Proportion
 8.1 Estimation of the Mean and Proportion Statistical inference enables us to make judgments about a population on the basis of sample information. The mean, standard deviation, and proportions of a population
CHAPTER 6 Random Variables
 CHAPTER 6 Random Variables 6.1 Discrete and Continuous Random Variables The Practice of Statistics, 5th Edition Starnes, Tabor, Yates, Moore Bedford Freeman Worth Publishers Discrete and Continuous Random
STATISTICS - CLUTCH CH.9: SAMPLING DISTRIBUTIONS: MEAN.
 !! www.clutchprep.com SAMPLING DISTRIBUTIONS (MEANS) As of now, the normal distributions we have worked with only deal with the population of observations Example: What is the probability of randomly selecting
Central Limit Theorem: Homework
 Connexions module: m16952 1 Central Limit Theorem: Homework Susan Dean Barbara Illowsky, Ph.D. This work is produced by The Connexions Project and licensed under the Creative Commons Attribution License
The Binomial Probability Distribution
 The Binomial Probability Distribution MATH 130, Elements of Statistics I J. Robert Buchanan Department of Mathematics Fall 2017 Objectives After this lesson we will be able to: determine whether a probability
STT 315 Practice Problems Chapter 3.7 and 4
 STT 315 Practice Problems Chapter 3.7 and 4 Answer the question True or False. 1) The number of children in a family can be modelled using a continuous random variable. 2) For any continuous probability
The Central Limit Theorem: Homework
 The Central Limit Theorem: Homework EXERCISE 1 X N(60, 9). Suppose that you form random samples of 25 from this distribution. Let X be the random variable of averages. Let X be the random variable of sums.
(j) Find the first quartile for a standard normal distribution.
 Find the first quartile for a standard normal distribution.") Examples for Chapter 5 Normal Probability Distributions Math 1040 1 Section 5.1 1. Heights of males at a certain university are approximately normal with a mean of 70.9 inches and a standard deviation
Examples for Chapter 5 Normal Probability Distributions Math 1040 1 Section 5.1 1. Heights of males at a certain university are approximately normal with a mean of 70.9 inches and a standard deviation
The Central Limit Theorem. Sec. 8.2: The Random Variable. it s Distribution. it s Distribution
 The Central Limit Theorem Sec. 8.1: The Random Variable it s Distribution Sec. 8.2: The Random Variable it s Distribution X p and and How Should You Think of a Random Variable? Imagine a bag with numbers
The Binomial Distribution
 The Binomial Distribution Properties of a Binomial Experiment 1. It consists of a fixed number of observations called trials. 2. Each trial can result in one of only two mutually exclusive outcomes labeled
Probability and Probability Distributions Problems
 Probability and Probability Distributions Problems Q.1. Among male birds of a species, 20% have a particular gene. Among females of the species, 10% have the gene. The males comprise 40% of all the birds
Chapter 6: Random Variables
 Chapter 6: Random Variables Section 6.2 The Practice of Statistics, 4 th edition For AP* STARNES, YATES, MOORE Chapter 6 Random Variables 6.1 Discrete and Continuous Random Variables 6.2 6.3 Binomial and
Exam 1 Review. 1) Identify the population being studied. The heights of 14 out of the 31 cucumber plants at Mr. Lonardo's greenhouse.
 Identify the population being studied. The heights of 14 out of the 31 cucumber plants at Mr. Lonardo's greenhouse.") Exam 1 Review 1) Identify the population being studied. The heights of 14 out of the 31 cucumber plants at Mr. Lonardo's greenhouse. 2) Identify the population being studied and the sample chosen. The
Exam 1 Review 1) Identify the population being studied. The heights of 14 out of the 31 cucumber plants at Mr. Lonardo's greenhouse. 2) Identify the population being studied and the sample chosen. The
Example - Let X be the number of boys in a 4 child family. Find the probability distribution table:
 Chapter7 Probability Distributions and Statistics Distributions of Random Variables tthe value of the result of the probability experiment is a RANDOM VARIABLE. Example - Let X be the number of boys in
Chapter 6: Random Variables
 Chapter 6: Random Variables Section 6.2 The Practice of Statistics, 4 th edition For AP* STARNES, YATES, MOORE Chapter 6 Random Variables 6.1 Discrete and Continuous Random Variables 6.2 6.3 Binomial and
Exercise Set 1 The normal distribution and sampling distributions
 Eercise Set 1 The normal distribution and sampling distributions 1). An orange juice producer buys all his oranges from a large orange grove. The amount of juice squeezed from each of these oranges is
The Uniform Distribution
 The Uniform Distribution EXAMPLE 1 The previous problem is an example of the uniform probability distribution. Illustrate the uniform distribution. The data that follows are 55 smiling times, in seconds,
STAT 3090 Test 2 - Version B Fall Student s Printed Name: PLEASE READ DIRECTIONS!!!!
 STAT 3090 Test 2 - Fall 2015 Student s Printed Name: Instructor: XID: Section #: Read each question very carefully. You are permitted to use a calculator on all portions of this exam. You are NOT allowed
Chapter 7 Study Guide: The Central Limit Theorem
 Chapter 7 Study Guide: The Central Limit Theorem Introduction Why are we so concerned with means? Two reasons are that they give us a middle ground for comparison and they are easy to calculate. In this
The Central Limit Theorem
 Section 6-5 The Central Limit Theorem I. Sampling Distribution of Sample Mean ( ) Eample 1: Population Distribution Table 2 4 6 8 P() 1/4 1/4 1/4 1/4 μ (a) Find the population mean and population standard
The Central Limit Theorem: Homework
 EERCISE 1 The Central Limit Theorem: Homework N(60, 9). Suppose that you form random samples of 25 from this distribution. Let be the random variable of averages. Let be the random variable of sums. For
Normal Model (Part 1)
") Normal Model (Part 1) Formulas New Vocabulary The Standard Deviation as a Ruler The trick in comparing very different-looking values is to use standard deviations as our rulers. The standard deviation
Normal Model (Part 1) Formulas New Vocabulary The Standard Deviation as a Ruler The trick in comparing very different-looking values is to use standard deviations as our rulers. The standard deviation
Part 1 In which we meet the law of averages. The Law of Averages. The Expected Value & The Standard Error. Where Are We Going?
 1 The Law of Averages The Expected Value & The Standard Error Where Are We Going? Sums of random numbers The law of averages Box models for generating random numbers Sums of draws: the Expected Value Standard
STAT 1220 FALL 2010 Common Final Exam December 10, 2010
 STAT 1220 FALL 2010 Common Final Exam December 10, 2010 PLEASE PRINT THE FOLLOWING INFORMATION: Name: Instructor: Student ID #: Section/Time: THIS EXAM HAS TWO PARTS. PART I. Part I consists of 30 multiple
Chapter 6: Random Variables
 Chapter 6: Random Variables Section 6.1 Discrete and Continuous Random Variables The Practice of Statistics, 4 th edition For AP* STARNES, YATES, MOORE Chapter 6 Random Variables 6.1 Discrete and Continuous
STUDY SET 2. Continuous Probability Distributions. ANSWER: Without continuity correction P(X>10) = P(Z>-0.66) =
 = P(Z>-0.66) =") STUDY SET 2 Continuous Probability Distributions 1. The normal distribution is used to approximate the binomial under certain conditions. What is the best way to approximate the binomial using the normal?
STUDY SET 2 Continuous Probability Distributions 1. The normal distribution is used to approximate the binomial under certain conditions. What is the best way to approximate the binomial using the normal?
A probability distribution shows the possible outcomes of an experiment and the probability of each of these outcomes.
 Introduction In the previous chapter we discussed the basic concepts of probability and described how the rules of addition and multiplication were used to compute probabilities. In this chapter we expand
A continuous random variable is one that can theoretically take on any value on some line interval. We use f ( x)
") Section 6-2 I. Continuous Probability Distributions A continuous random variable is one that can theoretically take on any value on some line interval. We use f ( x) to represent a probability density
Section 6-2 I. Continuous Probability Distributions A continuous random variable is one that can theoretically take on any value on some line interval. We use f ( x) to represent a probability density
Confidence Intervals for the Mean. When σ is known
 Confidence Intervals for the Mean When σ is known Objective Find the confidence interval for the mean when s is known. Intro Suppose a college president wishes to estimate the average age of students attending
Chapter 7 Sampling Distributions and Point Estimation of Parameters
 Chapter 7 Sampling Distributions and Point Estimation of Parameters Part 1: Sampling Distributions, the Central Limit Theorem, Point Estimation & Estimators Sections 7-1 to 7-2 1 / 25 Statistical Inferences
Exercise Questions. Q7. The random variable X is known to be uniformly distributed between 10 and
 Exercise Questions This exercise set only covers some topics discussed after the midterm. It does not mean that the problems in the final will be similar to these. Neither solutions nor answers will be
Section 7.4 Transforming and Combining Random Variables (DAY 1)
") Section 7.4 Learning Objectives (DAY 1) After this section, you should be able to DESCRIBE the effect of performing a linear transformation on a random variable (DAY 1) COMBINE random variables and CALCULATE
Section 7.4 Learning Objectives (DAY 1) After this section, you should be able to DESCRIBE the effect of performing a linear transformation on a random variable (DAY 1) COMBINE random variables and CALCULATE
Math 14, Homework 7.1 p. 379 # 7, 9, 18, 20, 21, 23, 25, 26 Name
 7.1 p. 379 # 7, 9, 18, 0, 1, 3, 5, 6 Name 7. Find each. (a) z α Step 1 Step Shade the desired percent under the mean statistics calculator to 99% confidence interval 3 1 0 1 3 µ 3σ µ σ µ σ µ µ+σ µ+σ µ+3σ
Section 7.5 The Normal Distribution. Section 7.6 Application of the Normal Distribution
 Section 7.6 Application of the Normal Distribution A random variable that may take on infinitely many values is called a continuous random variable. A continuous probability distribution is defined by
8.1 Binomial Distributions
 8.1 Binomial Distributions The Binomial Setting The 4 Conditions of a Binomial Setting: 1.Each observation falls into 1 of 2 categories ( success or fail ) 2 2.There is a fixed # n of observations. 3.All
Chapter 4 Discrete Random variables
 Chapter 4 Discrete Random variables A is a variable that assumes numerical values associated with the random outcomes of an experiment, where only one numerical value is assigned to each sample point.
AP * Statistics Review
 AP * Statistics Review Normal Models and Sampling Distributions Teacher Packet AP* is a trademark of the College Entrance Examination Board. The College Entrance Examination Board was not involved in the
Chapter Seven. The Normal Distribution
 Chapter Seven The Normal Distribution 7-1 Introduction Many continuous variables have distributions that are bellshaped and are called approximately normally distributed variables, such as the heights
Discrete Probability Distributions
 Discrete Probability Distributions Chapter 6 Learning Objectives Define terms random variable and probability distribution. Distinguish between discrete and continuous probability distributions. Calculate
CHAPTER 8. Confidence Interval Estimation Point and Interval Estimates
 CHAPTER 8. Confidence Interval Estimation Point and Interval Estimates A point estimate is a single number, a confidence interval provides additional information about the variability of the estimate Lower
The Uniform Distribution
 Connexions module: m46972 The Uniform Distribution OpenStax College This work is produced by The Connexions Project and licensed under the Creative Commons Attribution License 3.0 The uniform distribution
Lecture 7 Random Variables
 Lecture 7 Random Variables Definition: A random variable is a variable whose value is a numerical outcome of a random phenomenon, so its values are determined by chance. We shall use letters such as X
CHAPTER 6 Random Variables
 CHAPTER 6 Random Variables 6.2 Transforming and Combining Random Variables The Practice of Statistics, 5th Edition Starnes, Tabor, Yates, Moore Bedford Freeman Worth Publishers Transforming and Combining
Activity #17b: Central Limit Theorem #2. 1) Explain the Central Limit Theorem in your own words.
 Explain the Central Limit Theorem in your own words.") Activity #17b: Central Limit Theorem #2 1) Explain the Central Limit Theorem in your own words. Importance of the CLT: You can standardize and use normal distribution tables to calculate probabilities
Activity #17b: Central Limit Theorem #2 1) Explain the Central Limit Theorem in your own words. Importance of the CLT: You can standardize and use normal distribution tables to calculate probabilities
As you draw random samples of size n, as n increases, the sample means tend to be normally distributed.
 The Central Limit Theorem The central limit theorem (clt for short) is one of the most powerful and useful ideas in all of statistics. The clt says that if we collect samples of size n with a "large enough