Chapter 6 Section 1 Day s.notebook. April 29, Honors Statistics. Aug 23-8:26 PM. 3. Review OTL C6#2. Aug 23-8:31 PM
|
|
|
- Valentine Parker
- 6 years ago
- Views:
Transcription


1 Honors Statistics Aug 23-8:26 PM 3. Review OTL C6#2 Aug 23-8:31 PM 1

2 Apr 27-9:20 AM Jan 18-2:13 PM 2

3 Nov 27-10:28 PM Nov 27-9:53 PM 3

 Find the probability")
 Find P(X 3) and interpret the result. 0 1 2 3 4 Number of heads 15 P( X 3) = + + + = = 0.")
4 Ask about 1 and 5 Write a program to generate random numbers. I've decided to give them free will. A Skip 4, 12, 16 Apr 25-10:55 AM Toss 4 times Suppose you toss a fair coin 4 times. Let X = the number of heads you get. First List the Sample Space... HHHH THHH HHHT THHT HHTH THTH HHTT THTT HTHH TTHH HTHT TTHT HTTH TTTH HTTT TTTT (a) Find the probability distribution of X. (b) Make a histogram of the probability distribution. Describe what you see. 0.5 frequency (c) Find P(X 3) and interpret the result Number of heads 15 P( X 3) = = = The probability that 4 tosses of a coin results in 3 or fewer heads is Nov 28-12:03 AM 4
 Write the event plays with at most two toys in")
 = 0.17 + 0.11 = 0.28 > What is the probability that X 3? P(X 3) = 0.28 + 0.23 = 0.51 Nov 28-12:08 AM Kids and toys Refer to Exercise 4.")
5 Kids and toys In an experiment on the behavior of young children, each subject is placed in an area with five toys. Past experiments have shown that the probability distribution of the number X of toys played with by a randomly selected subject is as follows: > (a) Write the event plays with at most two toys in terms of X. > What is the probability of this event? P(x 2) = = 0.49 > (b) Describe the event X > 3 in words. > The probability that the young child plays with more than 3 toys. > What is its probability? P(X > 3) = = 0.28 > What is the probability that X 3? P(X 3) = = 0.51 Nov 28-12:08 AM Kids and toys Refer to Exercise 4. Calculate the mean of the random variable X and interpret this result in context. µ x = 0(0.03) + 1(0.16) + 2(0.30) + 3(0.23) + 4(0.17) + 5(0.11) = 2.68 If many, many children participated in this experiment, the mean number of toys that randomly selected children would play with will average 2.68 toys. (The expected number of toys a randomly selected young child will play with is 2.68.) This statement is optional. Nov 28-12:16 AM 5
 2 (0.23) + (4-2.68) 2 (0.17) + (5-2.68) 2 (0.11) = 1.7176 σ x = 1.7176 = 1.31057 The standard deviation of X is σ x = 1.")


6 Kids and toys Refer to Exercise 4. Calculate and interpret the standard deviation of the random variable X. Show your work. σ 2 x = (0-2.68) 2 (0.03) + (1-2.68) 2 (0.16) + (2-2.68) 2 (0.30) + (3-2.68) 2 (0.23) + (4-2.68) 2 (0.17) + (5-2.68) 2 (0.11) = σ x = = The standard deviation of X is σ x = The number of toys a randomly selected young child will play with will typically differ from the mean (2.68) by about 1.31 toys. Nov 28-12:22 AM Benford s law Faked numbers in tax returns, invoices, or expense account claims often display patterns that aren t present in legitimate records. Some patterns, like too many round numbers, are obvious and easily avoided by a clever crook. Others are more subtle. It is a striking fact that the first digits of numbers in legitimate records often follow a model known as Benford s law. 7 Call the first digit of a randomly chosen record X for short. Benford s law gives this probability model for X (note that a first digit can t be 0): (a) Show that this is a legitimate probability distribution. all individual probabilities are between 0 and = 1 (b) Make a histogram of the probability distribution. Describe what you see. See histogram above. The distribution is NOT symmetric. It is skewed to the right. The data should be analyzed using the 5 number summary. (c) Describe the event X 6 in words. What is P(X 6)? What is the probability that the first digit in a legitimate legal document is 6 or greater? P(X 6) = = (d) Express the event first digit is at most 5 in terms of X. What is the probability of this event? P(X < 6) = 1 - P(X 6) = = Nov 14-5:53 PM 6
 What outcomes make up the event A? What is P(A)? P(X 7) = 0.058 + 0.051 + 0.046 = 0.155 (b) What outcomes make up the event B? What is P(B)? P(X is odd) = 0.301 + 0.125 + 0.079 + 0.058 + 0.046 = 0.609 (c) What outcomes make up the event A or B?")
 Nov 28-12:14 AM Benford s law and fraud A")
7 Benford s law Refer to Exercise 5. The first digit of a randomly chosen expense account claim follows Benford s law. Consider the events A = first digit is 7 or greater and B = first digit is odd. (a) What outcomes make up the event A? What is P(A)? P(X 7) = = (b) What outcomes make up the event B? What is P(B)? P(X is odd) = = (c) What outcomes make up the event A or B? What is P(A or B)? Why is this probability not equal to P(A) + P(B)? P(X 7 or X is odd) = ( ) = 0.66 Both 7 and 9 are included in each event and must their sum must be subtracted because they were counted twice ( the general probability addition rule) Nov 28-12:14 AM Benford s law and fraud A not-so-clever employee decided to fake his monthly expense report. He believed that the first digits of his expense amounts should be equally likely to be any of the numbers from 1 to 9. In that case, the first digit Y of a randomly selected expense amount would have the probability distribution shown in the histogram. > (a) Explain why the mean of the random variable Y is located at the solid red line in the figure. The mean is the balance point of the distribution. So it is located in the center of a uniform or symmetric distribution histogram in this case at 5. > (b) The first digits of randomly selected expense amounts actually follow Benford s law (Exercise 5). According to Benford s law, what s the expected value of the first digit? Explain how this information could be used to detect a fake expense report. µx = 1(0.301) + 2(0.176) + 3(0.125) + 4(0.097) + 5(0.079) + 6(0.067) + 7(0.058) + 8(0.051) + 9(0.046) = To detect a fake expense report, compute the sample mean of the first digits of the numbers on the report. A value closer to suggests a truthful report but a value closer to 5 (the more uniform distribution) suggest a false report. > (c) What s P(Y > 6) in the above distribution? According to Benford s law, what proportion of first digits in the employee s expense amounts should be greater than 6? How could this information be used to detect a fake expense report? P(Y > 6) = = For a uniform distribution the P(Y > 6) = 0.3 To detect a fake expense report, compute the percent of the first digits that are greater than 6 on the report. A value closer to suggests a truthful report but a value closer to 0.3 (the more uniform distribution) suggest a false report. Nov 28-12:18 AM 7
 Calculate the standard deviation σy. This gives us an idea of how much variation we d expect in the employee s expense records if he assumed that first digits from 1 to 9 were equally likely.")
8 Benford s law and fraud Refer to Exercise 13. It might also be possible to detect an employee s fake expense records by looking at the variability in the first digits of those expense amounts. > (a) Calculate the standard deviation σy. This gives us an idea of how much variation we d expect in the employee s expense records if he assumed that first digits from 1 to 9 were equally likely. σ 2 x = (1-5) 2 (0.10) + (2-5) 2 (0.10) + (3-5) 2 (0.10) + (4-5) 2 (0.10) + (5-5) 2 (0.10) + (6-5) 2 (0.10) + (7-5) 2 (0.10) + (8-5) 2 (0.10) + (9-5) 2 (0.10) = 6.66 σ x = 6.66 = 2.58 > (b) Now calculate the standard deviation of first digits that follow Benford s law (Exercise 5). Would using standard deviations be a good way to detect fraud? Explain. σ 2 x = (1-3.44) 2 (0.301) + (2-3.44) 2 (0.176) + (3-3.44) 2 (0.125) + (4-3.44) 2 (0.097) + (5-3.44) 2 (0.079) + (6-3.44) 2 (0.067) + (7-3.44) 2 (0.058) + (8-3.44) 2 (0.051) + (9-3.44) 2 (0.046) = σ x = = 2.42 Because the standard deviations are so close 2.58 and 2.42 it would be difficult to determine fake reports from legitimate reports using the standard deviation. Nov 28-12:22 AM Pair-a-dice Suppose you roll a pair of fair, six-sided dice. Let T= the sum of the spots showing on the up-faces. (a) Find the probability distribution of T. Probability model for the sum of two fair dice (b) Make a histogram of the probability distribution. Describe what you see (c) Find P(T 5) and interpret the result. (d) Find the expected value of the distribution. Interpret this value in context. Nov 27-10:56 PM 8
 Make a histogram of the probability distribution. Describe what you see. frequency of sum 0.16 0.12 0.08 0.")
 Find the expected value of the distribution. Interpret this value in context.")
9 Pair-a-dice Suppose you roll a pair of fair, six-sided dice. Let T= the sum of the spots showing on the up-faces. (a) Find the probability distribution of T. Probability model for the sum of two fair dice (b) Make a histogram of the probability distribution. Describe what you see. frequency of sum sum of dice (c) Find P(T 5) and interpret the result P(T 5) = 1 - P(T < 5) = 1 - ( + + ) = 1 - = = The probability that a random roll of dice will add to more than 5 is or 83.3% (d) Find the expected value of the distribution. Interpret this value in context µt = 2( ) + 3( ) + 4( ) + 5( ) + 6( ) + 7( ) ( ) + 9( ) + 10( ) + 11( ) + 12( ) = = If a pair of fair dice are rolled many, many times and the sum of the dots is calculated the sum will average a total of 7. The expected sum of a pair of randomly rolled dice is 7. Nov 27-10:56 PM You choose a 3 digit number. The lottery commission announces the The "box" pays $83.33 if the number you choose has the same digits as on the box. (Assume a number with three different digits is chosen) let X = Dec 5-1:10 PM 9


10 Nov 27-10:38 PM Nov 27-10:40 PM 10


11 Nov 28-9:29 PM Area above the x axis Nov 21-11:55 AM 11

12 Dec 2-3:01 PM Dec 2-7:34 PM 12
13 The probability distribution for a continuous random variable assigns probabilities to intervals of outcomes rather than to individual outcomes. In fact, all continuous probability models assign probability 0 to every individual outcome. Only intervals of values have positive probability. To see that this is true, consider a specific outcome from the random number generator of the previous example, such as P(Y = 0.7). The probability of this event is the area under the density curve that s above the point on the horizontal axis.but this vertical line segment has no width, so the area is 0. For that reason, P(0.3 Y 0.7) = P(0.3 Y < 0.7) = P(0.3 < Y < 0.7) = 0.4 CAUT ION ALL continuous probability models assign probability 0 to every individual outcome. P(x=3) = 0 In many cases, discrete random variables arise from counting something for instance, the number of siblings that a randomly selected student has. Continuous random variables often arise from measuring something for instance, the height or time to run a mile for a randomly selected student. Nov 28-9:33 PM Apr 27-11:47 AM 13


14 b) P(X HOMEWORK PROBLEM d) What important fact about continuous random variables does comparing Nov 21-11:51 AM Dec 1-2:08 PM 14


15 Sep 26-6:57 PM Sep 26-6:58 PM 15


16 Sep 27-1:27 PM Nov 28-9:30 PM 16


17 Nov 28-9:30 PM Dec 2-9:51 PM 17


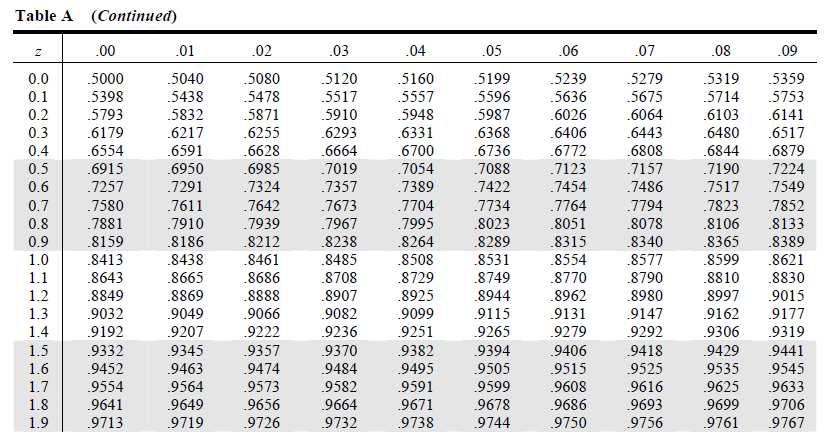
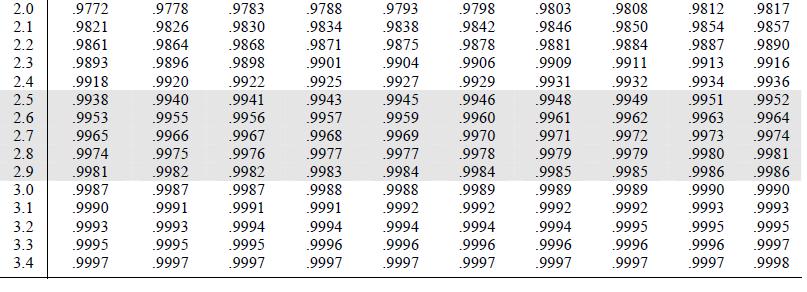
18 CLASS EXAMPLE Weights of 3-year-old females The weights of 3-year-old females closely follow a Normal Distribution with a mean of µ = 30.7 pounds and a standard deviation of σ = 3.6 pounds. Randomly choose one 3-year-old female and call her weight X. What is the probability that a randomly selected 3-year-old female weights at least 30 pounds? What is the probability that a randomly selected 3-year-old female weights between 28 and 33 pounds? Dec 2-3:52 PM Nov 28-9:30 PM 18


19 Discuss with students to guide them when doing #20 in the homework assignment Apr 27-9:24 AM Owned Units: The histogram of owned housing units is symmetric. It is Nov 21-12:26 PM 19

20 Nov 21-12:26 PM Nov 21-12:26 PM 20
21 May 7-8:36 AM 7.5 x = the number of rooms in a randomly chosen Dec 2-1:07 PM 21


 Describe the event Y < 7 in words. What is P(Y < 7)?")
 = 1 - P(Y = 7) = 1-0.02 = 0.")
22 Working out Choose a person aged 19 to 25 years at random and ask, In the past seven days, how many times did you go to an exercise or fitness center or work out? Call the responsey for short. Based on a large sample survey, here is a probability model for the answer you will get: 8 (a) Show that this is a legitimate probability distribution = 1 (b) Make a histogram of the probability distribution. Describe what you see. frequency (c) Describe the event Y < 7 in words. What is P(Y < 7)? Number of workout days What is the probability that a randomly selected person aged 19 to 25 went to the gym less than seven days this week? P(Y < 7) = 1 - P(Y = 7) = = 0.98 (d) Express the event worked out at least once in terms of Y. What is the probability of this event? P(Y 1) = 1 - P(Y = 0) = = 0.32 Nov 29-10:57 AM 27, 28, 29, 30 Nov 21-8:16 PM 22
? outcomes = 1,2,3,4,5,6,7 P(Y 1) = 1 - P(Y = 0) = 1-0.68 = 0.32 (b) What outcomes make up the event B? What is P(B)? outcomes = 0,1,2,3,4 P(Y < 5) = 0.68 + 0.")
 Nov 29-11:00 AM Keno Keno is a favorite game in casinos, and similar games are popular with")

 + 2(0.25) = -0.25 Nov 29-11:02 AM 23")
23 Working out Refer to Exercise 6. Consider the events A = works out at least once and B = works out less than 5 times per week. (a) What outcomes make up the event A? What is P(A)? outcomes = 1,2,3,4,5,6,7 P(Y 1) = 1 - P(Y = 0) = = 0.32 (b) What outcomes make up the event B? What is P(B)? outcomes = 0,1,2,3,4 P(Y < 5) = = 0.93 (c) What outcomes make up the event A and B? What isp(a and B)? Why is this probability not equal to P(A) P(B)? P(A and B) = = 0.25 The events working out at least once and working out less than 5 times per week are not INDEPENDENT events. So Multiplication cannot be used to determine the probability of P(A and B) Nov 29-11:00 AM Keno Keno is a favorite game in casinos, and similar games are popular with the states that operate lotteries. Balls numbered 1 to 80 are tumbled in a machine as the bets are placed, then 20 of the balls are chosen at random. Players select numbers by marking a card. The simplest of the many wagers available is Mark 1 Number. Your payoff is $3 on a $1 bet if the number you select is one of those chosen. Because 20 of 80 numbers are chosen, your probability of winning is 20/80, or Let X= the net amount you gain on a single play of the game. OR Based on what you "get" back OR µ x = -1(0.75) + 2(0.25) = Nov 29-11:02 AM 23

24 Size of American households In government data, a household consists of all occupants of a dwelling unit, while a family consists of two or more persons who live together and are related by blood or marriage. So all families form households, but some households are not families. Here are the distributions of household size and family size in the United States: Legitimate Distributions... Let X = the number of people in a randomly selected U.S. household and Y = the number of people in a randomly chosen U.S. family. (a) Make histograms suitable for comparing the probability distributions of X and Y. Describe any differences that you observe. Dec 5-5:48 PM ` > (b) Find the mean for each random variable. Explain why this difference makes sense. µ x = 1(0.25) + 2(0.32) + 3(0.17) + 4(0.15) + 5(0.07) + 6(0.03) + 7(0.01) = 2.6 If many, many random households were selected, they would on average have 2.6 people dwelling in them. µ y = 1(0.0) + 2(0.42) + 3(0.23) + 4(0.21) + 5(0.09) + 6(0.03) + 7(0.02) = 3.14 If many, many random families were selected, they would on average have 3.14 people in the family. > (c) Find and interpret the standard deviations of both Xand Y. Nov 21-10:40 PM 24
25 > (c) Find and interpret the standard deviations of both X and Y. σ 2 x = (1-2.6) 2 (0.25) + (2-2.6) 2 (0.32) + (3-2.6) 2 (0.17) + (4-2.6) 2 (0.15) + (5-2.6) 2 (0.07) + (6-2.6) 2 (0.03) (7-2.6) 2 (0.01) = 2.02 σ x = 2.02 = The standard deviation of X is σ x = The number of people in a randomly selected household will typically differ from the mean (2.6) by about people. σ 2 y = (1-3.14) 2 (0.0) + (2-3.14) 2 (0.42) + (3-3.14) 2 (0.23) + (4-3.14) 2 (0.21) + (5-3.14) 2 (0.09) + (6-3.14) 2 (0.03) (7-3.14) 2 (0.02) = σ x = = The standard deviation of X is σ y = A the number of people in a randomly selected family will typically differ from the mean (3.14) by about people. Dec 4-7:00 AM THIS IS ON THE CLASS WORKSHEET! Random numbers Let Y be a number between 0 and 1 produced by a random number generator. Assuming that the random variable Y has a uniform distribution, find the following probabilities: HOMEWORK PROBLEM #22 Random numbers a) P(Y 0.4) = (0.4)(1) = 0.40 b) P(Y < 0.4) = (0.4)(1) = 0.40 c) P(0.1 < Y 0.15 or 0.77 Y < 0.88) = (0.05)(1) + (0.11)(1) = 0.16 d) What important fact about continuous random variables does comparing your answer to a and b illustrate? The area of a line segment (Y = 0.4) is equal to zero Nov 29-11:16 AM 25
 and interpret the result. N(7.11, 0.")

 (a) Find P(Y > 120) and interpret the result. 0.2033 This interprets (in the context of this problem).")
26 Running a mile A study of 12,000 able-bodied male students at the University of Illinois found that their times for the mile run were approximately Normal with mean 7.11 minutes and standard deviation 0.74 minute. 10 Choose a student at random from this group and call his time for the mile Y. Find P(Y < 6) and interpret the result. N(7.11, 0.74) This interprets (in the context of this problem)... The probability of randomly choosing a random student who can run the mile in less than 6 minutes is approximately 6.68% or 6.7 out of 100. Nov 29-11:19 AM Ace! Professional tennis player Rafael Nadal hits the ball extremely hard. His first-serve speeds follow a Normal distribution with mean 115 miles per hour (mph) and standard deviation 6 mph. Choose one of Nadal s first serves at random. Let Y = its speed, measured in miles per hour. N(115,6) (a) Find P(Y > 120) and interpret the result This interprets (in the context of this problem)... The probability of randomly choosing one of Nadal's first serves that is faster than 120 mph is approximately 20.33% or 20 out of 100. (b) What is P(Y 120)? Explain. The answer is equal to P(Y > 120) Because the P(Y = 120) is zero. Nov 29-11:21 AM 26
... The probability of randomly choosing one of Nadal's first serves that is slower than 108.")

 What is P(X > 240)? Explain. 1-0.0516 0.9484 This interprets (in the context of this problem).")
27 (c) Find the value of c such that P(Y c) = Show your work c =? z = c = -1.04(6) c = This interprets (in the context of this problem)... The probability of randomly choosing one of Nadal's first serves that is slower than mph is approximately 15% or 15 out of 100. Dec 1-9:51 PM Pregnancy length The length of human pregnancies from conception to birth follows a Normal distribution with mean 266 days and standard deviation 16 days. Choose a pregnant woman at random. Let X = the length of her pregnancy. N(266, 16) x = 240 (a) Find P(X 240) and interpret the result. (b) What is P(X > 240)? Explain This interprets (in the context of this problem)... The probability of randomly choosing one pregnant lady that carries her baby at least 240 days is approximately 94.84% or 95 out of 100 pregnant women. The answer is equal to P(X > 240) Because the P(X = 240) is zero. Dec 4-7:12 AM 27
28 (c) Find the value of c such that P(X c) = Show your work. N(266, 16) Look up 0.80 so this side is c =? z = 0.?? c = 0.84(16) c = This interprets (in the context of this problem)... The probability of randomly choosing one pregnant lady that carries her baby at least days is approximately 20% or 20 out of 100 pregnant women. Dec 4-7:12 AM Multiple choice: Select the best answer for Exercises 27 to 30. Exercises 27 to 29 refer to the following setting. Choose an American household at random and let the random variable X be the number of cars (including SUVs and light trucks) they own. Here is the probability model if we ignore the few households that own more than 5 cars: What s the expected number of cars in a randomly selected American household? (a) 1.00 (b) 1.75 (c) 1.84 (d) 2.00 (e) 2.50 µ x = 0(0.09) + 1(0.36) + 2(0.35) + 3(0.13) + 4(0.05) + 5(0.02) = 1.75 Dec 4-7:12 AM 28

 The number of cars would be at most 1.08 from the mean. (d) The number of cars would be within 1.")

 68% (b) 71% (c) 93% (d) 95% (e) 98% C we know the following... µ x = 1.75 σ x = 1.")
 = 3.91 mean - 2 St. Dev. = 1.75-2(1.08) = -0.41 between 0 and 3.")
29 The standard deviation of X is σ X = If many households were selected at random, which of the following would be the best interpretation of the value 1.08? (a) The mean number of cars would be about (b) The number of cars would typically be about 1.08 from the mean. (c) The number of cars would be at most 1.08 from the mean. (d) The number of cars would be within 1.08 from the mean about 68% of the time. (e) The mean number of cars would be about 1.08 from the expected value. Dec 4-7:12 AM About what percentage of households have a number of cars within 2 standard deviations of the mean? (a) 68% (b) 71% (c) 93% (d) 95% (e) 98% C we know the following... µ x = 1.75 σ x = 1.08 but it is not stated that the distribution is approximately NORMAL so use the table above... mean + 2 St. Dev. = (1.08) = 3.91 mean - 2 St. Dev. = (1.08) = between 0 and 3.91 cars (must use 3) = 0.93 What is the probability that they have more than 5 cars????? Dec 4-11:45 AM 29
 vocabulary scores of seventh-grade students in Gary, Indiana.")
.")
30 ITBS scores The Normal distribution with mean µ = 6.8 and standard deviation σ = 1.6 is a good description of the Iowa Test of Basic Skills (ITBS) vocabulary scores of seventh-grade students in Gary, Indiana. Call the score of a randomly chosen student X for short. Find P(X 9) and interpret the result. N(6.8, 1.6) Nov 29-11:20 AM This interprets (in the context of this problem)... The probability of randomly choosing a random seventh grade student who scores a 9 or higher on the IOWA test is approximately 8.38% or 8.4 out of 100. May 5-8:15 PM 30


31 Dec 4-11:22 AM Honors Statistics POP Quiz Chapter 6 Section 1 Nov 1-1:41 PM 31
, the numberx of nonword errors has the following distribution: (a) Write the event at least one nonword error in terms")
 =.1 +.2 +.3 =.6 P(x < 2 ) =.1 +.2 =.3 c. Find the expected value of the distribution. Interpret this value in context.")
32 Spell-checking Spell-checking software catches nonword errors, which result in a string of letters that is not a word, as when the is typed as teh. When undergraduates are asked to write a 250-word essay (without spell-checking), the numberx of nonword errors has the following distribution: (a) Write the event at least one nonword error in terms of X. What is the probability of this event? 1) = =.9 (b) Describe the event X 2 in words. What is its probability? What is the probability that X < 2? what is the probability that two or less nonword errors are caught? P(x 2) = =.6 P(x < 2 ) = =.3 c. Find the expected value of the distribution. Interpret this value in context. µx = 0(0.1) + 1(0.2) + 2(0.3) + 3(0.3) + 4(0.1) = 2.1 selected, the number of non word error will average 2.1 per The expected number of nonword errors in a randomly selected undergraduate 250 word essay is 2.1. d. Find the standard deviation of the distribution. Interpret this value in context. σ 2 x = (0-2.1) 2 (0.1) + (1-2.1) 2 (0.2) + (2-2.1) 2 (0.3) + (3-2.1) 2 (0.3) + (4-2.1) 2 (0.1) = 1.29 σ x = 1.29 = The standard deviation of X is σ x = A randomly selected undergrad essay will typically differ from the mean (2.1) by about nonword errors. Nov 21-12:23 PM N(42,2) Sep 20-8:20 PM 32
33 N(42,2) Sep 20-8:20 PM N(42,2) Sep 20-8:20 PM 33
34 N(42,2) Sep 20-8:20 PM N(42,2) Sep 20-8:20 PM 34


35 Sep 20-8:20 PM Sep 20-8:20 PM 35
 vocabulary scores of seventh-grade students in Gary, Indiana. Call the score of a randomly chosen student X for short.")
36 Sep 20-8:20 PM ITBS scores The Normal distribution with mean µ = 6.8 and standard deviation σ = 1.6 is a good description of the Iowa Test of Basic Skills (ITBS) vocabulary scores of seventh-grade students in Gary, Indiana. Call the score of a randomly chosen student X for short. Find P(X 9) and interpret the result. N(6.8, 1.6) This interprets (in the context of this problem)... The probability of randomly choosing a random seventh grade student... Nov 29-11:20 AM 36

 About $0.77; that is, on average you win about 77 cents.")
37 A deck of cards contains 52 cards, of which 4 are aces. You are offered the following wager: Draw one card at random from the deck. You win $10 if the card drawn is an ace. Otherwise, you lose $1. If you make this wager very many times, what will be the mean amount you win? 48 µ x = -1( ) + 10( ) = (a) About $1, because you will lose most of the time. (b) About $9, because you win $10 but lose only $1. (c) About $0.15; that is, on average you lose about 15 cents. (d) About $0.77; that is, on average you win about 77 cents. (e) About $0, because the random draw gives you a fair bet. Dec 4-11:45 AM Apr 29-10:28 AM 37
Honors Statistics. Daily Agenda
 Honors Statistics Aug 23-8:26 PM Daily Agenda Aug 23-8:31 PM 1 Write a program to generate random numbers. I've decided to give them free will. A Skip 4, 12, 16 Apr 25-10:55 AM Toss 4 times Suppose you
Honors Statistics. Daily Agenda
 Honors Statistics Aug 23-8:26 PM Daily Agenda 1. Review OTL C6#4 Chapter 6.2 rules for means and variances Aug 23-8:31 PM 1 Nov 21-8:16 PM Working out Choose a person aged 19 to 25 years at random and
Honors Statistics. 3. Review OTL C6#3. 4. Normal Curve Quiz. Chapter 6 Section 2 Day s Notes.notebook. May 02, 2016.
 Honors Statistics Aug 23-8:26 PM 3. Review OTL C6#3 4. Normal Curve Quiz Aug 23-8:31 PM 1 May 1-9:09 PM Apr 28-10:29 AM 2 27, 28, 29, 30 Nov 21-8:16 PM Working out Choose a person aged 19 to 25 years at
MULTIPLE CHOICE. Choose the one alternative that best completes the statement or answers the question.
 Module 5 Test Name MULTIPLE CHOICE. Choose the one alternative that best completes the statement or answers the question. Calculate the specified probability ) Suppose that T is a random variable. Given
Binomial Distributions
 . Binomial Distributions Essential Question How can you determine the frequency of each outcome of an event? Analyzing Histograms Work with a partner. The histograms show the results when n coins are flipped.
CHAPTER 6 Random Variables
 CHAPTER 6 Random Variables 6.2 Transforming and Combining Random Variables The Practice of Statistics, 5th Edition Starnes, Tabor, Yates, Moore Bedford Freeman Worth Publishers 6.2 Reading Quiz (T or F)
Chapter 7. Random Variables
 Chapter 7 Random Variables Making quantifiable meaning out of categorical data Toss three coins. What does the sample space consist of? HHH, HHT, HTH, HTT, TTT, TTH, THT, THH In statistics, we are most
6.1 Discrete & Continuous Random Variables. Nov 4 6:53 PM. Objectives
 6.1 Discrete & Continuous Random Variables examples vocab Objectives Today we will... - Compute probabilities using the probability distribution of a discrete random variable. - Calculate and interpret
Example - Let X be the number of boys in a 4 child family. Find the probability distribution table:
 Chapter7 Probability Distributions and Statistics Distributions of Random Variables tthe value of the result of the probability experiment is a RANDOM VARIABLE. Example - Let X be the number of boys in
Honors Statistics. Daily Agenda
 Honors Statistics Aug 23-8:26 PM Daily Agenda 1. Review OTL C6#7 emphasis Normal Distributions Aug 23-8:31 PM 1 1. Multiple choice: Select the best answer for Exercises 65 and 66, which refer to the following
Section Distributions of Random Variables
 Section 8.1 - Distributions of Random Variables Definition: A random variable is a rule that assigns a number to each outcome of an experiment. Example 1: Suppose we toss a coin three times. Then we could
AP Statistics Section 6.1 Day 1 Multiple Choice Practice. a) a random variable. b) a parameter. c) biased. d) a random sample. e) a statistic.
 a random variable. b) a parameter. c) biased. d) a random sample. e) a statistic.") A Statistics Section 6.1 Day 1 ultiple Choice ractice Name: 1. A variable whose value is a numerical outcome of a random phenomenon is called a) a random variable. b) a parameter. c) biased. d) a random
A Statistics Section 6.1 Day 1 ultiple Choice ractice Name: 1. A variable whose value is a numerical outcome of a random phenomenon is called a) a random variable. b) a parameter. c) biased. d) a random
Example - Let X be the number of boys in a 4 child family. Find the probability distribution table:
 Chapter8 Probability Distributions and Statistics Section 8.1 Distributions of Random Variables tthe value of the result of the probability experiment is a RANDOM VARIABLE. Example - Let X be the number
These Statistics NOTES Belong to:
 These Statistics NOTES Belong to: Topic Notes Questions Date 1 2 3 4 5 6 REVIEW DO EVERY QUESTION IN YOUR PROVINCIAL EXAM BINDER Important Calculator Functions to know for this chapter Normal Distributions
Random Variables. 6.1 Discrete and Continuous Random Variables. Probability Distribution. Discrete Random Variables. Chapter 6, Section 1
 6.1 Discrete and Continuous Random Variables Random Variables A random variable, usually written as X, is a variable whose possible values are numerical outcomes of a random phenomenon. There are two types
Density curves. (James Madison University) February 4, / 20
 February 4, / 20") Density curves Figure 6.2 p 230. A density curve is always on or above the horizontal axis, and has area exactly 1 underneath it. A density curve describes the overall pattern of a distribution. Example
Density curves Figure 6.2 p 230. A density curve is always on or above the horizontal axis, and has area exactly 1 underneath it. A density curve describes the overall pattern of a distribution. Example
HHH HHT HTH THH HTT THT TTH TTT
 AP Statistics Name Unit 04 Probability Period Day 05 Notes Discrete & Continuous Random Variables Random Variable: Probability Distribution: Example: A probability model describes the possible outcomes
Chapter 6 Section Review day s.notebook. May 11, Honors Statistics. Aug 23-8:26 PM. 3. Review team test.
 Honors Statistics Aug 23-8:26 PM 3. Review team test Aug 23-8:31 PM 1 Nov 27-10:28 PM 6.1 6.2 6.3 6.4 6.5 6.6 6.7 6.8 6.9 6.10 6.11 6.12 Nov 27-9:53 PM 2 May 8-7:44 PM May 1-9:09 PM 3 Dec 1-2:08 PM Sep
Statistical Methods in Practice STAT/MATH 3379
 Statistical Methods in Practice STAT/MATH 3379 Dr. A. B. W. Manage Associate Professor of Mathematics & Statistics Department of Mathematics & Statistics Sam Houston State University Overview 6.1 Discrete
Seventh Grade Spiraling Review Week 1 of Fifth Six Weeks
 Week of Fifth Six Weeks Note: Record all work in your math journal. Day An aquarium is 30 inches long, 7 inches wide and 8 inches tall. The aquarium is filled with water to a level of inches. A cubic foot
Exam II Math 1342 Capters 3-5 HCCS. Name
 Exam II Math 1342 Capters 3-5 HCCS Name Date Provide an appropriate response. 1) A single six-sided die is rolled. Find the probability of rolling a number less than 3. A) 0.5 B) 0.1 C) 0.25 D 0.333 1)
Unit2: Probabilityanddistributions. 3. Normal distribution
 Announcements Unit: Probabilityanddistributions 3 Normal distribution Sta 101 - Spring 015 Duke University, Department of Statistical Science February, 015 Peer evaluation 1 by Friday 11:59pm Office hours:
CHAPTER 16. SECTION 16.1 (page 1168) SECTION 16.3 (page 1192) SECTION 16.2 (page 1179) Skills Review (page 1168) Skills Review (page 1192)
 SECTION 16.3 (page 1192) SECTION 16.2 (page 1179) Skills Review (page 1168) Skills Review (page 1192)") Answers to Selected Eercises A CHAPTER SECTION. (page ) Skills Review (page )..,..,... nn n n. nn n. n!. n!....... Permutations of seating positions.,,.. (a) (b) (c). A: ; B: ; A.,.. (a), (b).....,.. nn
Answers to Selected Eercises A CHAPTER SECTION. (page ) Skills Review (page )..,..,... nn n n. nn n. n!. n!....... Permutations of seating positions.,,.. (a) (b) (c). A: ; B: ; A.,.. (a), (b).....,.. nn
Name Period AP Statistics Unit 5 Review
 Name Period AP Statistics Unit 5 Review Multiple Choice 1. Jay Olshansky from the University of Chicago was quoted in Chance News as arguing that for the average life expectancy to reach 100, 18% of people
STT 315 Practice Problems Chapter 3.7 and 4
 STT 315 Practice Problems Chapter 3.7 and 4 Answer the question True or False. 1) The number of children in a family can be modelled using a continuous random variable. 2) For any continuous probability
Section Random Variables and Histograms
 Section 3.1 - Random Variables and Histograms Definition: A random variable is a rule that assigns a number to each outcome of an experiment. Example 1: Suppose we toss a coin three times. Then we could
STAT 3090 Test 2 - Version B Fall Student s Printed Name: PLEASE READ DIRECTIONS!!!!
 Student s Printed Name: Instructor: XID: Section #: Read each question very carefully. You are permitted to use a calculator on all portions of this exam. You are NOT allowed to use any textbook, notes,
MA 1125 Lecture 14 - Expected Values. Wednesday, October 4, Objectives: Introduce expected values.
 MA 5 Lecture 4 - Expected Values Wednesday, October 4, 27 Objectives: Introduce expected values.. Means, Variances, and Standard Deviations of Probability Distributions Two classes ago, we computed the
Section Distributions of Random Variables
 Section 8.1 - Distributions of Random Variables Definition: A random variable is a rule that assigns a number to each outcome of an experiment. Example 1: Suppose we toss a coin three times. Then we could
4.1 Probability Distributions
 Probability and Statistics Mrs. Leahy Chapter 4: Discrete Probability Distribution ALWAYS KEEP IN MIND: The Probability of an event is ALWAYS between: and!!!! 4.1 Probability Distributions Random Variables
Binomial Random Variable - The count X of successes in a binomial setting
 6.3.1 Binomial Settings and Binomial Random Variables What do the following scenarios have in common? Toss a coin 5 times. Count the number of heads. Spin a roulette wheel 8 times. Record how many times
= 0.35 (or ˆp = We have 20 independent trials, each with probability of success (heads) equal to 0.5, so X has a B(20, 0.5) distribution.
 equal to 0.5, so X has a B(20, 0.5) distribution.") Chapter 5 Solutions 51 (a) n = 1500 (the sample size) (b) The Yes count seems like the most reasonable choice, but either count is defensible (c) X = 525 (or X = 975) (d) ˆp = 525 1500 = 035 (or ˆp = 975
Chapter 5 Solutions 51 (a) n = 1500 (the sample size) (b) The Yes count seems like the most reasonable choice, but either count is defensible (c) X = 525 (or X = 975) (d) ˆp = 525 1500 = 035 (or ˆp = 975
Simple Random Sample
 Simple Random Sample A simple random sample (SRS) of size n consists of n elements from the population chosen in such a way that every set of n elements has an equal chance to be the sample actually selected.
4.2 Probability Distributions
 4.2 Probability Distributions Definition. A random variable is a variable whose value is a numerical outcome of a random phenomenon. The probability distribution of a random variable tells us what the
the number of correct answers on question i. (Note that the only possible values of X i
 6851_ch08_137_153 16/9/02 19:48 Page 137 8 8.1 (a) No: There is no fixed n (i.e., there is no definite upper limit on the number of defects). (b) Yes: It is reasonable to believe that all responses are
Honors Statistics. 3. Review OTL C6#6. emphasis Normal Distributions. Chapter 6 Section 2 Day s.notebook. May 05, 2016.
 Honors Statistics Aug 23-8:26 PM 3. Review OTL C6#6 emphasis Normal Distributions Aug 23-8:31 PM 1 Nov 21-8:16 PM Rainy days Imagine that we randomly select a day from the past 10 years. Let X be the recorded
FINAL REVIEW W/ANSWERS
 FINAL REVIEW W/ANSWERS ( 03/15/08 - Sharon Coates) Concepts to review before answering the questions: A population consists of the entire group of people or objects of interest to an investigator, while
Exercise Questions: Chapter What is wrong? Explain what is wrong in each of the following scenarios.
 5.9 What is wrong? Explain what is wrong in each of the following scenarios. (a) If you toss a fair coin three times and a head appears each time, then the next toss is more likely to be a tail than a
5.1 Personal Probability
 5. Probability Value Page 1 5.1 Personal Probability Although we think probability is something that is confined to math class, in the form of personal probability it is something we use to make decisions
Homework: Due Wed, Nov 3 rd Chapter 8, # 48a, 55c and 56 (count as 1), 67a
, 67a") Homework: Due Wed, Nov 3 rd Chapter 8, # 48a, 55c and 56 (count as 1), 67a Announcements: There are some office hour changes for Nov 5, 8, 9 on website Week 5 quiz begins after class today and ends at
Homework: Due Wed, Nov 3 rd Chapter 8, # 48a, 55c and 56 (count as 1), 67a Announcements: There are some office hour changes for Nov 5, 8, 9 on website Week 5 quiz begins after class today and ends at
X Prob
 Wednesday, December 6, 2017 Warm-up Faked numbers in tax returns, invoices, or expense account claims often display patterns that aren t present in legitimate records. Some patterns, like too many round
CHAPTER 10: Introducing Probability
 CHAPTER 10: Introducing Probability The Basic Practice of Statistics 6 th Edition Moore / Notz / Fligner Lecture PowerPoint Slides Chapter 10 Concepts 2 The Idea of Probability Probability Models Probability
Homework: Due Wed, Feb 20 th. Chapter 8, # 60a + 62a (count together as 1), 74, 82
, 74, 82") Announcements: Week 5 quiz begins at 4pm today and ends at 3pm on Wed If you take more than 20 minutes to complete your quiz, you will only receive partial credit. (It doesn t cut you off.) Today: Sections
Announcements: Week 5 quiz begins at 4pm today and ends at 3pm on Wed If you take more than 20 minutes to complete your quiz, you will only receive partial credit. (It doesn t cut you off.) Today: Sections
Problem Set 07 Discrete Random Variables
 Name Problem Set 07 Discrete Random Variables MULTIPLE CHOICE. Choose the one alternative that best completes the statement or answers the question. Find the mean of the random variable. 1) The random
Section 3.1 Distributions of Random Variables
 Section 3.1 Distributions of Random Variables Random Variable A random variable is a rule that assigns a number to each outcome of a chance experiment. There are three types of random variables: 1. Finite
Chapter 4 and 5 Note Guide: Probability Distributions
 Chapter 4 and 5 Note Guide: Probability Distributions Probability Distributions for a Discrete Random Variable A discrete probability distribution function has two characteristics: Each probability is
Chapter 6: Random Variables
 Chapter 6: Random Variables Section 6.1 Discrete and Continuous Random Variables The Practice of Statistics, 4 th edition For AP* STARNES, YATES, MOORE Chapter 6 Random Variables 6.1 Discrete and Continuous
Lecture 9. Probability Distributions
 Lecture 9 Probability Distributions Outline 6-1 Introduction 6-2 Probability Distributions 6-3 Mean, Variance, and Expectation 6-4 The Binomial Distribution Outline 7-2 Properties of the Normal Distribution
Section 8.1 Distributions of Random Variables
 Section 8.1 Distributions of Random Variables Random Variable A random variable is a rule that assigns a number to each outcome of a chance experiment. There are three types of random variables: 1. Finite
Example. Chapter 8 Probability Distributions and Statistics Section 8.1 Distributions of Random Variables
 Chapter 8 Probability Distributions and Statistics Section 8.1 Distributions of Random Variables You are dealt a hand of 5 cards. Find the probability distribution table for the number of hearts. Graph
Expected Value of a Random Variable
 Knowledge Article: Probability and Statistics Expected Value of a Random Variable Expected Value of a Discrete Random Variable You're familiar with a simple mean, or average, of a set. The mean value of
Name: Show all your work! Mathematical Concepts Joysheet 1 MAT 117, Spring 2013 D. Ivanšić
 Mathematical Concepts Joysheet 1 Use your calculator to compute each expression to 6 significant digits accuracy or six decimal places, whichever is more accurate. Write down the sequence of keys you entered
The Uniform Distribution
 Connexions module: m46972 The Uniform Distribution OpenStax College This work is produced by The Connexions Project and licensed under the Creative Commons Attribution License 3.0 The uniform distribution
DO NOT POST THESE ANSWERS ONLINE BFW Publishers 2014
 Section 6.3 Check our Understanding, page 389: 1. Check the BINS: Binary? Success = get an ace. Failure = don t get an ace. Independent? Because you are replacing the card in the deck and shuffling each
I. Standard Error II. Standard Error III. Standard Error 2.54
 1) Original Population: Match the standard error (I, II, or III) with the correct sampling distribution (A, B, or C) and the correct sample size (1, 5, or 10) I. Standard Error 1.03 II. Standard Error
Math Take Home Quiz on Chapter 2
 Math 116 - Take Home Quiz on Chapter 2 Show the calculations that lead to the answer. Due date: Tuesday June 6th Name Time your class meets Provide an appropriate response. 1) A newspaper surveyed its
X = x p(x) 1 / 6 1 / 6 1 / 6 1 / 6 1 / 6 1 / 6. x = 1 x = 2 x = 3 x = 4 x = 5 x = 6 values for the random variable X
 1 / 6 1 / 6 1 / 6 1 / 6 1 / 6 1 / 6. x = 1 x = 2 x = 3 x = 4 x = 5 x = 6 values for the random variable X") Calculus II MAT 146 Integration Applications: Probability Calculating probabilities for discrete cases typically involves comparing the number of ways a chosen event can occur to the number of ways all
Calculus II MAT 146 Integration Applications: Probability Calculating probabilities for discrete cases typically involves comparing the number of ways a chosen event can occur to the number of ways all
Lecture 9. Probability Distributions. Outline. Outline
 Outline Lecture 9 Probability Distributions 6-1 Introduction 6- Probability Distributions 6-3 Mean, Variance, and Expectation 6-4 The Binomial Distribution Outline 7- Properties of the Normal Distribution
Edexcel Statistics 1 Normal Distribution Edited by: K V Kumaran
 Edexcel Statistics 1 Normal Distribution Edited by: K V Kumaran kumarmaths.weebly.com 1 kumarmaths.weebly.com 2 kumarmaths.weebly.com 3 kumarmaths.weebly.com 4 kumarmaths.weebly.com 5 kumarmaths.weebly.com
3. The n observations are independent. Knowing the result of one observation tells you nothing about the other observations.
 Binomial and Geometric Distributions - Terms and Formulas Binomial Experiments - experiments having all four conditions: 1. Each observation falls into one of two categories we call them success or failure.
Statistics and Probability
 Statistics and Probability Continuous RVs (Normal); Confidence Intervals Outline Continuous random variables Normal distribution CLT Point estimation Confidence intervals http://www.isrec.isb-sib.ch/~darlene/geneve/
22.2 Shape, Center, and Spread
 Name Class Date 22.2 Shape, Center, and Spread Essential Question: Which measures of center and spread are appropriate for a normal distribution, and which are appropriate for a skewed distribution? Eplore
A.REPRESENTATION OF DATA
 A.REPRESENTATION OF DATA (a) GRAPHS : PART I Q: Why do we need a graph paper? Ans: You need graph paper to draw: (i) Histogram (ii) Cumulative Frequency Curve (iii) Frequency Polygon (iv) Box-and-Whisker
CHAPTER 6 Random Variables
 CHAPTER 6 Random Variables 6.1 Discrete and Continuous Random Variables The Practice of Statistics, 5th Edition Starnes, Tabor, Yates, Moore Bedford Freeman Worth Publishers Discrete and Continuous Random
TRUE-FALSE: Determine whether each of the following statements is true or false.
 Chapter 6 Test Review Name TRUE-FALSE: Determine whether each of the following statements is true or false. 1) A random variable is continuous when the set of possible values includes an entire interval
Introduction to Business Statistics QM 120 Chapter 6
 DEPARTMENT OF QUANTITATIVE METHODS & INFORMATION SYSTEMS Introduction to Business Statistics QM 120 Chapter 6 Spring 2008 Chapter 6: Continuous Probability Distribution 2 When a RV x is discrete, we can
3. The n observations are independent. Knowing the result of one observation tells you nothing about the other observations.
 Binomial and Geometric Distributions - Terms and Formulas Binomial Experiments - experiments having all four conditions: 1. Each observation falls into one of two categories we call them success or failure.
Let X be the number that comes up on the next roll of the die.
 Chapter 6 - Discrete Probability Distributions 6.1 Random Variables Introduction If we roll a fair die, the possible outcomes are the numbers 1, 2, 3, 4, 5, and 6, and each of these numbers has probability
X P(X) (c) Express the event performing at least two tests in terms of X and find its probability.
 (c) Express the event performing at least two tests in terms of X and find its probability.") AP Stats ~ QUIZ 6 Name Period 1. The probability distribution below is for the random variable X = number of medical tests performed on a randomly selected outpatient at a certain hospital. X 0 1 2 3 4
AP Stats ~ QUIZ 6 Name Period 1. The probability distribution below is for the random variable X = number of medical tests performed on a randomly selected outpatient at a certain hospital. X 0 1 2 3 4
Section M Discrete Probability Distribution
 Section M Discrete Probability Distribution A random variable is a numerical measure of the outcome of a probability experiment, so its value is determined by chance. Random variables are typically denoted
STAT 3090 Test 2 - Version B Fall Student s Printed Name: PLEASE READ DIRECTIONS!!!!
 STAT 3090 Test 2 - Fall 2015 Student s Printed Name: Instructor: XID: Section #: Read each question very carefully. You are permitted to use a calculator on all portions of this exam. You are NOT allowed
Chapter 4 Random Variables & Probability. Chapter 4.5, 6, 8 Probability Distributions for Continuous Random Variables
 Chapter 4.5, 6, 8 Probability for Continuous Random Variables Discrete vs. continuous random variables Examples of continuous distributions o Uniform o Exponential o Normal Recall: A random variable =
6.1 Discrete and Continuous Random Variables. 6.1A Discrete random Variables, Mean (Expected Value) of a Discrete Random Variable
 of a Discrete Random Variable") 6.1 Discrete and Continuous Random Variables 6.1A Discrete random Variables, Mean (Expected Value) of a Discrete Random Variable Random variable Takes numerical values that describe the outcomes of some
6.1 Discrete and Continuous Random Variables 6.1A Discrete random Variables, Mean (Expected Value) of a Discrete Random Variable Random variable Takes numerical values that describe the outcomes of some
Determine whether the given events are disjoint. 1) Drawing a face card from a deck of cards and drawing a deuce A) Yes B) No
 Drawing a face card from a deck of cards and drawing a deuce A) Yes B) No") Assignment 8.-8.6 Name MULTIPLE CHOICE. Choose the one alternative that best completes the statement or answers the question. Determine whether the given events are disjoint. 1) Drawing a face card from
Assignment 8.-8.6 Name MULTIPLE CHOICE. Choose the one alternative that best completes the statement or answers the question. Determine whether the given events are disjoint. 1) Drawing a face card from
Chapter 8. Variables. Copyright 2004 Brooks/Cole, a division of Thomson Learning, Inc.
 Chapter 8 Random Variables Copyright 2004 Brooks/Cole, a division of Thomson Learning, Inc. 8.1 What is a Random Variable? Random Variable: assigns a number to each outcome of a random circumstance, or,
Central Limit Theorem
 Central Limit Theorem Lots of Samples 1 Homework Read Sec 6-5. Discussion Question pg 329 Do Ex 6-5 8-15 2 Objective Use the Central Limit Theorem to solve problems involving sample means 3 Sample Means
Fall 2015 Math 141:505 Exam 3 Form A
 Fall 205 Math 4:505 Exam 3 Form A Last Name: First Name: Exam Seat #: UIN: On my honor, as an Aggie, I have neither given nor received unauthorized aid on this academic work Signature: INSTRUCTIONS Part
Probability & Sampling The Practice of Statistics 4e Mostly Chpts 5 7
 Probability & Sampling The Practice of Statistics 4e Mostly Chpts 5 7 Lew Davidson (Dr.D.) Mallard Creek High School Lewis.Davidson@cms.k12.nc.us 704-786-0470 Probability & Sampling The Practice of Statistics
MATH 446/546 Homework 1:
 MATH 446/546 Homework 1: Due September 28th, 216 Please answer the following questions. Students should type there work. 1. At time t, a company has I units of inventory in stock. Customers demand the
EXERCISES FOR PRACTICE SESSION 2 OF STAT CAMP
 EXERCISES FOR PRACTICE SESSION 2 OF STAT CAMP Note 1: The exercises below that are referenced by chapter number are taken or modified from the following open-source online textbook that was adapted by
Chapter 4 Discrete Random variables
 Chapter 4 Discrete Random variables A is a variable that assumes numerical values associated with the random outcomes of an experiment, where only one numerical value is assigned to each sample point.
PROBABILITY DISTRIBUTIONS
 CHAPTER 3 PROBABILITY DISTRIBUTIONS Page Contents 3.1 Introduction to Probability Distributions 51 3.2 The Normal Distribution 56 3.3 The Binomial Distribution 60 3.4 The Poisson Distribution 64 Exercise
MULTIPLE CHOICE. Choose the one alternative that best completes the statement or answers the question.
 Midterm Review Name 1) As part of an economics class project, students were asked to randomly select 500 New York Stock Exchange (NYSE) stocks from the Wall Street Journal. As part of the project, students
Putting Things Together Part 1
 Putting Things Together Part 1 These exercise blend ideas from various graphs (histograms and boxplots), differing shapes of distributions, and values summarizing the data. Data for 1, 5, and 6 are in
+ Chapter 7. Random Variables. Chapter 7: Random Variables 2/26/2015. Transforming and Combining Random Variables
 + Chapter 7: Random Variables Section 7.1 Discrete and Continuous Random Variables The Practice of Statistics, 4 th edition For AP* STARNES, YATES, MOORE + Chapter 7 Random Variables 7.1 7.2 7.2 Discrete
Theoretical Foundations
 Theoretical Foundations Probabilities Monia Ranalli monia.ranalli@uniroma2.it Ranalli M. Theoretical Foundations - Probabilities 1 / 27 Objectives understand the probability basics quantify random phenomena
Experimental Probability - probability measured by performing an experiment for a number of n trials and recording the number of outcomes
 MDM 4U Probability Review Properties of Probability Experimental Probability - probability measured by performing an experiment for a number of n trials and recording the number of outcomes Theoretical
Chapter 6: Probability: What are the Chances?
 + Chapter 6: Probability: What are the Chances? Section 6.1 Randomness and Probability The Practice of Statistics, 4 th edition For AP* STARNES, YATES, MOORE + Section 6.1 Randomness and Probability Learning
Chapter 8 Homework Solutions Compiled by Joe Kahlig. speed(x) freq 25 x < x < x < x < x < x < 55 5
 freq 25 x < x < x < x < x < x < 55 5") H homework problems, C-copyright Joe Kahlig Chapter Solutions, Page Chapter Homework Solutions Compiled by Joe Kahlig. (a) finite discrete (b) infinite discrete (c) continuous (d) finite discrete (e) continuous.
H homework problems, C-copyright Joe Kahlig Chapter Solutions, Page Chapter Homework Solutions Compiled by Joe Kahlig. (a) finite discrete (b) infinite discrete (c) continuous (d) finite discrete (e) continuous.
7 THE CENTRAL LIMIT THEOREM
 CHAPTER 7 THE CENTRAL LIMIT THEOREM 373 7 THE CENTRAL LIMIT THEOREM Figure 7.1 If you want to figure out the distribution of the change people carry in their pockets, using the central limit theorem and
Math 2311 Bekki George Office Hours: MW 11am to 12:45pm in 639 PGH Online Thursdays 4-5:30pm And by appointment
 Math 2311 Bekki George bekki@math.uh.edu Office Hours: MW 11am to 12:45pm in 639 PGH Online Thursdays 4-5:30pm And by appointment Class webpage: http://www.math.uh.edu/~bekki/math2311.html Math 2311 Class
Chapter 7. Random Variables: 7.1: Discrete and Continuous. Random Variables. 7.2: Means and Variances of. Random Variables
 Chapter 7 Random Variables In Chapter 6, we learned that a!random phenomenon" was one that was unpredictable in the short term, but displayed a predictable pattern in the long run. In Statistics, we are
Mathematical Concepts Joysheet 1 MAT 117, Spring 2011 D. Ivanšić. Name: Show all your work!
 Mathematical Concepts Joysheet 1 Use your calculator to compute each expression to 6 significant digits accuracy. Write down thesequence of keys youentered inorder to compute each expression. Donot roundnumbers
11.5: Normal Distributions
 11.5: Normal Distributions 11.5.1 Up to now, we ve dealt with discrete random variables, variables that take on only a finite (or countably infinite we didn t do these) number of values. A continuous random
TOPIC: PROBABILITY DISTRIBUTIONS
 TOPIC: PROBABILITY DISTRIBUTIONS There are two types of random variables: A Discrete random variable can take on only specified, distinct values. A Continuous random variable can take on any value within
The topics in this section are related and necessary topics for both course objectives.
 2.5 Probability Distributions The topics in this section are related and necessary topics for both course objectives. A probability distribution indicates how the probabilities are distributed for outcomes
Part 1 In which we meet the law of averages. The Law of Averages. The Expected Value & The Standard Error. Where Are We Going?
 1 The Law of Averages The Expected Value & The Standard Error Where Are We Going? Sums of random numbers The law of averages Box models for generating random numbers Sums of draws: the Expected Value Standard
Unit 04 Review. Probability Rules
 Unit 04 Review Probability Rules A sample space contains all the possible outcomes observed in a trial of an experiment, a survey, or some random phenomenon. The sum of the probabilities for all possible
Lecture 6 Probability
 Faculty of Medicine Epidemiology and Biostatistics الوبائيات واإلحصاء الحيوي (31505204) Lecture 6 Probability By Hatim Jaber MD MPH JBCM PhD 3+4-7-2018 1 Presentation outline 3+4-7-2018 Time Introduction-
Section 8.1 Distributions of Random Variables
 Section 8.1 Distributions of Random Variables Random Variable A random variable is a rule that assigns a number to each outcome of a chance experiment. There are three types of random variables: 1. Finite