Honors Statistics. Daily Agenda
|
|
|
- Tracey Neal
- 5 years ago
- Views:
Transcription

1 Honors Statistics Aug 23-8:26 PM Daily Agenda 1. Review OTL C6#4 Chapter 6.2 rules for means and variances Aug 23-8:31 PM 1


 Make a histogram of the probability distribution.")
 Describe the event Y < 7 in words. What is P(Y < 7)?")
 = 1 - P(Y = 7) = 1-0.02 = 0.")
2 Nov 21-8:16 PM Working out Choose a person aged 19 to 25 years at random and ask, In the past seven days, how many times did you go to an exercise or fitness center or work out? Call the responsey for short. Based on a large sample survey, here is a probability model for the answer you will get: 8 (a) Show that this is a legitimate probability distribution = 1 (b) Make a histogram of the probability distribution. Describe what you see. frequency (c) Describe the event Y < 7 in words. What is P(Y < 7)? Number of workout days What is the probability that a randomly selected persons aged 19 to 25 went to the gym less than seven days this week? P(Y < 7) = 1 - P(Y = 7) = = 0.98 (d) Express the event worked out at least once in terms of Y. What is the probability of this event? P(Y 1) = 1 - P(Y = 0) = = 0.32 Nov 29-10:57 AM 2
? outcomes = 1,2,3,4,5,6,7 P(Y 1) = 1 - P(Y = 0) = 1-0.68 = 0.32 (b) What outcomes make up the event B? What is P(B)? outcomes = 0,1,2,3,4 P(Y < 5) = 0.68 + 0.")
 Nov 29-11:00 AM Keno Keno is a favorite game in casinos, and similar games are popular with")

 + 2(0.25) = -0.25 Nov 29-11:02 AM 3")
3 Working out Refer to Exercise 6. Consider the events A = works out at least once and B = works out less than 5 times per week. (a) What outcomes make up the event A? What is P(A)? outcomes = 1,2,3,4,5,6,7 P(Y 1) = 1 - P(Y = 0) = = 0.32 (b) What outcomes make up the event B? What is P(B)? outcomes = 0,1,2,3,4 P(Y < 5) = = 0.93 (c) What outcomes make up the event A and B? What isp(a and B)? Why is this probability not equal to P(A) P(B)? P(A and B) = = 0.25 The events working out at least once and working out less than 5 times per week are not INDEPENDENT events. So Multiplication cannot be used to determine the probability of P(A and B) Nov 29-11:00 AM Keno Keno is a favorite game in casinos, and similar games are popular with the states that operate lotteries. Balls numbered 1 to 80 are tumbled in a machine as the bets are placed, then 20 of the balls are chosen at random. Players select numbers by marking a card. The simplest of the many wagers available is Mark 1 Number. Your payoff is $3 on a $1 bet if the number you select is one of those chosen. Because 20 of 80 numbers are chosen, your probability of winning is 20/80, or Let X= the net amount you gain on a single play of the game. OR Based on what you "get" back OR µ x = -1(0.75) + 2(0.25) = Nov 29-11:02 AM 3


 and standard deviation 6 mph.")
 Find P(Y > 120) and interpret the result. 0.2033 .")
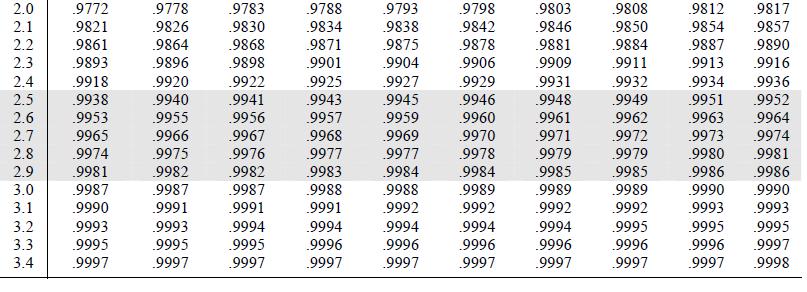
4 Running a mile the University of Illinois found that their times for the mile run were approximately Normal with mean 7.11 minutes and standard deviation 0.74 minute. Choose a student at random and interpret the result. This interprets (in the context of this problem)... The probability of randomly choosing a random student who can run the mile in less than 6 minutes is approximately 6.68% or 6.7 out of 100. Nov 29-11:19 AM Professional tennis player Rafael Nadal hits the ball extremely hard. His first-serve speeds follow a Normal distribution with mean 115 miles per hour (mph) and standard deviation 6 mph. Choose one of Nadal s first serves at random. Let Y = its speed, measured in miles per hour. (a) Find P(Y > 120) and interpret the result This interprets (in the context of this problem)... The probability of randomly choosing one of Nadal's first serves that is faster than 120 mph is approximately 20.33% or 20 out of 100. (b) What is P(Y 120)? Explain. The answer is equal to P(Y > 120) Because the P(Y = 120) is zero. Nov 29-11:21 AM 4

 240) and interpret the result. > 240)? Explain. 1-0.0516 0.9484 This interprets (in the context of this problem).")
5 (c) Find the value of c such that P(Y c) = Show your work. This interprets (in the context of this problem)... The probability of randomly choosing one of Nadal's first serves that is slower than mph is approximately 15% or 15 out of 100. Dec 1-9:51 PM The length of human pregnancies from conception to birth follows a Normal distribution with mean 266 days and standard deviation 16 days. Choose a pregnant woman at random. Let = the length of her N(266, 16) 240) and interpret the result. > 240)? Explain This interprets (in the context of this problem)... The probability of randomly choosing one pregnant lady that carries her baby at least 240 days is approximately 94.84% or 95 out of 100 pregnant women. The answer is equal to P(X > 240) Because the P(X = 240) is zero. Dec 4-7:12 AM 5
 = P(z 0.84) 0.20 This interprets (in the context of this problem).")

6 Find the value of ) = Show your work. N(266, 16) c = 0.84(16) P( X ) = P(z 0.84) 0.20 This interprets (in the context of this problem)... The probability of randomly choosing one pregnant lady that carries her baby at least days is approximately 20% or 20 out of 100 pregnant women. Dec 4-7:12 AM NORMAL CURVE QUIZ Apr 28-10:26 AM 6
 they own.")
 1.75 (c) 1.84 (d) 2.00 (e) 2.50 µ x = 0(0.09) + 1(0.36) + 2(0.35) + 3(0.13) + 4(0.05) + 5(0.02) = 1.75 Dec 4-7:12 AM 2. The standard deviation of X is σ X = 1.08.")
 The number of cars would be at most 1.08 from the mean. (d) The number of cars would be within 1.08 from the mean about 68% of the time.")
7 1. Multiple choice: Select the best answer for Exercises 27 to 30. Exercises 27 to 29 refer to the following setting. Choose an American household at random and let the random variable X be the number of cars (including SUVs and light trucks) they own. Here is the probability model if we ignore the few households that own more than 5 cars: What s the expected number of cars in a randomly selected American household? (a) 1.00 (b) 1.75 (c) 1.84 (d) 2.00 (e) 2.50 µ x = 0(0.09) + 1(0.36) + 2(0.35) + 3(0.13) + 4(0.05) + 5(0.02) = 1.75 Dec 4-7:12 AM 2. The standard deviation of X is σ X = If many households were selected at random, which of the following would be the best interpretation of the value 1.08? (a) The mean number of cars would be about (b) The number of cars would typically be about 1.08 from the mean. (c) The number of cars would be at most 1.08 from the mean. (d) The number of cars would be within 1.08 from the mean about 68% of the time. (e) The mean number of cars would be about 1.08 from the expected value. Dec 4-7:12 AM 7
 = 3.91 mean - 2 St. Dev. = 1.75-2(1.")

 About $9, because you win $10 but lose only $1. (c) About $0.15; that is, on average you lose about 15 cents. (d) About $0.77; that is, on average you win about 77 cents.")
8 3. About what percentage of households have a number of cars within 2 standard deviations of the mean? (a) 68% (b) 71% (c) 93% (d) 95% (e) 98% C we know the following... µ x = 1.75 σ x = 1.08 but it is not stated that the distribution is approximately NORMAL so use the table above... mean + 2 St. Dev. = (1.08) = 3.91 mean - 2 St. Dev. = (1.08) = between 0 and 3.91 cars (must use 3) = 0.93 What is the probability that they have more than 5 cars????? Dec 4-11:45 AM 4. A deck of cards contains 52 cards, of which 4 are aces. You are offered the following wager: Draw one card at random from the deck. You win $10 if the card drawn is an ace. Otherwise, you lose $1. If you make this wager very many times, what will be the mean amount you win? (a) About $1, because you will lose most of the time. (b) About $9, because you win $10 but lose only $1. (c) About $0.15; that is, on average you lose about 15 cents. (d) About $0.77; that is, on average you win about 77 cents. (e) About $0, because the random draw gives you a fair bet. Dec 4-11:45 AM 8
 Binomial (b) Probability (c) Symmetric (d) Continuous (e) Discrete Nov 29-11:21 AM You")

9 5. Question 5 In which setting does is P(X < 6) = P(X 6)? (a) Binomial (b) Probability (c) Symmetric (d) Continuous (e) Discrete Nov 29-11:21 AM You choose a 3 digit number. The lottery commission announces the The "box" pays $83.33 if the number you choose has the same digits as on the box. (Assume a number with three different digits is chosen) let X = Dec 5-1:10 PM 9


10 Nov 30-7:23 PM Nov 30-7:23 PM 10


11 Nov 30-7:23 PM Nov 30-7:24 PM 11

12 Nov 30-7:37 PM May 11-9:20 AM 12
13 May 11-9:19 AM May 1-8:44 AM 13

14 Can you see why this is called a linear transformation? The equation describing the sequence of transformations has the form Y = a + bx, which you should recognize as a linear equation. Nov 30-7:39 PM A large auto dealership keeps track of sales made during each hour of the day. Let X = the number of cars sold during the first hour of business on a randomly selected Friday. Based on previous records, the probability distribution of X is as follows: The random variable X has mean µx = 1.1 and standard deviation σx = Suppose the dealership s manager receives a $500 bonus from the company for each car sold. Let Y = the bonus received from car sales during the first hour on a randomly selected Friday. Find the mean and standard deviation of Y. 2. To encourage customers to buy cars on Friday mornings, the manager spends $75 to provide coffee and doughnuts. The manager s net profit T on a randomly selected Friday is the bonus earned minus this $75. Find the mean and standard deviation of T. Nov 30-7:28 PM 14

15 Normal Curve (Continuous Random Variable) practice Scaling a Test In a large introductory statistics class, the distribution of raw scores on a test X follows a Normal Distribution with a mean of 17.2 and a standard deviation of 3.8. The professor decides to scale the scores by multiplying the raw scores by 4 and adding 10. a) Define the variable Y to be the scaled score of a randomly selected student from this class. Find the mean and the standard deviation of Y. b) What is the probability that a randomly selected student has a scaled test score of at least 90? Nov 30-8:11 PM Dec 1-2:08 PM 15


16 Sep 26-6:57 PM Sep 26-6:58 PM 16


17 A-Skip 35, 39, 40 Nov 21-8:16 PM 17
Honors Statistics. 3. Review OTL C6#3. 4. Normal Curve Quiz. Chapter 6 Section 2 Day s Notes.notebook. May 02, 2016.
 Honors Statistics Aug 23-8:26 PM 3. Review OTL C6#3 4. Normal Curve Quiz Aug 23-8:31 PM 1 May 1-9:09 PM Apr 28-10:29 AM 2 27, 28, 29, 30 Nov 21-8:16 PM Working out Choose a person aged 19 to 25 years at
Chapter 6 Section 1 Day s.notebook. April 29, Honors Statistics. Aug 23-8:26 PM. 3. Review OTL C6#2. Aug 23-8:31 PM
 Honors Statistics Aug 23-8:26 PM 3. Review OTL C6#2 Aug 23-8:31 PM 1 Apr 27-9:20 AM Jan 18-2:13 PM 2 Nov 27-10:28 PM 6.1 6.2 6.3 6.4 6.5 6.6 6.7 6.8 6.9 6.10 6.11 6.12 Nov 27-9:53 PM 3 Ask about 1 and
Honors Statistics. Daily Agenda
 Honors Statistics Daily Agenda 1. Review OTL C6#5 2. Quiz Section 6.1 A-Skip 35, 39, 40 Crickets The length in inches of a cricket chosen at random from a field is a random variable X with mean 1.2 inches
HHH HHT HTH THH HTT THT TTH TTT
 AP Statistics Name Unit 04 Probability Period Day 05 Notes Discrete & Continuous Random Variables Random Variable: Probability Distribution: Example: A probability model describes the possible outcomes
6.1 Discrete & Continuous Random Variables. Nov 4 6:53 PM. Objectives
 6.1 Discrete & Continuous Random Variables examples vocab Objectives Today we will... - Compute probabilities using the probability distribution of a discrete random variable. - Calculate and interpret
CHAPTER 6 Random Variables
 CHAPTER 6 Random Variables 6.2 Transforming and Combining Random Variables The Practice of Statistics, 5th Edition Starnes, Tabor, Yates, Moore Bedford Freeman Worth Publishers 6.2 Reading Quiz (T or F)
AP Stats ~ Lesson 6B: Transforming and Combining Random variables
 AP Stats ~ Lesson 6B: Transforming and Combining Random variables OBJECTIVES: DESCRIBE the effects of transforming a random variable by adding or subtracting a constant and multiplying or dividing by a
Honors Statistics. Daily Agenda
 Honors Statistics Aug 23-8:26 PM Daily Agenda Aug 23-8:31 PM 1 Write a program to generate random numbers. I've decided to give them free will. A Skip 4, 12, 16 Apr 25-10:55 AM Toss 4 times Suppose you
6.2.1 Linear Transformations
 6.2.1 Linear Transformations In Chapter 2, we studied the effects of transformations on the shape, center, and spread of a distribution of data. Recall what we discovered: 1. Adding (or subtracting) a
Section Distributions of Random Variables
 Section 8.1 - Distributions of Random Variables Definition: A random variable is a rule that assigns a number to each outcome of an experiment. Example 1: Suppose we toss a coin three times. Then we could
Section 6.2 Transforming and Combining Random Variables. Linear Transformations
 Section 6.2 Transforming and Combining Random Variables Linear Transformations In Section 6.1, we learned that the mean and standard deviation give us important information about a random variable. In
EDCC charges $50 per credit. Let T = tuition charge for a randomly-selected fulltime student. T = 50X. Tuit. T $600 $650 $700 $750 $800 $850 $900
 Chapter 7 Random Variables n 7.1 Discrete and Continuous Random Variables n 6.2 n Example: El Dorado Community College El Dorado Community College considers a student to be full-time if he or she is taking
Chapter 6 Section Review day s.notebook. May 11, Honors Statistics. Aug 23-8:26 PM. 3. Review team test.
 Honors Statistics Aug 23-8:26 PM 3. Review team test Aug 23-8:31 PM 1 Nov 27-10:28 PM 6.1 6.2 6.3 6.4 6.5 6.6 6.7 6.8 6.9 6.10 6.11 6.12 Nov 27-9:53 PM 2 May 8-7:44 PM May 1-9:09 PM 3 Dec 1-2:08 PM Sep
STT 315 Practice Problems Chapter 3.7 and 4
 STT 315 Practice Problems Chapter 3.7 and 4 Answer the question True or False. 1) The number of children in a family can be modelled using a continuous random variable. 2) For any continuous probability
Distribution of the Sample Mean
 Distribution of the Sample Mean MATH 130, Elements of Statistics I J. Robert Buchanan Department of Mathematics Fall 2018 Experiment (1 of 3) Suppose we have the following population : 4 8 1 2 3 4 9 1
Chapter 7. Random Variables
 Chapter 7 Random Variables Making quantifiable meaning out of categorical data Toss three coins. What does the sample space consist of? HHH, HHT, HTH, HTT, TTT, TTH, THT, THH In statistics, we are most
Exam II Math 1342 Capters 3-5 HCCS. Name
 Exam II Math 1342 Capters 3-5 HCCS Name Date Provide an appropriate response. 1) A single six-sided die is rolled. Find the probability of rolling a number less than 3. A) 0.5 B) 0.1 C) 0.25 D 0.333 1)
Part 1 In which we meet the law of averages. The Law of Averages. The Expected Value & The Standard Error. Where Are We Going?
 1 The Law of Averages The Expected Value & The Standard Error Where Are We Going? Sums of random numbers The law of averages Box models for generating random numbers Sums of draws: the Expected Value Standard
Test 6A AP Statistics Name:
 Test 6A AP Statistics Name: Part 1: Multiple Choice. Circle the letter corresponding to the best answer. 1. A marketing survey compiled data on the number of personal computers in households. If X = the
Honors Statistics. Daily Agenda
 Honors Statistics Aug 23-8:26 PM Daily Agenda 1. Review OTL C6#7 emphasis Normal Distributions Aug 23-8:31 PM 1 1. Multiple choice: Select the best answer for Exercises 65 and 66, which refer to the following
NORMAL RANDOM VARIABLES (Normal or gaussian distribution)
") NORMAL RANDOM VARIABLES (Normal or gaussian distribution) Many variables, as pregnancy lengths, foot sizes etc.. exhibit a normal distribution. The shape of the distribution is a symmetric bell shape.
NORMAL RANDOM VARIABLES (Normal or gaussian distribution) Many variables, as pregnancy lengths, foot sizes etc.. exhibit a normal distribution. The shape of the distribution is a symmetric bell shape.
Let X be the number that comes up on the next roll of the die.
 Chapter 6 - Discrete Probability Distributions 6.1 Random Variables Introduction If we roll a fair die, the possible outcomes are the numbers 1, 2, 3, 4, 5, and 6, and each of these numbers has probability
Section Distributions of Random Variables
 Section 8.1 - Distributions of Random Variables Definition: A random variable is a rule that assigns a number to each outcome of an experiment. Example 1: Suppose we toss a coin three times. Then we could
Edexcel Statistics 1 Normal Distribution Edited by: K V Kumaran
 Edexcel Statistics 1 Normal Distribution Edited by: K V Kumaran kumarmaths.weebly.com 1 kumarmaths.weebly.com 2 kumarmaths.weebly.com 3 kumarmaths.weebly.com 4 kumarmaths.weebly.com 5 kumarmaths.weebly.com
Section Random Variables and Histograms
 Section 3.1 - Random Variables and Histograms Definition: A random variable is a rule that assigns a number to each outcome of an experiment. Example 1: Suppose we toss a coin three times. Then we could
Unit2: Probabilityanddistributions. 3. Normal distribution
 Announcements Unit: Probabilityanddistributions 3 Normal distribution Sta 101 - Spring 015 Duke University, Department of Statistical Science February, 015 Peer evaluation 1 by Friday 11:59pm Office hours:
Chapter 6: Random Variables
 Chapter 6: Random Variables Section 6.1 Discrete and Continuous Random Variables The Practice of Statistics, 4 th edition For AP* STARNES, YATES, MOORE Chapter 6 Random Variables 6.1 Discrete and Continuous
Unit 04 Review. Probability Rules
 Unit 04 Review Probability Rules A sample space contains all the possible outcomes observed in a trial of an experiment, a survey, or some random phenomenon. The sum of the probabilities for all possible
Lecture 9. Probability Distributions. Outline. Outline
 Outline Lecture 9 Probability Distributions 6-1 Introduction 6- Probability Distributions 6-3 Mean, Variance, and Expectation 6-4 The Binomial Distribution Outline 7- Properties of the Normal Distribution
Lecture 9. Probability Distributions
 Lecture 9 Probability Distributions Outline 6-1 Introduction 6-2 Probability Distributions 6-3 Mean, Variance, and Expectation 6-4 The Binomial Distribution Outline 7-2 Properties of the Normal Distribution
Statistical Methods in Practice STAT/MATH 3379
 Statistical Methods in Practice STAT/MATH 3379 Dr. A. B. W. Manage Associate Professor of Mathematics & Statistics Department of Mathematics & Statistics Sam Houston State University Overview 6.1 Discrete
Chapter 6: Random Variables
 Chapter 6: Random Variables Section 6. The Practice of Statistics, 4 th edition For AP* STARNES, YATES, MOORE Chapter 6 Random Variables 6.1 Discrete and Continuous Random Variables 6. 6.3 Binomial and
Simple Random Sample
 Simple Random Sample A simple random sample (SRS) of size n consists of n elements from the population chosen in such a way that every set of n elements has an equal chance to be the sample actually selected.
SECTION 6.2 (DAY 1) TRANSFORMING RANDOM VARIABLES NOVEMBER 16 TH, 2017
 TRANSFORMING RANDOM VARIABLES NOVEMBER 16 TH, 2017") SECTION 6.2 (DAY 1) TRANSFORMING RANDOM VARIABLES NOVEMBER 16 TH, 2017 TODAY S OBJECTIVES Describe the effects of transforming a random variable by: adding or subtracting a constant multiplying or dividing
SECTION 6.2 (DAY 1) TRANSFORMING RANDOM VARIABLES NOVEMBER 16 TH, 2017 TODAY S OBJECTIVES Describe the effects of transforming a random variable by: adding or subtracting a constant multiplying or dividing
Week 7. Texas A& M University. Department of Mathematics Texas A& M University, College Station Section 3.2, 3.3 and 3.4
 Week 7 Oğuz Gezmiş Texas A& M University Department of Mathematics Texas A& M University, College Station Section 3.2, 3.3 and 3.4 Oğuz Gezmiş (TAMU) Topics in Contemporary Mathematics II Week7 1 / 19
ECON 214 Elements of Statistics for Economists 2016/2017
 ECON 214 Elements of Statistics for Economists 2016/2017 Topic The Normal Distribution Lecturer: Dr. Bernardin Senadza, Dept. of Economics bsenadza@ug.edu.gh College of Education School of Continuing and
Chapter Six Probability Distributions
 6.1 Probability Distributions Discrete Random Variable Chapter Six Probability Distributions x P(x) 2 0.08 4 0.13 6 0.25 8 0.31 10 0.16 12 0.01 Practice. Construct a probability distribution for the number
Honors Statistics. 3. Review OTL C6#6. emphasis Normal Distributions. Chapter 6 Section 2 Day s.notebook. May 05, 2016.
 Honors Statistics Aug 23-8:26 PM 3. Review OTL C6#6 emphasis Normal Distributions Aug 23-8:31 PM 1 Nov 21-8:16 PM Rainy days Imagine that we randomly select a day from the past 10 years. Let X be the recorded
Stats CH 6 Intro Activity 1
 Stats CH 6 Intro Activit 1 1. Purpose can ou tell the difference between bottled water and tap water? You will drink water from 3 samples. 1 of these is bottled water.. You must test them in the following
STUDY SET 2. Continuous Probability Distributions. ANSWER: Without continuity correction P(X>10) = P(Z>-0.66) =
 = P(Z>-0.66) =") STUDY SET 2 Continuous Probability Distributions 1. The normal distribution is used to approximate the binomial under certain conditions. What is the best way to approximate the binomial using the normal?
STUDY SET 2 Continuous Probability Distributions 1. The normal distribution is used to approximate the binomial under certain conditions. What is the best way to approximate the binomial using the normal?
Random Variables. 6.1 Discrete and Continuous Random Variables. Probability Distribution. Discrete Random Variables. Chapter 6, Section 1
 6.1 Discrete and Continuous Random Variables Random Variables A random variable, usually written as X, is a variable whose possible values are numerical outcomes of a random phenomenon. There are two types
EXERCISES FOR PRACTICE SESSION 2 OF STAT CAMP
 EXERCISES FOR PRACTICE SESSION 2 OF STAT CAMP Note 1: The exercises below that are referenced by chapter number are taken or modified from the following open-source online textbook that was adapted by
6.1 Discrete and Continuous Random Variables. 6.1A Discrete random Variables, Mean (Expected Value) of a Discrete Random Variable
 of a Discrete Random Variable") 6.1 Discrete and Continuous Random Variables 6.1A Discrete random Variables, Mean (Expected Value) of a Discrete Random Variable Random variable Takes numerical values that describe the outcomes of some
6.1 Discrete and Continuous Random Variables 6.1A Discrete random Variables, Mean (Expected Value) of a Discrete Random Variable Random variable Takes numerical values that describe the outcomes of some
Example 1: Find the equation of the line containing points (1,2) and (2,3).
 and (2,3).") Example 1: Find the equation of the line containing points (1,2) and (2,3). Example 2: The Ace Company installed a new machine in one of its factories at a cost of $20,000. The machine is depreciated linearly
Example 1: Find the equation of the line containing points (1,2) and (2,3). Example 2: The Ace Company installed a new machine in one of its factories at a cost of $20,000. The machine is depreciated linearly
Math 14 Lecture Notes Ch The Normal Approximation to the Binomial Distribution. P (X ) = nc X p X q n X =
 = nc X p X q n X =") 6.4 The Normal Approximation to the Binomial Distribution Recall from section 6.4 that g A binomial experiment is a experiment that satisfies the following four requirements: 1. Each trial can have only
6.4 The Normal Approximation to the Binomial Distribution Recall from section 6.4 that g A binomial experiment is a experiment that satisfies the following four requirements: 1. Each trial can have only
ECON 214 Elements of Statistics for Economists
 ECON 214 Elements of Statistics for Economists Session 7 The Normal Distribution Part 1 Lecturer: Dr. Bernardin Senadza, Dept. of Economics Contact Information: bsenadza@ug.edu.gh College of Education
A continuous random variable is one that can theoretically take on any value on some line interval. We use f ( x)
") Section 6-2 I. Continuous Probability Distributions A continuous random variable is one that can theoretically take on any value on some line interval. We use f ( x) to represent a probability density
Section 6-2 I. Continuous Probability Distributions A continuous random variable is one that can theoretically take on any value on some line interval. We use f ( x) to represent a probability density
Making Sense of Cents
 Name: Date: Making Sense of Cents Exploring the Central Limit Theorem Many of the variables that you have studied so far in this class have had a normal distribution. You have used a table of the normal
Section M Discrete Probability Distribution
 Section M Discrete Probability Distribution A random variable is a numerical measure of the outcome of a probability experiment, so its value is determined by chance. Random variables are typically denoted
Stat3011: Solution of Midterm Exam One
 1 Stat3011: Solution of Midterm Exam One Fall/2003, Tiefeng Jiang Name: Problem 1 (30 points). Choose one appropriate answer in each of the following questions. 1. (B ) The mean age of five people in a
AP Statistics Review Ch. 6
 AP Statistics Review Ch. 6 Name 1. Which of the following data sets is not continuous? a. The gallons of gasoline in a car. b. The time it takes to commute in a car. c. Number of goals scored by a hockey
Lecture 6: Chapter 6
 Lecture 6: Chapter 6 C C Moxley UAB Mathematics 3 October 16 6.1 Continuous Probability Distributions Last week, we discussed the binomial probability distribution, which was discrete. 6.1 Continuous Probability
Example - Let X be the number of boys in a 4 child family. Find the probability distribution table:
 Chapter8 Probability Distributions and Statistics Section 8.1 Distributions of Random Variables tthe value of the result of the probability experiment is a RANDOM VARIABLE. Example - Let X be the number
AMS7: WEEK 4. CLASS 3
 AMS7: WEEK 4. CLASS 3 Sampling distributions and estimators. Central Limit Theorem Normal Approximation to the Binomial Distribution Friday April 24th, 2015 Sampling distributions and estimators REMEMBER:
MAKING SENSE OF DATA Essentials series
 MAKING SENSE OF DATA Essentials series THE NORMAL DISTRIBUTION Copyright by City of Bradford MDC Prerequisites Descriptive statistics Charts and graphs The normal distribution Surveys and sampling Correlation
Problem Set 07 Discrete Random Variables
 Name Problem Set 07 Discrete Random Variables MULTIPLE CHOICE. Choose the one alternative that best completes the statement or answers the question. Find the mean of the random variable. 1) The random
Chapter 8. Variables. Copyright 2004 Brooks/Cole, a division of Thomson Learning, Inc.
 Chapter 8 Random Variables Copyright 2004 Brooks/Cole, a division of Thomson Learning, Inc. 8.1 What is a Random Variable? Random Variable: assigns a number to each outcome of a random circumstance, or,
Chapter 6. The Normal Probability Distributions
 Chapter 6 The Normal Probability Distributions 1 Chapter 6 Overview Introduction 6-1 Normal Probability Distributions 6-2 The Standard Normal Distribution 6-3 Applications of the Normal Distribution 6-5
Theoretical Foundations
 Theoretical Foundations Probabilities Monia Ranalli monia.ranalli@uniroma2.it Ranalli M. Theoretical Foundations - Probabilities 1 / 27 Objectives understand the probability basics quantify random phenomena
Chapter 4 Discrete Random variables
 Chapter 4 Discrete Random variables A is a variable that assumes numerical values associated with the random outcomes of an experiment, where only one numerical value is assigned to each sample point.
Day 2.notebook November 25, Warm Up Are the following probability distributions? If not, explain.
 Warm Up Are the following probability distributions? If not, explain. ANSWERS 1. 2. 3. Complete the probability distribution. Hint: Remember what all P(x) add up to? 4. Find the mean and standard deviation.
Example - Let X be the number of boys in a 4 child family. Find the probability distribution table:
 Chapter7 Probability Distributions and Statistics Distributions of Random Variables tthe value of the result of the probability experiment is a RANDOM VARIABLE. Example - Let X be the number of boys in
Example 1: Identify the following random variables as discrete or continuous: a) Weight of a package. b) Number of students in a first-grade classroom
 Weight of a package. b) Number of students in a first-grade classroom") Section 5-1 Probability Distributions I. Random Variables A variable x is a if the value that it assumes, corresponding to the of an experiment, is a or event. A random variable is if it potentially can
Section 5-1 Probability Distributions I. Random Variables A variable x is a if the value that it assumes, corresponding to the of an experiment, is a or event. A random variable is if it potentially can
AP Statistics Section 6.1 Day 1 Multiple Choice Practice. a) a random variable. b) a parameter. c) biased. d) a random sample. e) a statistic.
 a random variable. b) a parameter. c) biased. d) a random sample. e) a statistic.") A Statistics Section 6.1 Day 1 ultiple Choice ractice Name: 1. A variable whose value is a numerical outcome of a random phenomenon is called a) a random variable. b) a parameter. c) biased. d) a random
A Statistics Section 6.1 Day 1 ultiple Choice ractice Name: 1. A variable whose value is a numerical outcome of a random phenomenon is called a) a random variable. b) a parameter. c) biased. d) a random
In a binomial experiment of n trials, where p = probability of success and q = probability of failure. mean variance standard deviation
 Name In a binomial experiment of n trials, where p = probability of success and q = probability of failure mean variance standard deviation µ = n p σ = n p q σ = n p q Notation X ~ B(n, p) The probability
Density curves. (James Madison University) February 4, / 20
 February 4, / 20") Density curves Figure 6.2 p 230. A density curve is always on or above the horizontal axis, and has area exactly 1 underneath it. A density curve describes the overall pattern of a distribution. Example
Density curves Figure 6.2 p 230. A density curve is always on or above the horizontal axis, and has area exactly 1 underneath it. A density curve describes the overall pattern of a distribution. Example
***SECTION 7.1*** Discrete and Continuous Random Variables
 ***SECTION 7.1*** Discrete and Continuous Random Variables UNIT 6 ~ Random Variables Sample spaces need not consist of numbers; tossing coins yields H s and T s. However, in statistics we are most often
Section 7.5 The Normal Distribution. Section 7.6 Application of the Normal Distribution
 Section 7.6 Application of the Normal Distribution A random variable that may take on infinitely many values is called a continuous random variable. A continuous probability distribution is defined by
Counting Basics. Venn diagrams
 Counting Basics Sets Ways of specifying sets Union and intersection Universal set and complements Empty set and disjoint sets Venn diagrams Counting Inclusion-exclusion Multiplication principle Addition
CH 5 Normal Probability Distributions Properties of the Normal Distribution
 Properties of the Normal Distribution Example A friend that is always late. Let X represent the amount of minutes that pass from the moment you are suppose to meet your friend until the moment your friend
Central Limit Theorem
 Central Limit Theorem Lots of Samples 1 Homework Read Sec 6-5. Discussion Question pg 329 Do Ex 6-5 8-15 2 Objective Use the Central Limit Theorem to solve problems involving sample means 3 Sample Means
Introduction to Statistics I
 Introduction to Statistics I Keio University, Faculty of Economics Continuous random variables Simon Clinet (Keio University) Intro to Stats November 1, 2018 1 / 18 Definition (Continuous random variable)
Honors Statistics. Aug 23-8:26 PM. 1. Collect folders and materials. 2. Continue Binomial Probability. 3. Review OTL C6#11 homework
 Honors Statistics Aug 23-8:26 PM 1. Collect folders and materials 2. Continue Binomial Probability 3. Review OTL C6#11 homework 4. Binomial mean and standard deviation 5. Past Homework discussion 6. Return
Chapter 8 Homework Solutions Compiled by Joe Kahlig. speed(x) freq 25 x < x < x < x < x < x < 55 5
 freq 25 x < x < x < x < x < x < 55 5") H homework problems, C-copyright Joe Kahlig Chapter Solutions, Page Chapter Homework Solutions Compiled by Joe Kahlig. (a) finite discrete (b) infinite discrete (c) continuous (d) finite discrete (e) continuous.
H homework problems, C-copyright Joe Kahlig Chapter Solutions, Page Chapter Homework Solutions Compiled by Joe Kahlig. (a) finite discrete (b) infinite discrete (c) continuous (d) finite discrete (e) continuous.
Homework: Due Wed, Nov 3 rd Chapter 8, # 48a, 55c and 56 (count as 1), 67a
, 67a") Homework: Due Wed, Nov 3 rd Chapter 8, # 48a, 55c and 56 (count as 1), 67a Announcements: There are some office hour changes for Nov 5, 8, 9 on website Week 5 quiz begins after class today and ends at
Homework: Due Wed, Nov 3 rd Chapter 8, # 48a, 55c and 56 (count as 1), 67a Announcements: There are some office hour changes for Nov 5, 8, 9 on website Week 5 quiz begins after class today and ends at
Chapter 4 Discrete Random variables
 Chapter 4 Discrete Random variables A is a variable that assumes numerical values associated with the random outcomes of an experiment, where only one numerical value is assigned to each sample point.
1 Math 1313 Final Review Final Review for Finite. 1. Find the equation of the line containing the points 1, 2)
") Math 33 Final Review Final Review for Finite. Find the equation of the line containing the points, 2) ( and (,3) 2. 2. The Ace Company installed a new machine in one of its factories at a cost of $2,.
Math 33 Final Review Final Review for Finite. Find the equation of the line containing the points, 2) ( and (,3) 2. 2. The Ace Company installed a new machine in one of its factories at a cost of $2,.
Chapter 4. Section 4.1 Objectives. Random Variables. Random Variables. Chapter 4: Probability Distributions
 Chapter 4: Probability s 4. Probability s 4. Binomial s Section 4. Objectives Distinguish between discrete random variables and continuous random variables Construct a discrete probability distribution
Lecture 7 Random Variables
 Lecture 7 Random Variables Definition: A random variable is a variable whose value is a numerical outcome of a random phenomenon, so its values are determined by chance. We shall use letters such as X
Math 1070 Sample Exam 2 Spring 2015
 University of Connecticut Department of Mathematics Math 1070 Sample Exam 2 Spring 2015 Name: Instructor Name: Section: Exam 2 will cover Sections 4.6-4.7, 5.3-5.4, 6.1-6.4, and F.1-F.4. This sample exam
Math 160 Professor Busken Chapter 5 Worksheets
 Math 160 Professor Busken Chapter 5 Worksheets Name: 1. Find the expected value. Suppose you play a Pick 4 Lotto where you pay 50 to select a sequence of four digits, such as 2118. If you select the same
The Normal Probability Distribution
 1 The Normal Probability Distribution Key Definitions Probability Density Function: An equation used to compute probabilities for continuous random variables where the output value is greater than zero
Expected Value of a Random Variable
 Knowledge Article: Probability and Statistics Expected Value of a Random Variable Expected Value of a Discrete Random Variable You're familiar with a simple mean, or average, of a set. The mean value of
STOR 155 Introductory Statistics (Chap 5) Lecture 14: Sampling Distributions for Counts and Proportions
 Lecture 14: Sampling Distributions for Counts and Proportions") The UNIVERSITY of NORTH CAROLINA at CHAPEL HILL STOR 155 Introductory Statistics (Chap 5) Lecture 14: Sampling Distributions for Counts and Proportions 5/31/11 Lecture 14 1 Statistic & Its Sampling Distribution
The UNIVERSITY of NORTH CAROLINA at CHAPEL HILL STOR 155 Introductory Statistics (Chap 5) Lecture 14: Sampling Distributions for Counts and Proportions 5/31/11 Lecture 14 1 Statistic & Its Sampling Distribution
TOPIC: PROBABILITY DISTRIBUTIONS
 TOPIC: PROBABILITY DISTRIBUTIONS There are two types of random variables: A Discrete random variable can take on only specified, distinct values. A Continuous random variable can take on any value within
DO NOT POST THESE ANSWERS ONLINE BFW Publishers 2014
 Section 6.3 Check our Understanding, page 389: 1. Check the BINS: Binary? Success = get an ace. Failure = don t get an ace. Independent? Because you are replacing the card in the deck and shuffling each
STAT 201 Chapter 6. Distribution
 STAT 201 Chapter 6 Distribution 1 Random Variable We know variable Random Variable: a numerical measurement of the outcome of a random phenomena Capital letter refer to the random variable Lower case letters
STAT 3090 Test 2 - Version B Fall Student s Printed Name: PLEASE READ DIRECTIONS!!!!
 Student s Printed Name: Instructor: XID: Section #: Read each question very carefully. You are permitted to use a calculator on all portions of this exam. You are NOT allowed to use any textbook, notes,
Unit2: Probabilityanddistributions. 3. Normal and binomial distributions
 Announcements Unit2: Probabilityanddistributions 3. Normal and binomial distributions Sta 101 - Summer 2017 Duke University, Department of Statistical Science PS: Explain your reasoning + show your work
(c) The probability that a randomly selected driver having a California drivers license
 The probability that a randomly selected driver having a California drivers license") Statistics Test 2 Name: KEY 1 Classify each statement as an example of classical probability, empirical probability, or subjective probability (a An executive for the Krusty-O cereal factory makes an educated
Statistics Test 2 Name: KEY 1 Classify each statement as an example of classical probability, empirical probability, or subjective probability (a An executive for the Krusty-O cereal factory makes an educated
Chapter 4 Random Variables & Probability. Chapter 4.5, 6, 8 Probability Distributions for Continuous Random Variables
 Chapter 4.5, 6, 8 Probability for Continuous Random Variables Discrete vs. continuous random variables Examples of continuous distributions o Uniform o Exponential o Normal Recall: A random variable =
Answer Key: Quiz2-Chapter5: Discrete Probability Distribution
 Economics 70: Applied Business Statistics For Economics & Business (Summer 01) Answer Key: Quiz-Chapter5: Discrete Probability Distribution The number of electrical outages in a city varies from day to
Honors Statistics. Daily Agenda
 Honors Statistics Aug 23-8:26 PM Daily Agenda 3. Review 6.3 Notes Quiz Aug 23-8:31 PM 1 Jan 27-2:30 PM Dec 10-9:59 AM 2 May 15-6:15 PM in a randomly selected group of three? = = ( May 15-6:17 PM 3 5. Draw
Review of commonly missed questions on the online quiz. Lecture 7: Random variables] Expected value and standard deviation. Let s bet...
![Review of commonly missed questions on the online quiz. Lecture 7: Random variables] Expected value and standard deviation. Let s bet...](/thumbs/83/87696499.jpg "Review of commonly missed questions on the online quiz. Lecture 7: Random variables] Expected value and standard deviation. Let s bet...") Recap Review of commonly missed questions on the online quiz Lecture 7: ] Statistics 101 Mine Çetinkaya-Rundel OpenIntro quiz 2: questions 4 and 5 September 20, 2011 Statistics 101 (Mine Çetinkaya-Rundel)
Recap Review of commonly missed questions on the online quiz Lecture 7: ] Statistics 101 Mine Çetinkaya-Rundel OpenIntro quiz 2: questions 4 and 5 September 20, 2011 Statistics 101 (Mine Çetinkaya-Rundel)
 Homework Problems In each of the following situations, X is a count. Does X have a binomial distribution? Explain. 1. You observe the gender of the next 40 children born in a hospital. X is the number
MATH 227 CP 6 SHORT ANSWER. Write the word or phrase that best completes each statement or answers the question.
 MATH 227 CP 6 SHORT ANSWER. Write the word or phrase that best completes each statement or answers the question. Identify the given random variable as being discrete or continuous. 1) The number of phone
A random variable (r. v.) is a variable whose value is a numerical outcome of a random phenomenon.
 is a variable whose value is a numerical outcome of a random phenomenon.") Chapter 14: random variables p394 A random variable (r. v.) is a variable whose value is a numerical outcome of a random phenomenon. Consider the experiment of tossing a coin. Define a random variable
Chapter 14: random variables p394 A random variable (r. v.) is a variable whose value is a numerical outcome of a random phenomenon. Consider the experiment of tossing a coin. Define a random variable
Probability & Sampling The Practice of Statistics 4e Mostly Chpts 5 7
 Probability & Sampling The Practice of Statistics 4e Mostly Chpts 5 7 Lew Davidson (Dr.D.) Mallard Creek High School Lewis.Davidson@cms.k12.nc.us 704-786-0470 Probability & Sampling The Practice of Statistics
MA131 Lecture 8.2. The normal distribution curve can be considered as a probability distribution curve for normally distributed variables.
 Normal distribution curve as probability distribution curve The normal distribution curve can be considered as a probability distribution curve for normally distributed variables. The area under the normal
Chapter 3 - Lecture 3 Expected Values of Discrete Random Va
 Chapter 3 - Lecture 3 Expected Values of Discrete Random Variables October 5th, 2009 Properties of expected value Standard deviation Shortcut formula Properties of the variance Properties of expected value