Chapter 6. The Normal Probability Distributions
|
|
|
- Cornelia Cobb
- 5 years ago
- Views:
Transcription
1 Chapter 6 The Normal Probability Distributions 1
2 Chapter 6 Overview Introduction 6-1 Normal Probability Distributions 6-2 The Standard Normal Distribution 6-3 Applications of the Normal Distribution 6-5 The Normal Approximation to the Binomial Distribution 2
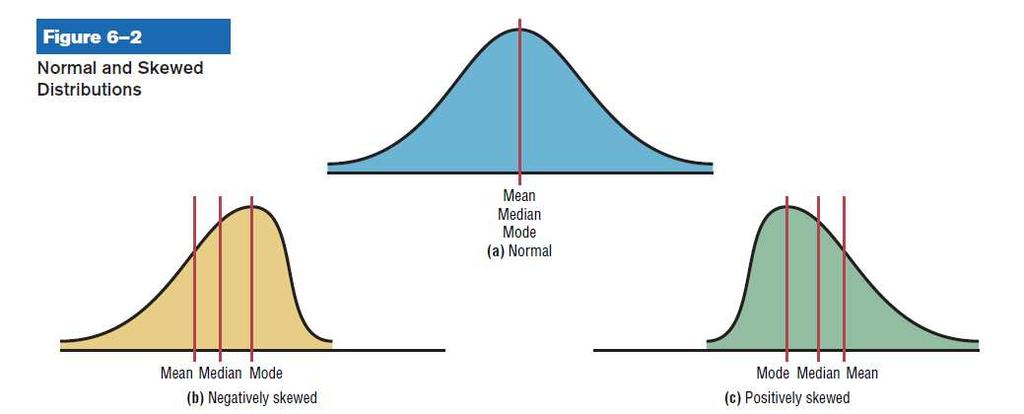
3 Types of Distributions

4 6.1 Normal Distributions Many continuous variables have distributions that are bell-shaped and are called approximately normally distributed variables. 4
5 6-1 Normal Distributions The theoretical curve, called the bell curve or the Gaussian distribution, can be used to study many variables that are not normally distributed but are approximately normal. 5
6 Normal Distributions The shape and position of the normal distribution curve depend on two parameters, the mean and the standard deviation. Each normally distributed variable has its own normal distribution curve, which depends on the values of the variable s mean and standard deviation. 6
7 Normal Distributions 7
8 Normal Distribution Properties The normal distribution curve is bell-shaped. The mean, median, and mode are equal and located at the center of the distribution. The normal distribution curve is unimodal (i.e., it has only one mode). The curve is symmetrical about the mean, which is equivalent to saying that its shape is the same on both sides of a vertical line passing through the center. 8
9 Normal Distribution Properties The curve is continuous i.e., there are no gaps or holes. For each value of X, there is a corresponding value of Y. The curve never touches the x axis. Theoretically, no matter how far in either direction the curve extends, it never meets the x axis but it gets increasingly closer. 9
10 Normal Distribution Properties The total area under the normal distribution curve is equal to 1.00 or 100%. The area under the normal curve that lies within one standard deviation of the mean is approximately 0.68 (68%). two standard deviations of the mean is approximately 0.95 (95%). three standard deviations of the mean is approximately ( 99.7%). 10

11 Normal Distribution Properties 11
12 6-2 Standard Normal Distribution Since each normally distributed variable has its own mean and standard deviation, the shape and location of these curves will vary. In practical applications, one would have to have a table of areas under the curve for each variable. To simplify this, statisticians use the standard normal distribution. The standard normal distribution is a normal distribution with a mean of 0 and a standard deviation of 1. 12
13 Standard Normal Distribution When using the empirical rule, the values of z were typically integer values; see Figure 6.3. Standard Normal Distribution According to Empirical Rule Figure 6.3
14 z score (Standard Score) The z score is the number of standard deviations that a particular X value is away from the mean. The formula for finding the z score is: z = value - mean standard deviation z = X σ µ 14
15 Looking up a z value in the Table To look up the z value of 1.39 in the table, locate the 1.3 row and the 0.09 column. Then find the corresponding value. Note: This is found in Table 3 in Appendix B
16 Looking up z values on the table Look up the following z values on the standard normal distribution table:
17 Class Activity Look up the following z values on the standard normal distribution table:

18 Area under the Standard Normal Distribution Curve 1. To the left of any z value: Look up the z value in the table and use the area given. 18

19 Ex.) 1 Area under the Curve Find the area to the left of z = The value in the 1.9 row and the.07 column of Table 3 is The area is
20 Area under the Standard Normal Distribution Curve Find the area to the left of z =
21 Area under the Standard Normal Distribution Curve Find the area to the left of z = 2.00.

22 Area under the Standard Normal Distribution Curve 2. To the right of any z value: Look up the negative of the z value. 22
23 Ex.) 2 Area under the Curve Find the area to right of z = Lookup up the negative of -1.26, which is 1.26, The value in the 1.2 row and the.06 column of Table 3 is
24 Area under the Standard Normal Distribution Curve Find the area to the right of z = 2.40.
25 Area under the Standard Normal Distribution Curve Find the area to the right of z =

26 Area under the Standard Normal Distribution Curve 3. Between two z values: Look up both z values and subtract the corresponding areas. 26

27 Ex.) 3 Area under the Curve Find the area between z = 1.64 and z = The values for z = 1.64 is.9495 and for z = is The area is =
28 Area under the Standard Normal Distribution Curve Find the area between z = 1.23 and z = 1.90.
29 Area under the Standard Normal Distribution Curve Find the area between z = and z = 1.87.
30 Probability under the Normal Distribution Curve For the Normal Distribution, probability and area are the same thing. Area to the left of a z value is the same as a probability less than a z value P(z < a) Area to the right of a z value is the same as a probability greater than a z value P(z > a) Area between two z values is the same as a probability between two z values P(a < z < b)

31 Ex.) 4 Probability Find the probability: P(0.01 < z < 2.38) The values for z = 2.38 is.9913 and for z = 0.01 is The probability is =
32 Probability under the Normal Distribution Curve Find P(-2.05 < z < 1.85)
33 Probability under the Normal Distribution Curve Find P(z > -0.5)
34 Probability under the Normal Distribution Curve Find P(-1.25< z < 0)
35 Probability under the Normal Distribution Curve Find P(z < or z > 1.54)
36 Probability under the Normal Distribution Curve Find the probabilities of the shaded regions.
37 Probability under the Normal Distribution Curve We can also find a z value if we are given an area or probability. This is called the reverse lookup problem. What we have been doing up until now is called the forward lookup problem.
38 Ex.) 5 Probability Find the z value such that the area under the standard normal distribution curve between 0 and the z value is Add.5000 to.2939 to get the cumulative area of Then look for that value inside Table 3. 38

39 Ex.) 5 Probability Add.5000 to.2939 to get the cumulative area of Then look for that value inside Table 3. The z value is
40 Probability under the Normal Distribution Curve Find the z score(s) for the corresponding area or probability: the 64 th percentile the middle 90% of the data
41 Probability under the Normal Distribution Curve Find the indicated z-score(s) indicated by the graph. Area = Area on each end =
 indicated by the graph. Area = 0.")
42 Probability under the Normal Distribution Curve Find the indicated z-score(s) indicated by the graph. Area = Area =.1093
43 Class Activity: Normal Distribution Table Find the area under the standard normal distribution curve: Find the probabilities: Find the following:
44 6-3 Applications of the Normal Distribution The standard normal distribution curve can be used to solve a wide variety of practical problems. The only requirement is that the variable be normally or approximately normally distributed. For all the problems presented in this chapter, you can assume that the variable is normally or approximately normally distributed. 44
45 Applications of the Normal Distribution To solve problems by using the standard normal distribution, transform the original variable to a standard normal distribution variable by using the z value formula. This formula transforms the values of the variable into standard units or z values. Once the variable is transformed, then the Procedure Table and Table 3 in Appendix B can be used to solve problems. 45

46 Ex.) 6 Applications of the Normal Distribution Step 1: Draw the normal distribution curve. $3.50 $
47 Ex.) 6 Applications of the Normal Distribution Step 2: Find the z value corresponding to $3.50. z = X µ = σ = 2.85 Step 3: Find the area to the left of z = Table 3 gives us an area of % of movie tickets cost less than $
48 Applications of the Normal Distribution Insurance companies have determined that US males between the ages of 16 and 24, drive an average of 10,718 miles each year with a standard deviation of 3763 miles. Assume the data is normally distributed. For a randomly selected male in that age group, find the probability that he drives less than 12,000 miles per year.

49 Ex.) 7 Applications of the Normal Distribution Step 1: Draw the normal distribution curve
50 Ex.) 7 Applications of the Normal Distribution Step 2: Find z values corresponding to 200 and z = = 0.50 z = = Step 3: Find the area between z = -2.5 and z = Table 3 gives us an area of = The probability is 30.23%. 50
51 Applications of the Normal Distribution The heights of six-year old girls are normally distributed with a mean of cm and a standard deviation of 5.52 cm. Find the probability that a randomly selected six-year girl has a height between cm and cm.
52 Ex.) 8 Applications of the Normal Distribution In a sample of 400 chocolate bars, how many will have less than 200 calories? Step 1: Draw the normal distribution curve
53 Ex.) 8 Applications of the Normal Distribution Step 2: Find the z value for 200. z = = 2.50 Step 3: Find the area to the left of z = It is Step 4: To find how many chocolate bars have less than 200 calories, multiply the sample size 400 by to get Hence, approximately 2 chocolate bars will be under 200 calories. 53

54 Ex.) 9 Applications of the Normal Distribution Step 1: Draw the normal distribution curve. 15% or

55 Ex.) 9 Applications of the Normal Distribution Step 2: Subtract to find area to the left, Look for the closest value to that in Table 3. z =
56 Ex.) 9 Applications of the Normal Distribution Step 3: Find X. X µ If we rearrange the equation z =, solving for X : σ X = µ + zσ = = ( 8) The cutoff, the lowest possible score to qualify, is
57 Applications of the Normal Distribution Students who score in the bottom 10% on a mathematics admission test at Greenville Tech are required to take a remedial math course. If the average score is 78 with a standard deviation of 6, what is the score that determines if a student does or does not take the remedial course?
58 Ex.) 10 Applications of the Normal Distribution Step 1: Draw the normal distribution curve. 17% 66% 33% 17% $
59 Ex.) 10 Applications of the Normal Distribution 17% 66% 33% 17% $6492 Area to the left of the positive z: = Using Table 3, z X = (1025) = Area to the left of the negative z: = Using Table 3, z X = (1025) = The middle 66% of readings are between $ and $
60 Applications of the Normal Distribution Papa Fred s Pizza has found that the mean time to deliver a pizza is 21.2 minutes with a standard deviation of 6.1 minutes. They want to have a guaranteed delivery time. In order to deliver 99% within the guaranteed time you need to find the time represented by the 99th percentile. What is this value?
61 Class Activity John finds that there is a scholarship available to all persons scoring in the top 5% on the ACT test. If the mean score on the ACT is 21 with a standard deviation of 4.7, what score does he need in order to qualify for the scholarship?
62 6-5 The Normal Approximation to the Binomial Distribution A normal distribution is often used to solve problems that involve the binomial distribution since when n is large (say, 100), the calculations are too difficult to do by hand using the binomial distribution. 62
63 The Normal Approximation to the Binomial Distribution The normal approximation to the binomial is appropriate when np > 5 and nq > 5. In addition, a correction for continuity must be used in the normal approximation to the binomial. The continuity correction means that for any specific value of X, say 8, the boundaries of X in the binomial distribution (in this case, 7.5 to 8.5) must be used. 63
64 The Normal Approximation to the Binomial Distribution Binomial Normal When finding: Use: P(X = a) P(a 0.5 < X < a + 0.5) P(X a) P(X > a 0.5) P(X > a) P(X > a + 0.5) P(X a) P(X < a + 0.5) P(X < a) P(X < a 0.5) P(a < X < b) P(a < X < b 0.5) P(a X b) P(a 0.5 < X < b + 0.5) For all cases, µ = np, σ = npq, np 5, nq 5
65 The Normal Approximation to the Binomial Distribution Procedure Table Step 1: Check to see whether the normal approximation can be used. Step 2: Find the mean µ and the standard deviation σ. Step 3: Write the problem in probability notation, using X. Step 4: Rewrite the problem by using the continuity correction factor, and show the corresponding area under the normal distribution. Step 5: Find the corresponding z values. Step 6: Find the solution. 65
 = 160 and nq = (400)(0.6) = 240 Since np 5 and nq 5, we can use the normal distribution. Step 2: Find the mean and standard deviation. µ = np = (400)(0.4) = 160 σ = npq = ( 0.4)( 0.")
66 Ex.) 11 Normal Approximation to the Binomial Distribution Here, p = 0.4, q = 0.6, and n = 400. Step 1: Check to see whether a normal approximation can be used. np = (400)(0.4) = 160 and nq = (400)(0.6) = 240 Since np 5 and nq 5, we can use the normal distribution. Step 2: Find the mean and standard deviation. µ = np = (400)(0.4) = 160 σ = npq = ( 0.4)( 0.6) = 66
67 Ex.) 11 Normal Approximation to the Binomial Distribution Step 3: Write in probability notation. Step 4: Rewrite using the continuity correction factor. P(X >169.5) Step 5: Find the corresponding z value z = = Step 6: Find the solution P(X 170) The area greater than the z value is = , or 16.6%. Hence, the probability that more than 170 smokers had acquired the habit of smoking by age 14 is 16.6%. 67
68 Normal Approximation to the Binomial Distribution Suppose that 30% of the vehicles in a mall parking lot belong to employees. 50 vehicles are chosen at random. Find the probability that: At most 3 belong to mall employees. At least 7 belong to mall employees.
69 Normal Approximation to the Binomial Distribution A survey indicates that 23% of US men select fishing as their favorite leisure activity. If you randomly select 100 men, find the probability that exactly two of the men liked fishing. Again, if you randomly select 100 men, find the probability that at least 2 of the men liked fishing.
70 Class Activity: Normal Approximation to the Binomial Distribution
Chapter 4. The Normal Distribution
 Chapter 4 The Normal Distribution 1 Chapter 4 Overview Introduction 4-1 Normal Distributions 4-2 Applications of the Normal Distribution 4-3 The Central Limit Theorem 4-4 The Normal Approximation to the
Math 227 Elementary Statistics. Bluman 5 th edition
 Math 227 Elementary Statistics Bluman 5 th edition CHAPTER 6 The Normal Distribution 2 Objectives Identify distributions as symmetrical or skewed. Identify the properties of the normal distribution. Find
No, because np = 100(0.02) = 2. The value of np must be greater than or equal to 5 to use the normal approximation.
 = 2. The value of np must be greater than or equal to 5 to use the normal approximation.") 1) If n 100 and p 0.02 in a binomial experiment, does this satisfy the rule for a normal approximation? Why or why not? No, because np 100(0.02) 2. The value of np must be greater than or equal to 5 to
1) If n 100 and p 0.02 in a binomial experiment, does this satisfy the rule for a normal approximation? Why or why not? No, because np 100(0.02) 2. The value of np must be greater than or equal to 5 to
Section Introduction to Normal Distributions
 Section 6.1-6.2 Introduction to Normal Distributions 2012 Pearson Education, Inc. All rights reserved. 1 of 105 Section 6.1-6.2 Objectives Interpret graphs of normal probability distributions Find areas
Lecture 9. Probability Distributions. Outline. Outline
 Outline Lecture 9 Probability Distributions 6-1 Introduction 6- Probability Distributions 6-3 Mean, Variance, and Expectation 6-4 The Binomial Distribution Outline 7- Properties of the Normal Distribution
The Normal Probability Distribution
 1 The Normal Probability Distribution Key Definitions Probability Density Function: An equation used to compute probabilities for continuous random variables where the output value is greater than zero
ECON 214 Elements of Statistics for Economists 2016/2017
 ECON 214 Elements of Statistics for Economists 2016/2017 Topic The Normal Distribution Lecturer: Dr. Bernardin Senadza, Dept. of Economics bsenadza@ug.edu.gh College of Education School of Continuing and
Lecture 9. Probability Distributions
 Lecture 9 Probability Distributions Outline 6-1 Introduction 6-2 Probability Distributions 6-3 Mean, Variance, and Expectation 6-4 The Binomial Distribution Outline 7-2 Properties of the Normal Distribution
Section 7.5 The Normal Distribution. Section 7.6 Application of the Normal Distribution
 Section 7.6 Application of the Normal Distribution A random variable that may take on infinitely many values is called a continuous random variable. A continuous probability distribution is defined by
The Normal Distribution
 5.1 Introduction to Normal Distributions and the Standard Normal Distribution Section Learning objectives: 1. How to interpret graphs of normal probability distributions 2. How to find areas under the
CH 5 Normal Probability Distributions Properties of the Normal Distribution
 Properties of the Normal Distribution Example A friend that is always late. Let X represent the amount of minutes that pass from the moment you are suppose to meet your friend until the moment your friend
Chapter Seven. The Normal Distribution
 Chapter Seven The Normal Distribution 7-1 Introduction Many continuous variables have distributions that are bellshaped and are called approximately normally distributed variables, such as the heights
Lecture 12. Some Useful Continuous Distributions. The most important continuous probability distribution in entire field of statistics.
 ENM 207 Lecture 12 Some Useful Continuous Distributions Normal Distribution The most important continuous probability distribution in entire field of statistics. Its graph, called the normal curve, is
Lecture Slides. Elementary Statistics Tenth Edition. by Mario F. Triola. and the Triola Statistics Series. Slide 1
 Lecture Slides Elementary Statistics Tenth Edition and the Triola Statistics Series by Mario F. Triola Slide 1 Chapter 6 Normal Probability Distributions 6-1 Overview 6-2 The Standard Normal Distribution
Math 14 Lecture Notes Ch The Normal Approximation to the Binomial Distribution. P (X ) = nc X p X q n X =
 = nc X p X q n X =") 6.4 The Normal Approximation to the Binomial Distribution Recall from section 6.4 that g A binomial experiment is a experiment that satisfies the following four requirements: 1. Each trial can have only
6.4 The Normal Approximation to the Binomial Distribution Recall from section 6.4 that g A binomial experiment is a experiment that satisfies the following four requirements: 1. Each trial can have only
Math 14, Homework 6.2 p. 337 # 3, 4, 9, 10, 15, 18, 19, 21, 22 Name
 Name 3. Population in U.S. Jails The average daily jail population in the United States is 706,242. If the distribution is normal and the standard deviation is 52,145, find the probability that on a randomly
ECON 214 Elements of Statistics for Economists
 ECON 214 Elements of Statistics for Economists Session 7 The Normal Distribution Part 1 Lecturer: Dr. Bernardin Senadza, Dept. of Economics Contact Information: bsenadza@ug.edu.gh College of Education
Statistics 511 Supplemental Materials
 Gaussian (or Normal) Random Variable In this section we introduce the Gaussian Random Variable, which is more commonly referred to as the Normal Random Variable. This is a random variable that has a bellshaped
MAKING SENSE OF DATA Essentials series
 MAKING SENSE OF DATA Essentials series THE NORMAL DISTRIBUTION Copyright by City of Bradford MDC Prerequisites Descriptive statistics Charts and graphs The normal distribution Surveys and sampling Correlation
Prob and Stats, Nov 7
 Prob and Stats, Nov 7 The Standard Normal Distribution Book Sections: 7.1, 7.2 Essential Questions: What is the standard normal distribution, how is it related to all other normal distributions, and how
These Statistics NOTES Belong to:
 These Statistics NOTES Belong to: Topic Notes Questions Date 1 2 3 4 5 6 REVIEW DO EVERY QUESTION IN YOUR PROVINCIAL EXAM BINDER Important Calculator Functions to know for this chapter Normal Distributions
Continuous Distributions
 Quantitative Methods 2013 Continuous Distributions 1 The most important probability distribution in statistics is the normal distribution. Carl Friedrich Gauss (1777 1855) Normal curve A normal distribution
11.5: Normal Distributions
 11.5: Normal Distributions 11.5.1 Up to now, we ve dealt with discrete random variables, variables that take on only a finite (or countably infinite we didn t do these) number of values. A continuous random
. 13. The maximum error (margin of error) of the estimate for μ (based on known σ) is:
 of the estimate for μ (based on known σ) is:") Statistics Sample Exam 3 Solution Chapters 6 & 7: Normal Probability Distributions & Estimates 1. What percent of normally distributed data value lie within 2 standard deviations to either side of the
Statistics Sample Exam 3 Solution Chapters 6 & 7: Normal Probability Distributions & Estimates 1. What percent of normally distributed data value lie within 2 standard deviations to either side of the
NORMAL RANDOM VARIABLES (Normal or gaussian distribution)
") NORMAL RANDOM VARIABLES (Normal or gaussian distribution) Many variables, as pregnancy lengths, foot sizes etc.. exhibit a normal distribution. The shape of the distribution is a symmetric bell shape.
NORMAL RANDOM VARIABLES (Normal or gaussian distribution) Many variables, as pregnancy lengths, foot sizes etc.. exhibit a normal distribution. The shape of the distribution is a symmetric bell shape.
STAT Chapter 5: Continuous Distributions. Probability distributions are used a bit differently for continuous r.v. s than for discrete r.v. s.
 STAT 515 -- Chapter 5: Continuous Distributions Probability distributions are used a bit differently for continuous r.v. s than for discrete r.v. s. Continuous distributions typically are represented by
Lecture 6: Chapter 6
 Lecture 6: Chapter 6 C C Moxley UAB Mathematics 3 October 16 6.1 Continuous Probability Distributions Last week, we discussed the binomial probability distribution, which was discrete. 6.1 Continuous Probability
Math Tech IIII, May 7
 Math Tech IIII, May 7 The Normal Probability Models Book Sections: 5.1, 5.2, & 5.3 Essential Questions: How can I use the normal distribution to compute probability? Standards: S.ID.4 Properties of the
AMS7: WEEK 4. CLASS 3
 AMS7: WEEK 4. CLASS 3 Sampling distributions and estimators. Central Limit Theorem Normal Approximation to the Binomial Distribution Friday April 24th, 2015 Sampling distributions and estimators REMEMBER:
Chapter 6: The Normal Distribution
 Chapter 6: The Normal Distribution Diana Pell Section 6.1: Normal Distributions Note: Recall that a continuous variable can assume all values between any two given values of the variables. Many continuous
MA131 Lecture 8.2. The normal distribution curve can be considered as a probability distribution curve for normally distributed variables.
 Normal distribution curve as probability distribution curve The normal distribution curve can be considered as a probability distribution curve for normally distributed variables. The area under the normal
Chapter 6: The Normal Distribution
 Chapter 6: The Normal Distribution Diana Pell Section 6.1: Normal Distributions Note: Recall that a continuous variable can assume all values between any two given values of the variables. Many continuous
Statistics (This summary is for chapters 18, 29 and section H of chapter 19)
") Statistics (This summary is for chapters 18, 29 and section H of chapter 19) Mean, Median, Mode Mode: most common value Median: middle value (when the values are in order) Mean = total how many = x n =
Statistics (This summary is for chapters 18, 29 and section H of chapter 19) Mean, Median, Mode Mode: most common value Median: middle value (when the values are in order) Mean = total how many = x n =
The normal distribution is a theoretical model derived mathematically and not empirically.
 Sociology 541 The Normal Distribution Probability and An Introduction to Inferential Statistics Normal Approximation The normal distribution is a theoretical model derived mathematically and not empirically.
Department of Quantitative Methods & Information Systems. Business Statistics. Chapter 6 Normal Probability Distribution QMIS 120. Dr.
 Department of Quantitative Methods & Information Systems Business Statistics Chapter 6 Normal Probability Distribution QMIS 120 Dr. Mohammad Zainal Chapter Goals After completing this chapter, you should
In a binomial experiment of n trials, where p = probability of success and q = probability of failure. mean variance standard deviation
 Name In a binomial experiment of n trials, where p = probability of success and q = probability of failure mean variance standard deviation µ = n p σ = n p q σ = n p q Notation X ~ B(n, p) The probability
Homework: Due Wed, Nov 3 rd Chapter 8, # 48a, 55c and 56 (count as 1), 67a
, 67a") Homework: Due Wed, Nov 3 rd Chapter 8, # 48a, 55c and 56 (count as 1), 67a Announcements: There are some office hour changes for Nov 5, 8, 9 on website Week 5 quiz begins after class today and ends at
Homework: Due Wed, Nov 3 rd Chapter 8, # 48a, 55c and 56 (count as 1), 67a Announcements: There are some office hour changes for Nov 5, 8, 9 on website Week 5 quiz begins after class today and ends at
Example - Let X be the number of boys in a 4 child family. Find the probability distribution table:
 Chapter7 Probability Distributions and Statistics Distributions of Random Variables tthe value of the result of the probability experiment is a RANDOM VARIABLE. Example - Let X be the number of boys in
Example - Let X be the number of boys in a 4 child family. Find the probability distribution table:
 Chapter8 Probability Distributions and Statistics Section 8.1 Distributions of Random Variables tthe value of the result of the probability experiment is a RANDOM VARIABLE. Example - Let X be the number
Week 7. Texas A& M University. Department of Mathematics Texas A& M University, College Station Section 3.2, 3.3 and 3.4
 Week 7 Oğuz Gezmiş Texas A& M University Department of Mathematics Texas A& M University, College Station Section 3.2, 3.3 and 3.4 Oğuz Gezmiş (TAMU) Topics in Contemporary Mathematics II Week7 1 / 19
STAT Chapter 5: Continuous Distributions. Probability distributions are used a bit differently for continuous r.v. s than for discrete r.v. s.
 STAT 515 -- Chapter 5: Continuous Distributions Probability distributions are used a bit differently for continuous r.v. s than for discrete r.v. s. Continuous distributions typically are represented by
Statistics (This summary is for chapters 17, 28, 29 and section G of chapter 19)
") Statistics (This summary is for chapters 17, 28, 29 and section G of chapter 19) Mean, Median, Mode Mode: most common value Median: middle value (when the values are in order) Mean = total how many = x
Statistics (This summary is for chapters 17, 28, 29 and section G of chapter 19) Mean, Median, Mode Mode: most common value Median: middle value (when the values are in order) Mean = total how many = x
Statistics, Measures of Central Tendency I
 Statistics, Measures of Central Tendency I We are considering a random variable X with a probability distribution which has some parameters. We want to get an idea what these parameters are. We perfom
Unit 2: Statistics Probability
 Applied Math 30 3-1: Distributions Probability Distribution: - a table or a graph that displays the theoretical probability for each outcome of an experiment. - P (any particular outcome) is between 0
Statistical Methods in Practice STAT/MATH 3379
 Statistical Methods in Practice STAT/MATH 3379 Dr. A. B. W. Manage Associate Professor of Mathematics & Statistics Department of Mathematics & Statistics Sam Houston State University Overview 6.1 Discrete
Lecture 8. The Binomial Distribution. Binomial Distribution. Binomial Distribution. Probability Distributions: Normal and Binomial
 Lecture 8 The Binomial Distribution Probability Distributions: Normal and Binomial 1 2 Binomial Distribution >A binomial experiment possesses the following properties. The experiment consists of a fixed
Density curves. (James Madison University) February 4, / 20
 February 4, / 20") Density curves Figure 6.2 p 230. A density curve is always on or above the horizontal axis, and has area exactly 1 underneath it. A density curve describes the overall pattern of a distribution. Example
Density curves Figure 6.2 p 230. A density curve is always on or above the horizontal axis, and has area exactly 1 underneath it. A density curve describes the overall pattern of a distribution. Example
MATH 104 CHAPTER 5 page 1 NORMAL DISTRIBUTION
 MATH 104 CHAPTER 5 page 1 NORMAL DISTRIBUTION We have examined discrete random variables, those random variables for which we can list the possible values. We will now look at continuous random variables.
Chapter ! Bell Shaped
 Chapter 6 6-1 Business Statistics: A First Course 5 th Edition Chapter 7 Continuous Probability Distributions Learning Objectives In this chapter, you learn:! To compute probabilities from the normal distribution!
The graph of a normal curve is symmetric with respect to the line x = µ, and has points of
 Stat 400, section 4.3 Normal Random Variables notes prepared by Tim Pilachowski Another often-useful probability density function is the normal density function, which graphs as the familiar bell-shaped
STAT 201 Chapter 6. Distribution
 STAT 201 Chapter 6 Distribution 1 Random Variable We know variable Random Variable: a numerical measurement of the outcome of a random phenomena Capital letter refer to the random variable Lower case letters
A.REPRESENTATION OF DATA
 A.REPRESENTATION OF DATA (a) GRAPHS : PART I Q: Why do we need a graph paper? Ans: You need graph paper to draw: (i) Histogram (ii) Cumulative Frequency Curve (iii) Frequency Polygon (iv) Box-and-Whisker
Examples of continuous probability distributions: The normal and standard normal
 Examples of continuous probability distributions: The normal and standard normal The Normal Distribution f(x) Changing μ shifts the distribution left or right. Changing σ increases or decreases the spread.
ECO220Y Continuous Probability Distributions: Normal Readings: Chapter 9, section 9.10
 ECO220Y Continuous Probability Distributions: Normal Readings: Chapter 9, section 9.10 Fall 2011 Lecture 8 Part 2 (Fall 2011) Probability Distributions Lecture 8 Part 2 1 / 23 Normal Density Function f
The Normal Approximation to the Binomial Distribution
 7 6 The Normal Approximation to the Binomial Distribution Objective 7. Use the normal approximation to compute probabilities for a binomial variable. The normal distribution is often used to solve problems
Statistics for Business and Economics
 Statistics for Business and Economics Chapter 5 Continuous Random Variables and Probability Distributions Ch. 5-1 Probability Distributions Probability Distributions Ch. 4 Discrete Continuous Ch. 5 Probability
2011 Pearson Education, Inc
 Statistics for Business and Economics Chapter 4 Random Variables & Probability Distributions Content 1. Two Types of Random Variables 2. Probability Distributions for Discrete Random Variables 3. The Binomial
8.2 The Standard Deviation as a Ruler Chapter 8 The Normal and Other Continuous Distributions 8-1
 8.2 The Standard Deviation as a Ruler Chapter 8 The Normal and Other Continuous Distributions For Example: On August 8, 2011, the Dow dropped 634.8 points, sending shock waves through the financial community.
Unit2: Probabilityanddistributions. 3. Normal distribution
 Announcements Unit: Probabilityanddistributions 3 Normal distribution Sta 101 - Spring 015 Duke University, Department of Statistical Science February, 015 Peer evaluation 1 by Friday 11:59pm Office hours:
PROBABILITY DISTRIBUTIONS
 CHAPTER 3 PROBABILITY DISTRIBUTIONS Page Contents 3.1 Introduction to Probability Distributions 51 3.2 The Normal Distribution 56 3.3 The Binomial Distribution 60 3.4 The Poisson Distribution 64 Exercise
Using the Central Limit Theorem It is important for you to understand when to use the CLT. If you are being asked to find the probability of the
 Using the Central Limit Theorem It is important for you to understand when to use the CLT. If you are being asked to find the probability of the mean, use the CLT for the mean. If you are being asked to
Continuous Probability Distributions
 Continuous Probability Distributions Chapter 7 McGraw-Hill/Irwin Copyright 2010 by The McGraw-Hill Companies, Inc. All rights reserved. GOALS 1. Understand the difference between discrete and continuous
MTH 245: Mathematics for Management, Life, and Social Sciences
 1/14 MTH 245: Mathematics for Management, Life, and Social Sciences Section 7.6 Section 7.6: The Normal Distribution. 2/14 The Normal Distribution. Figure: Abraham DeMoivre Section 7.6: The Normal Distribution.
MidTerm 1) Find the following (round off to one decimal place):
 Find the following (round off to one decimal place):") MidTerm 1) 68 49 21 55 57 61 70 42 59 50 66 99 Find the following (round off to one decimal place): Mean = 58:083, round off to 58.1 Median = 58 Range = max min = 99 21 = 78 St. Deviation = s = 8:535,
MidTerm 1) 68 49 21 55 57 61 70 42 59 50 66 99 Find the following (round off to one decimal place): Mean = 58:083, round off to 58.1 Median = 58 Range = max min = 99 21 = 78 St. Deviation = s = 8:535,
The Binomial Probability Distribution
 The Binomial Probability Distribution MATH 130, Elements of Statistics I J. Robert Buchanan Department of Mathematics Fall 2017 Objectives After this lesson we will be able to: determine whether a probability
Continuous Probability Distributions & Normal Distribution
 Mathematical Methods Units 3/4 Student Learning Plan Continuous Probability Distributions & Normal Distribution 7 lessons Notes: Students need practice in recognising whether a problem involves a discrete
Homework: Due Wed, Feb 20 th. Chapter 8, # 60a + 62a (count together as 1), 74, 82
, 74, 82") Announcements: Week 5 quiz begins at 4pm today and ends at 3pm on Wed If you take more than 20 minutes to complete your quiz, you will only receive partial credit. (It doesn t cut you off.) Today: Sections
Announcements: Week 5 quiz begins at 4pm today and ends at 3pm on Wed If you take more than 20 minutes to complete your quiz, you will only receive partial credit. (It doesn t cut you off.) Today: Sections
Inverse Normal Distribution and Approximation to Binomial
 Inverse Normal Distribution and Approximation to Binomial Section 5.5 Cathy Poliak, Ph.D. cathy@math.uh.edu Office in Fleming 11c Department of Mathematics University of Houston Lecture 16-3339 Cathy Poliak,
Introduction to Statistics I
 Introduction to Statistics I Keio University, Faculty of Economics Continuous random variables Simon Clinet (Keio University) Intro to Stats November 1, 2018 1 / 18 Definition (Continuous random variable)
LECTURE 6 DISTRIBUTIONS
 LECTURE 6 DISTRIBUTIONS OVERVIEW Uniform Distribution Normal Distribution Random Variables Continuous Distributions MOST OF THE SLIDES ADOPTED FROM OPENINTRO STATS BOOK. NORMAL DISTRIBUTION Unimodal and
Counting Basics. Venn diagrams
 Counting Basics Sets Ways of specifying sets Union and intersection Universal set and complements Empty set and disjoint sets Venn diagrams Counting Inclusion-exclusion Multiplication principle Addition
STAT Chapter 6 The Standard Deviation (SD) as a Ruler and The Normal Model
 as a Ruler and The Normal Model") STAT 203 - Chapter 6 The Standard Deviation (SD) as a Ruler and The Normal Model In Chapter 5, we introduced a few measures of center and spread, and discussed how the mean and standard deviation are good
STAT 203 - Chapter 6 The Standard Deviation (SD) as a Ruler and The Normal Model In Chapter 5, we introduced a few measures of center and spread, and discussed how the mean and standard deviation are good
Chapter 5. Continuous Random Variables and Probability Distributions. 5.1 Continuous Random Variables
 Chapter 5 Continuous Random Variables and Probability Distributions 5.1 Continuous Random Variables 1 2CHAPTER 5. CONTINUOUS RANDOM VARIABLES AND PROBABILITY DISTRIBUTIONS Probability Distributions Probability
Lecture 23. STAT 225 Introduction to Probability Models April 4, Whitney Huang Purdue University. Normal approximation to Binomial
 Lecture 23 STAT 225 Introduction to Probability Models April 4, 2014 approximation Whitney Huang Purdue University 23.1 Agenda 1 approximation 2 approximation 23.2 Characteristics of the random variable:
Normal Probability Distributions
 Normal Probability Distributions Properties of Normal Distributions The most important probability distribution in statistics is the normal distribution. Normal curve A normal distribution is a continuous
Data Analysis and Statistical Methods Statistics 651
 Data Analysis and Statistical Methods Statistics 651 http://www.stat.tamu.edu/~suhasini/teaching.html Suhasini Subba Rao The binomial: mean and variance Recall that the number of successes out of n, denoted
Chapter 8. Variables. Copyright 2004 Brooks/Cole, a division of Thomson Learning, Inc.
 Chapter 8 Random Variables Copyright 2004 Brooks/Cole, a division of Thomson Learning, Inc. 8.1 What is a Random Variable? Random Variable: assigns a number to each outcome of a random circumstance, or,
Expected Value of a Random Variable
 Knowledge Article: Probability and Statistics Expected Value of a Random Variable Expected Value of a Discrete Random Variable You're familiar with a simple mean, or average, of a set. The mean value of
Example. Chapter 8 Probability Distributions and Statistics Section 8.1 Distributions of Random Variables
 Chapter 8 Probability Distributions and Statistics Section 8.1 Distributions of Random Variables You are dealt a hand of 5 cards. Find the probability distribution table for the number of hearts. Graph
Chapter 4 and Chapter 5 Test Review Worksheet
 Name: Date: Hour: Chapter 4 and Chapter 5 Test Review Worksheet You must shade all provided graphs, you must round all z-scores to 2 places after the decimal, you must round all probabilities to at least
Since his score is positive, he s above average. Since his score is not close to zero, his score is unusual.
 Chapter 06: The Standard Deviation as a Ruler and the Normal Model This is the worst chapter title ever! This chapter is about the most important random variable distribution of them all the normal distribution.
Applications of Data Dispersions
 1 Applications of Data Dispersions Key Definitions Standard Deviation: The standard deviation shows how far away each value is from the mean on average. Z-Scores: The distance between the mean and a given
Discrete Probability Distribution
 1 Discrete Probability Distribution Key Definitions Discrete Random Variable: Has a countable number of values. This means that each data point is distinct and separate. Continuous Random Variable: Has
MTH 245: Mathematics for Management, Life, and Social Sciences
 1/14 MTH 245: Mathematics for Management, Life, and Social Sciences May 18, 2015 Section 7.6 Section 7.6: The Normal Distribution. 2/14 The Normal Distribution. Figure: Abraham DeMoivre Section 7.6: The
Chapter Six Probability Distributions
 6.1 Probability Distributions Discrete Random Variable Chapter Six Probability Distributions x P(x) 2 0.08 4 0.13 6 0.25 8 0.31 10 0.16 12 0.01 Practice. Construct a probability distribution for the number
CHAPTERS 5 & 6: CONTINUOUS RANDOM VARIABLES
 CHAPTERS 5 & 6: CONTINUOUS RANDOM VARIABLES DISCRETE RANDOM VARIABLE: Variable can take on only certain specified values. There are gaps between possible data values. Values may be counting numbers or
Introduction to Business Statistics QM 120 Chapter 6
 DEPARTMENT OF QUANTITATIVE METHODS & INFORMATION SYSTEMS Introduction to Business Statistics QM 120 Chapter 6 Spring 2008 Chapter 6: Continuous Probability Distribution 2 When a RV x is discrete, we can
Standard Normal, Inverse Normal and Sampling Distributions
 Standard Normal, Inverse Normal and Sampling Distributions Section 5.5 & 6.6 Cathy Poliak, Ph.D. cathy@math.uh.edu Office in Fleming 11c Department of Mathematics University of Houston Lecture 9-3339 Cathy
MAS1403. Quantitative Methods for Business Management. Semester 1, Module leader: Dr. David Walshaw
 MAS1403 Quantitative Methods for Business Management Semester 1, 2018 2019 Module leader: Dr. David Walshaw Additional lecturers: Dr. James Waldren and Dr. Stuart Hall Announcements: Written assignment
Lecture 5 - Continuous Distributions
 Lecture 5 - Continuous Distributions Statistics 102 Colin Rundel January 30, 2013 Announcements Announcements HW1 and Lab 1 have been graded and your scores are posted in Gradebook on Sakai (it is good
Normal distribution. We say that a random variable X follows the normal distribution if the probability density function of X is given by
 Normal distribution The normal distribution is the most important distribution. It describes well the distribution of random variables that arise in practice, such as the heights or weights of people,
The Normal Distribution
 Stat 6 Introduction to Business Statistics I Spring 009 Professor: Dr. Petrutza Caragea Section A Tuesdays and Thursdays 9:300:50 a.m. Chapter, Section.3 The Normal Distribution Density Curves So far we
Chapter 5 Normal Probability Distributions
 Chapter 5 Normal Probability Distributions Section 5-1 Introduction to Normal Distributions and the Standard Normal Distribution A The normal distribution is the most important of the continuous probability
The Uniform Distribution
 The Uniform Distribution EXAMPLE 1 The previous problem is an example of the uniform probability distribution. Illustrate the uniform distribution. The data that follows are 55 smiling times, in seconds,
Review of commonly missed questions on the online quiz. Lecture 7: Random variables] Expected value and standard deviation. Let s bet...
![Review of commonly missed questions on the online quiz. Lecture 7: Random variables] Expected value and standard deviation. Let s bet...](/thumbs/83/87696499.jpg "Review of commonly missed questions on the online quiz. Lecture 7: Random variables] Expected value and standard deviation. Let s bet...") Recap Review of commonly missed questions on the online quiz Lecture 7: ] Statistics 101 Mine Çetinkaya-Rundel OpenIntro quiz 2: questions 4 and 5 September 20, 2011 Statistics 101 (Mine Çetinkaya-Rundel)
Recap Review of commonly missed questions on the online quiz Lecture 7: ] Statistics 101 Mine Çetinkaya-Rundel OpenIntro quiz 2: questions 4 and 5 September 20, 2011 Statistics 101 (Mine Çetinkaya-Rundel)
Collaborative Statistics Using Spreadsheets. Chapter 6
 Collaborative Statistics Using Spreadsheets This document is attributed to OpenStax-CNX Chapter 6 Open Assembly Edition Open Assembly editions of open textbooks are disaggregated versions designed to facilitate
CHAPTER 6. ' From the table the z value corresponding to this value Z = 1.96 or Z = 1.96 (d) P(Z >?) =
 P(Z >?) =") Solutions to End-of-Section and Chapter Review Problems 225 CHAPTER 6 6.1 (a) P(Z < 1.20) = 0.88493 P(Z > 1.25) = 1 0.89435 = 0.10565 P(1.25 < Z < 1.70) = 0.95543 0.89435 = 0.06108 (d) P(Z < 1.25) or Z
Solutions to End-of-Section and Chapter Review Problems 225 CHAPTER 6 6.1 (a) P(Z < 1.20) = 0.88493 P(Z > 1.25) = 1 0.89435 = 0.10565 P(1.25 < Z < 1.70) = 0.95543 0.89435 = 0.06108 (d) P(Z < 1.25) or Z
7. For the table that follows, answer the following questions: x y 1-1/4 2-1/2 3-3/4 4
 7. For the table that follows, answer the following questions: x y 1-1/4 2-1/2 3-3/4 4 - Would the correlation between x and y in the table above be positive or negative? The correlation is negative. -
Section Distributions of Random Variables
 Section 8.1 - Distributions of Random Variables Definition: A random variable is a rule that assigns a number to each outcome of an experiment. Example 1: Suppose we toss a coin three times. Then we could