These Statistics NOTES Belong to:
|
|
|
- Leonard Benson
- 5 years ago
- Views:
Transcription
1 These Statistics NOTES Belong to: Topic Notes Questions Date REVIEW DO EVERY QUESTION IN YOUR PROVINCIAL EXAM BINDER Important Calculator Functions to know for this chapter Normal Distributions Calculator function What it finds. Key words to look for: Cdfnorm(leftmost#, rightmost#, mean, standard deviation) Invnorm(probability, mean, standard deviation) Binomial Distribution Probability (Area under the curve) Z-score or cut off value that cuts of leftmost area. Normal distribution, what is the probability? Normal distribution, what value cuts off the first 30% under the curve? Calculator function What it finds. Key words to look for PdfBin(# of choices, probability, exact # out of total) Probability of a single event Binomial distribution, Find the probability of exactly 9 out of 20 heads. CdfBin(# of choices, probability, up to how many out of total) Cumulative probability Binomial distribution, Find the probability of at most 9 out of 20 heads. Cdfnorm(leftmost#-0.5, rightmost#+0.5, mean, standard deviation) Probability of a single event of cumulative Normal approximation to the binomial. Math12principles/tspraynotes/2005/copyright tspray2005 1
2 Binomial Distribution Frequency Distribution Normal Distribution Probability Distribution Standard Normal Distribution Uniform Distribution What definitions and formulas should I know? A function that describes the outcomes of an experiment. A function where only 2 outcomes are possible! ie T/F or Heads/ Tails. A function often described using a table of values or a histogram, that provides the frequency for every outcome of an experiment. A probability function with mean µ and a standard deviation of σ ; the graph is symmetrical about the mean; abides by the rule. A function that provides the probability for every outcome of an experiment. A probability function with mean 0 and a standard deviation of 1; the graph is symmetrical about the mean; obeys the rule. A probability function where the probability for each event is equal. µ Pronounced Mew The mean. x Pronounced X-bar x i µ = n σ Pronounced Sigma σ = Mean Median Mode ( µ ) x i n 2 Standard Deviation The mean. x 1, x2, x3,... x n represent a population --> Remember means sum of n is size of the population Standard deviation. x 1, x2, x3,... x n represents a population µ represents the mean n represents the population size The sum of a set of numbers divided by the number of numbers in the set. The middle number when data is arranged in sequential order. The number that occurs most often in a set of numbers. A measure of the extent to which data cluster around the mean. Binomial Distribution A function where only 2 outcomes are possible! ie T/F or Heads/ Tails. For a binomial population the mean can be found by µ = np Mean µ = np n represents the population size p Probability of success Standard Deviation σ = np(1 p) σ = npq For a binomial population the standard deviation q is equal to 1-p which represents the probability of not success What is the rule? rule About 68% of the population are within 1 standard deviation of the mean; about 95% of the population are within 2 standard deviations of the mean; about 99.7% of the population are within 3 standard deviations of the mean What is a Z- Score? Z-score or Z-value µ Z = x σ A z-score is a standard deviation. More specifically, positive and negative standard deviations from the mean, 0, on the standard normal curve. Use this formation to turn values from the normal curve into z-scores. Math12principles/tspraynotes/2005/copyright tspray2005 2


3 What is a Distribution? Frequency Distribution: Is obtained by performing experiments. Experiments will vary. Probability Distributions: A probability distribution is a function that provides the probability for every outcome of an experiment. Uniform Distribution Binomial Distribution The probability of each event is equal. Example: Role a die. The uniform distribution is given below. Has a fixed number of independent and identical trials Each trial has 2 possible outcomes. (Yes or No, head or tail, pass or fail, win or lose, 2 or not a 2.) Example: Flip a coin 4 times The sample space is given below: HHHH, HHHT, HHTH, HTHH,THHH, HHTT, HTTH, TTHH, HTHT, THTH, THHT, HTTT, THTT, TTHT, HHHT, TTTT, Example: Spin a pointer. The uniform distribution is given below. The binomial distribution for the number of heads in 4 tosses of a coin is given below: The total area of the bars in each probability distribution adds to 1. Math12principles/tspraynotes/2005/copyright tspray2005 3
4 Write a question that would result in a uniform distribution. A spinner with 4 options Write a question that would result in a binomial distribution. A dice with 6 options Creating a Binomial Distribution: Flick a spinner 4 times Determine the binomial distribution of the number of times a S comes up as a table. Role a die 4 times Determine the binomial distribution of the number of times a 5 comes up as a table. Frequency Formula Probability Frequency Formula Probability 0 S s 1 P(0) = 4 C = 1 S 2 S s 3 S s 4 S s 1 P(1) = 4 C = 1 P(2) = 4 C = 1 P(3) = 4 C = 1 P(4) = 4 C = A faster way using your graphing calculator: x 1 3 Press Y=, type in P(x) = 4 C x x, Press Table, record numbers from the table. Math12principles/tspraynotes/2005/copyright tspray2005 4
5 CALCULATING MEAN AND STANDARD DEVIATION Mean Standard deviation Median Mode The mean is the sum of the measurements divided by the total number of measurements. The standard deviation is a measure of how spread out a distribution is. The median is the middle number in a set of ordered numbers. The mode is the event that occurs most often in a set of numbers. µ = σ = n X i i =1 n n i =1 (X i µ) 2 n 2,2,2,3,4,5,5,5,6 2 & 5 from the above data Frequency Frequency is the measure of how often an event occurs. The frequency of twos in the above data is 3. Determine the mean and standard deviation: 15. Find the mean of 4,5,6,7, Find the standard deviation of the numbers, 4,5,6,7,8. µ = µ = 6 Solution σ = σ = σ = 2 ( 4 6) 2 + ( 5 6) 2 + ( 6 6) 2 + ( 7 6) 2 + ( 8 6) Find the mean of 17,8,18, Find the standard deviation of the numbers 17,8,18 and Find the mean of 89,45, Find the standard deviation of the numbers 89,45 and Find the mean of 50,60,68, Find the standard deviation of the numbers, 24, 56 & 34. Math12principles/tspraynotes/2005/copyright tspray2005 5
6 Determine the mean and standard deviation for A > 0 & B > 0 : 23. Calculate the mean of A-B,A,A+B 24. Calculate the standard deviation of A-B,A,A+B µ = µ = 3A 3 µ = A n X i i =1 n = A B + A + A + B Calculate the mean of A-3,A,A+6 σ = n i =1 (X i µ) 2 n σ = B2 + B 2 3 = = 2B2 3 = B 2 3 (A B A) 2 + (A A) 2 + (A + B A) Calculate the standard deviation of A-3,A,A+6 3 A Calculate the mean of 2A+2B,2A,2A-2B 28. Calculate the standard deviation of 2A+2B,2A,2A-2B Calculate the mean of A-5B, A, A+5B 30. Calculate the standard deviation of A-5B, A, A+5B 31. Calculate the mean of A+B, 3A-2B, B+2A 32. Calculate the standard deviation of A+B, 3A-2B, B+2A OMIT 33. Calculate the mean of 2A+3B,2A-B,-2B-A 34. Calculate the standard deviation of 2A+3B,2A-B,-2B-A OMIT Math12principles/tspraynotes/2005/copyright tspray2005 6
7 Find the mean, median and mode of the following data. 2,3,4,4,4,5,6 1,1,3,4,5,6,8 0,1,2,3,4,4,14 0,0,0,0,0,4,24 0,0,1,4,15 Mean Median Mode Determine the mean and standard deviation: 50. The length and frequency of arbutus trees for a particular area in Gordon Head is given. Determine the mean and standard deviation. 51. The score and frequency for a golfer is given below. Determine the mean and standard deviation for this set of data. Length Score Frequency Frequency Find the mean. µ = µ = n X i i =1 n = 2 10 ( ) + 4 ( 12) + 8 ( 14) + 6 ( 16) Find the standard deviation. σ = σ = n i =1 (X i µ) 2 n 2 ( 10 ) ( 12 ) ( 14 ) ( 16 ) The length and frequency of arbutus trees for a particular area in Oak Bay is given. Determine the mean and standard deviation. 53. The score and frequency for a golfer is given below. Determine the mean and standard deviation for this set of data. Length Score Frequency Frequency Math12principles/tspraynotes/2005/copyright tspray2005 7
8 Solve for x students take a test and their scores are listed below. Determine the value of x if the mean score is students take a test and their scores are listed below. Determine the value of x if the mean score is 7.9. Score x Score x Frequency Frequency Fill out the mean formula and simplify 5(40) + 3(50) + 2(20) + 5(x) 30 = x 30 = 15 Cross multiply and solve for x = x 450 = x 60 = 5x x = students take a test and their scores are listed below. Determine the value of x if the mean score is 10.8 OMit students take a test and their scores are listed below. Determine the value of x if the mean score is 19.2 Score x 15 Score 14 x Frequency Frequency Math12principles/tspraynotes/2005/copyright tspray2005 8
9 58. Determine the mean, median, mode & standard deviation using your graphing calculator 59. Determine the mean, median, mode & standard deviation using your graphing calculator Score Score Frequency Frequency Press Stat Edit fill out table Press 4 operations key( this gets you to the calculator setting. Press stat choose Calc choose 1_stats type L1 type, type L2, press enter X = mean σ X = σ 60. Determine the mean, median, mode & standard deviation using your graphing calculator 61. Determine the mean, median, mode & standard deviation using your graphing calculator Score Score Frequency Frequency OMIT 62. Determine the mean, median, mode & standard deviation using your graphing calculator 63. Determine the mean, median, mode & standard deviation using your graphing calculator Score Score Frequency Frequency Math12principles/tspraynotes/2005/copyright tspray2005 9


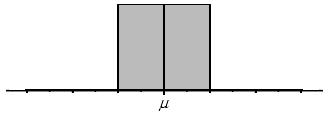
10 Standard deviation is the measure of how much the data varies. 64. Arrange the each distribution with mean, µ, in order from the greatest standard deviation to smallest standard deviation. A. B. C. D. Biggest standard deviation Smallest standard deviation 65. Each individual bar encloses the same area. Arrange the each distribution with mean, µ, in order from the greatest standard deviation to smallest standard deviation. A. B. C. D. E. F. Biggest standard deviation Smallest standard deviation Math12principles/tspraynotes/2005/copyright tspray
11 Formulas for the Mean and Standard Deviation for Binomial Distributions Mean: µ = n p Standard deviation σ = n p q Where n is the number of trials, p is the probability of success on each trial and q is the probability of failure on each trial. Find the mean and standard deviation for 66. The number of heads that occur when a coin is tossed 80 times. 67. The number of 5 s that occur when a die is rolled 120 times. 68. The number of even numbers that occur when a die is rolled 190 times. 69. The number of heads when a biased coin with P(H)=0.7 is tossed 90 times. 70. The number of heads that occur when a coin is tossed X 2 times. 71. The number of 5 s that occur when a die is rolled X 4 times. 72. The number of heads when a biased coin with P(H)=P is tossed 100 times. 73. The number of heads when a biased coin with P(H)=P 2 is tossed 80 times. 74. The number of heads that occur when a coin is tossed 270 times. 75. The number of 2 s that occur when a die is rolled 210 times. 76. The number of even numbers that occur when a die is rolled 790 times. 77. The number of heads when a biased coin with P(H)=0.7 is tossed 620 times. 78. A fair sided die is rolled 60 times. Calculate the mean of the binomial distribution for the number of times a 5 appears. 79. A fair sided die is rolled 70 times. Calculate the mean of the binomial distribution for the number of times a 3 appears. 80. A four sided die is rolled 896 times. Calculate the mean of the binomial distribution for the number of times a 2 appears. Math12principles/tspraynotes/2005/copyright tspray
12 81. A fair four-sided die is rolled n times. If the standard deviation of the number of times a 5 comes up is 12, determine the value of n. 82. A fair six-sided die is rolled n times. If the standard deviation of the number of times a 1 comes up is 20, determine the value of n. 83. A fair four-sided die is rolled n times. If the standard deviation of the number of times a 3 comes up is 18, determine the value of n. 84. A biased coin is tossed 100 times. The standard deviation for the number of heads that occurs is 3. If heads seems to be happening more than tails, determine the probability of heads. 85. A biased coin is tossed 2400 times. The standard deviation for the number of heads that occurs is 24. If heads seems to be happening more than tails, determine the probability of heads. 86. A biased coin is tossed 64 times. The standard deviation for the number of heads that occurs is 3.2. If heads seems to be happening more than tails, determine the probability of heads. σ = n p q 3 = 100 p (1 p) Square both sides 9 = 100p(1 p) Expand and solve for x 9 = 100p 100p 2 100p 2 100p + 9 = 0 Solve by factoring or use the quadratic formula. (Given Formula) x = b ± b2 4ac 2a x = ( 100) ± ( 100)2 4(100)(9) 2(100) x = x = x = ± ± = 0.9 or x = = A biased coin is tossed 96 times. The standard deviation for the number of heads that occurs is 4.8, If heads seems to be happening more than tails, determine the probability of heads. 88. A biased coin is tossed 252 times. The standard deviation for the number of heads that occurs is If heads seems to be happening more than tails, determine the probability of heads. Since heads seems to be happening more often we will assume that P(H)=0.9 and P(T)=0.1.,.6.9 Math12principles/tspraynotes/2005/copyright tspray
13 89. A biased six-sided die is rolled 80 times. If the mean of the number of times a 5 comes up is 30, determine the value of p. 90. A biased six-sided die is rolled 120 times. If the mean of the number of times a 4 comes up is 90, determine the value of p. 91. A biased six-sided die is rolled 120 times. If the mean of the number of times a 3 comes up is 30, determine the value of p. 92. A biased six-sided die is rolled 200 times. If the mean of the number of times a 5 comes up is 30, determine the value of q. 93. A biased six-sided die is rolled 180 times. If the mean of the number of times a 4 comes up is 80, determine the value of q. 94. A biased six-sided die is rolled 150 times. If the mean of the number of times a 3 comes up is 60, determine the value of q. Properties of a Normal Distribution The Normal Curve Characteristics: Smooth, bell-shaped curve. Symmetric about the mean, µ. Asymptotic tails (taper off but never touch). Marked in standard deviations, ±σ on both sides of the mean. The median, mean, mode are the same value. The area under the curve is equal to one or 100%. 68% of the population is within 1 standard deviation of the mean. 95% of the population is within 2 standard deviations of the mean. 99% of the population is within 3 standard deviations of the mean. Math12principles/tspraynotes/2005/copyright tspray
14 Find the missing percentages. Determine the percentage of the population that is represented by each section under the normal curve Use the Rule to solve the following problems. The scores on a test are normally distributed with a mean score of 300 and a standard deviation of 50. Determine the percentage of scores that lie between 200 and 400 inclusive A score is between 200 and 400? 102. If 1000 students wrote this test, how many had scores between 200 and 400? 103. A score less than 200? 104. A score between 300 and 450? 105. A score higher than 350? 106. A score less than 400? 107. A score between 200 and 300? 108. A score between 150 and 450? 109. A score between 200 and 450? 110. A score between 200 and 400? The scores on a test are normally distributed with a mean score of 200 and a standard deviation of 25. Determine the percentage of scores that lie between 150 and 225 inclusive A score is between 150 and 225? 112. If 1000 students wrote this test, how many had scores between 150 and 225? 113. a score less than 175? 114. a score between 150 and 275? 115. a score higher than 250? 116. a score less than 275? Math12principles/tspraynotes/2005/copyright tspray
15 Statisticians use the letter Z to represent the standard normal curve. 68% of the data is within 1 standard deviation of the mean. Standard Normal Curve 95% of the data is within 2 standard deviations of the mean. Characteristics Special member of the normal curve family. µ=0 & σ=1. The increments on the horizontal axis of the standard normal curve all call z- scores. A z-score describes the number of standard deviations above or below the mean. 99% of the data is within 3 standard deviations of the mean. The standard normal curve can be used to compare normal distributions. Graphing Calculator Help 117. Find the shaded area Find the z-score. Finding the area finds the percentage & probability Calculator answers this question Area=P(-1<Z<2) CdfNorm(Left Z-score, Right Zscore, µ,σ) CdfNorm(-1,2,0,1)= Statisticians use the letter Z to represent the standard normal curve. The area under the curve is equal to the probability that the z- scores are less than a. Find the 80 th percentile Calculator answers this question 0.8=P(Z<a) InverseNorm(Probability,µ,σ) InverseNorm(0.8,0,1)= Statisticians call a a z-score. A z-score cuts off a portion of the area underneath the standard normal curve. Math12principles/tspraynotes/2005/copyright tspray
16 Find the percentage of the population is shaded P(Z < 1) = 120. P(Z > 2) = 121. P( 1 < Z < 2) = Cdfnormal(Left, Right,µ, σ) Cdfnormal(-10*, -1,0, 1) Cdfnormal(Left, Right, µ, σ) Cdfnormal(-2, 10*, 0, 1) Cdfnormal(Left, Right, µ, σ) Cdfnormal(-1, 2, 0, 1) Probability= Percentage= 15.9% Probability= Percentage= 97.7% Probability= Percentage= 81.9% *99.7% of the population is between 3 and 3 standard deviations of the mean. Choosing a number smaller than 10 ensures that the lower portion of the population is enclosed. *99.7% of the population is between 3 and 3 standard deviations of the mean. Choosing a number larger than 10 ensures that the upper portion of the population is enclosed. If the mean and standard deviation are not included, cdfnormal will assume that the mean is 0 and the standard deviation is 1. Calculate the area of the shaded region under the standard normal curve as shown below P( 2 < Z < 1) = 123. P( 1 < Z < 0) = 124. P(Z < 2) = A variable, Z, is distributed as a standard normal. Determine each probability to 3 decimal places P(Z > 1) = 126. P( 2 < Z < 0) = 127. P(Z < 1) = A variable, Z, is distributed as a standard normal. Determine each probability to 3 decimal places Between -1.3 and To the left of Between -2.4 and To the right of 1.3 Math12principles/tspraynotes/2005/copyright tspray
17 Find the Z-score given the area under the curve P(Z < a) = P(Z > a) = P(a < Z < 0) = 0.43 The calculator adds the area from left to right. It can only find the left most z-score if the area to found starts from the far right. To find the z-score for the rightmost 22%, calculate the zscore for 100%-22%=78%. To find the z-score for this portion of the curve, calculate the zscore for 50%-43%=7%. Z-score=InvNorm(Probability, µ,σ) Z-score=InvNorm( 0.8, 0,1)= 0.84 Z-score=InvNorm(Probability, µ, σ) Z-score=InvNorm( , 0, 1)= 0.77 Z-score=InvNorm(Probability, µ, σ) Z-score=InvNorm( , 0, 1)= Determine the z-score P(Z < a) = P(Z < a) = P(Z < a) = P(Z > a) = P(Z > a) = P(Z > a) = P(a < Z < 0) = P(0 < Z < a) = P(0 < Z < a) = Math12principles/tspraynotes/2005/copyright tspray
18 Draw and picture and explain the meaning of the following: 147. P(Z < a) = P(Z > a) = P( a < Z < a) = 80 Find the two values that cut off the following area under the standard normal curve Find the two z-scores that cut off 153. The central 60% 154. The central 35% 155. The central 20% 156. The central 30% Determine the area under the standard normal curve to 157. To the left of To the right of Between 1.4 and Between -1.6 and To the right of To the left of To the right of To the left of -0.8 Math12principles/tspraynotes/2005/copyright tspray
19 Find the z-score P(Z < a) = P(Z < a) = P(0 < Z < a) = P(0 < Z < a) = P(Z > a) = P(Z > a) = P(a < Z < 0) = P(a < Z < 0) = P(0 < Z < a) = P(0 < Z < a) = P(Z < a) = P(Z < a) = P(a < Z < 0) = P(a < Z < 0) = P(Z > a) = P(Z > a) = For every normal distribution, about what percentage of the area under the curve is within 1 standard deviation of the mean? 182. Given a standard normal curve, determine the approximate value of P(-2<Z<2) In a population that has a normal distribution with mean µ and standard deviation σ, determine the approximate percentage of the population that lies between µ -3σ and µ +3σ. Math12principles/tspraynotes/2005/copyright tspray
20 Modeling Real Situations Using Normal Distributions Z-score Conversion Formula z = x µ σ z is the z-score X is the particular data value µ is the mean σ is the standard deviation Given the following information, solve for the unknown Find the z-score: z = 8 Subtract & simplify z = 7 8 z = Find the standard deviation: = σ Cross multiply & simplify σ = 1.4 Simplify σ = Find the mean: 1.5 = 146 µ 12 Cross multiply = 146 µ Solve for µ = µ µ = 164 Divide both sides by -1. µ = Find x: 2.8 = x Cross multiply = x 20 Add 20 to both sides = x Simplify x = The average and standard deviation to 4 different tests are given Mean is 78 & Standard deviation 4 Find Timmy s z-score if he got 81 on the test Mean is 66 & Standard deviation 6 Find Timmy s z-score if he got 58 on the test Mean is 87 & Standard deviation 3 Find Timmy s z-score if he got 89 on the test Mean is 60 & Standard deviation 2 Find Timmy s z-score if he got 55 on the test. The average and standard deviation to 4 different tests are given Mean: 58 & Standard deviation 4 What did Timmy get on the test if his z-score is Mean: 66 & Standard deviation 6 What did Timmy get on the test if his z-score is Mean: 75 & Standard deviation 3 What did Timmy get on the test if his z-score is Mean: 60 & Standard deviation 2 What did Timmy get on the test if his z-score is Math12principles/tspraynotes/2005/copyright tspray
21 The z-score and mean have been given z-score: 1.89 & mean: z-score: & mean: z-score: -2.8 & mean: z-score: 2.25& mean: 78 What is the standard deviation if Timmy got 82 on the test? What is the standard deviation if Timmy got 60 on the test? What is the standard deviation if Timmy got 48 on the test? What is the standard deviation if Timmy got 94 on the test? 200. The heights of a group of men are normally distributed with a mean height of 170 cm and a standard deviation of 9 cm. If the z-score for the height of one man is 1.8m, what is his height The heights of a group of men are normally distributed with a mean height of 190 cm and a standard deviation of 8 cm. If the z-score for the height of one man is 1.6, what is his height The scores on a test are normally distributed with a mean score of 300 and a standard deviation of 50. Determine the percentage of scores that lie between 180 and 346 inclusive. Determine: P(180 < x < 346) Solve using your graphing calculator: Cdfnormal(left, right, µ, σ)=probability Cdfnormal(180, 346, 300, 50)=0.813 Math12principles/tspraynotes/2005/copyright tspray
22 Onions at random have a mean mass of 180 grams and standard deviation of 20 grams. Assuming a normal distribution, what is the probability of choosing an onion with a mass between 100 grams and 220 grams? 203. A mass between 100 grams and 220 grams? 204. If Timmy has 80 onions, how many will weigh between 100 grams and 220 grams? 205. A mass between 100 grams and 200 grams? 206. A mass between 180 grams and 200 grams? 207. A mass between 190 grams and 250 grams? 208. A mass less than 200 grams? The volumes of mustard in bottles are normally distributed with a mean of 420 ml and a standard deviation of 3 ml. What proportion of the bottles contain less than 413mL? 209. Less than 413mL? 210. More than 419mL? 211. Find two values that cut off the central 40% 212. Find two values that cut off the central 60% 213. Find two values that cut off the central 80% The IQ scores for your class happen to be normally distributed with a mean of 110 and a standard deviation of 10. Determine the proportion that has an IQ less than Less than 115? 215. More than 84? 216. Between 88 and 112? 217. Between 98 and 112? 218. Between 98 and 122? 219. More than 126? 220. Find two values that cut off the central 50% Find two values that cut off the central 70% Find two values that cut off the central 10%. Math12principles/tspraynotes/2005/copyright tspray
23 Gigantic sheep at random have a mean mass of 200kgs and standard deviation of 60kgs. Assuming a normal distribution, what is the probability of choosing a gigantic sheep with a mass between 160kgs and 200kgs? 223. A mass between 100kgs and 200kgs? 224. If Timmy has 160 gigantic sheep, how many will weigh between 100kgs and 200kgs? 225. A mass between 110kgs and 250kgs? 226. A mass between 120kgs and 250kgs? 227. A mass between 200kgs and 250kgs? 228. A mass between 100kgs and 150kgs? 229. The mean and standard deviations are given for Biology are 63% and 18% and math is 69% and 5%. If Timmy has the same z-score in both biology and math, what is his math mark if his biology mark is 74% The mean and standard deviations are given for Biology are 60% and 9% and math is 79% and 9%. If Timmy has the same z-score in both biology and math, what is his math mark if his biology mark is 78% The mean and standard deviations are given for Biology are 70% and 20% and math is 70% and 4%. If Timmy has the same z-score in both biology and math, what is his math mark if his biology mark is 90%. Biology Z = x µ Z = σ = Math Timmy has the same z- score for math and biology. Z = x µ σ = x 69 5 x= Math12principles/tspraynotes/2005/copyright tspray
24 Find the cut off values The results for a test are normally distributed. The mean score is 70 with a standard deviation of 9. If the top 10% of the students receive an A, what is the minimum mark needed to receive an A The results for a test are normally distributed. The mean score is 70 with a standard deviation of 10. If the central 30% get a C+, determine the upper and lower cut off marks. Calculators add the area under the curve from left to right. To find the z-score for the right-most 10%, calculate the z-score for 100%-10%=90%. Z-score=InvNorm(Probability, µ, σ) Z-score=InvNorm( , 70, 9) A mean of 70 means that 50% scored lower and 50% scored higher. Left z-score InvNorm(0.35*,70,10)= Right z-score InvNorm(0.65**,70,10)= *Left most z-score cuts off the first 35% of the population. 50%-15%=35% Since 50% are less than the mean and half of the cental 30% is 15%. **Right most z-score cuts off the first 65% of the popuation. 50%+15%=65% 234. A population of scores is normally distributed with a mean of 52.4 and a standard deviation of If 30% of the scores are higher than a particular score x, calculate the value of x The diameters of oranges are normally distributed with a mean diameter of 8.5cm and a standard deviation of 0.8 cm. What is the largest diameter that would be less than 88% of the oranges? 236. A population of scores is normally distributed with a mean of 67 and a standard deviation of 12. If 30% of the scores are lower than a particular score x, calculate the value of x The diameters of oranges are normally distributed with a mean diameter of 9.5cm and a standard deviation of 0.7 cm. What is the largest diameter that would be less than 75% of the oranges? 238. A population of scores is normally distributed with a mean of 65 and a standard deviation of 7. If 80% of the scores are lower than a particular score x, calculate the value of x The diameters of oranges are normally distributed with a mean diameter of 8.5cm and a standard deviation of 0.8 cm. What diameter cuts off the largest 27.3% of the oranges? Math12principles/tspraynotes/2005/copyright tspray
25 240. Weight losses from a particular diet are normally distributed with a standard deviation of 1.2 k.g. If 58% of the weight losses are 6.5 kg or more, determine the mean weight loss Weight losses from a particular diet are normally distributed with a standard deviation of 3.2kgs. If 60% of the weight losses are 8.5 kg or more, determine the mean weight loss Weight losses from a particular diet are normally distributed with a standard deviation of 3.5kgs. If 48% of the weight losses are 2.5 kg or less, determine the mean weight loss. Write down what you know: Find the mean using: z = x µ z = 6.5 µ σ 1.2 You need to find the z-score before you can find the mean Weight losses from a particular diet are normally distributed with a standard deviation of 5kgs. If 60% of the weight losses are 12kgs or more, determine the mean weight loss Weight losses from a particular diet are normally distributed with a standard deviation of 3.5kgs. If 58% of the weight losses are 12.5kgs or less, determine the mean weight loss. InvNorm(0.42*,0,1)=-0.2 *100%-58%=42% z = x µ 0.2 = 6.5 µ σ = 6.5 µ = µ µ = 6.74 µ = 6.74 Math12principles/tspraynotes/2005/copyright tspray
 increases, the distribution looks more and more like a normal distribution.")

26 The Normal Approximation to the Binomial Distribution 245. How many heads are possible for 6 flips? 246. How many heads are possible for 14 flips? 247. How many heads are possible for 32 flips? As the number of trials(flips) increases, the distribution looks more and more like a normal distribution. If the number of trials is big enough we can use the binomial distribution/function to solve normal approximation questions. The larger the number of trials the more accurate the approximation becomes. Graphing Calculator Help NormalCDF calculator function calculates the area under the curve from left to right. Remember if we wanted to use NormalCDF that we need the following: Normalcdf(Left,Right,µ,σ). Suppose we wanted to calculate the probability of 4 heads out of 14 flips. Typing in 4 will not work because 4 will not create any area under the curve. Typing in 4 will just leave a vertical line. To solve a binomial question using the normal approximation to the binomial we need to create area for exactly 4 heads. We can do this by typing in 3.5, 4.5 which will create the desired area. A fair coin is tossed 14 times. Determine the probabilities for the following number of heads using the normal approximation of the binomial Exactly 4 heads Between 3 and 8 heads inclusively More than 9 heads. Normalcdf(Left,Right,µ,σ) Normalcdf(3.5,4.5,np, npq ) N=14, p=0.5, q=0.5 Normalcdf(3.5,4.5,7, npq ) Math12principles/tspraynotes/2005/copyright tspray


27 A fair coin is tossed 14 times. Determine the probabilities for the following number of heads using the normal approximation of the binomial Use the normal approximation to the binomial distribution to calculate the probability of correctly guessing between 10 to 14 answers inclusive on a 25 question T-F test? 258. Use the normal approximation to the binomial distribution to calculate the probability of less than 14 5 s when a die is rolled 20 times Use the normal approximation to the binomial distribution to calculate the probability of correctly guessing less than 12 answers right on a 25 question T-F test? 260. Use the normal approximation to the binomial distribution to calculate the probability of more than 18 5 s when a die is rolled 20 times Use the normal approximation to the binomial distribution to calculate the probability of correctly guessing more than 17 answers right on a 25 question T-F test? 262. Use the normal approximation to the binomial distribution to calculate the probability of between s (inclusive) when a die is rolled 20 times. Math12principles/tspraynotes/2005/copyright tspray
28 Can the normal approximation to the Binomial always be used to solve binomial distribution questions? NO Number of trials of n must be fairly large. Binomial distribution that is being approximated is fairly symmetric. The word fairly is satisfied when both np > 5 andnq > 5. Determine the following probabilities using the normal approximation to the binomial. State whether it is appropriate or not to use the normal approximation to the binomial for each question Situation: 264. Situation: 265. Situation: Coin is flipped 90 times P(H)=0.8. Coin is flipped 80 times P(H)=0.95. Coin is flipped 8800 times P(H)=0.98. Determine the probability that between 70 and 74 (inclusive) heads will occur? Determine the probability that between 50 and 76 (inclusive) heads will occur? Determine the probability that between 200 and 4900 (inclusive) heads will occur? 266. Situation: 267. Situation: 268. Situation: A fair coin is flipped 8 times. A fair coin is flipped 16 times. A fair coin is flipped 800 times. Determine the probability that between 4 and 5 (inclusive) heads will occur? Determine the probability that between 8 and 12 (inclusive) heads will occur? Determine the probability that between 200 and 400 (inclusive) heads will occur? Math12principles/tspraynotes/2005/copyright tspray
29 A multiple-choice test has 30 questions. Each question has 5 choices, only one of which is correct. If a student answers all the questions by randomly guess in, determine the probability that the student will correctly answer between 11 and 13 questions inclusive by using the following methods Use the binomial distribution to obtain this probability Use the normal approximation to obtain this probability. 74% of Math 12 students also take Physics. If 68 math 12 students are randomly selected, determine the probability that exactly 48 of these students also take physics course by using the following methods Use the binomial distribution to obtain this probability 272. Use the normal approximation to the binomial to obtain an estimate of this probability. A multiple-choice test has 60 questions. Each question has 4 choices, only one of which is correct. If a student answers all the questions by randomly guess in, determine the probability that the student will correctly answer between 14 and 15 questions inclusive by using the following methods Use the binomial distribution to obtain this probability 274. Use the normal approximation to obtain this probability. Math12principles/tspraynotes/2005/copyright tspray
30 64% of English 12 students also take English Literature. If 40 English 12 students are randomly selected, determine the probability that exactly 25 of these students also take English Literature course by using the following methods Use the binomial distribution to obtain this probability 276. Use the normal approximation to the binomial to obtain an estimate of this probability. A multiple-choice test has 40 questions. Each question has 4 choices, only one of which is correct. If a student answers all the questions by randomly guessing, determine the probability that the student will correctly answer between 15 and 17 questions inclusive by using the following methods Use the binomial distribution to obtain this probability Use the binomial distribution to obtain this probability. 54% of Math 12 students also take Physics. If 100 math 12 students are randomly selected, determine the probability that exactly 54 of these students also take physics course by using the following methods Use the binomial distribution to obtain this probability Use the normal approximation to the binomial to obtain an estimate of this probability. Math12principles/tspraynotes/2005/copyright tspray
31 The life expectancy of a car tire produced by a particular plant is normally distributed with a mean of km and a standard deviation of 3000km What percent of these tires lasts between km and km? 282. If the plant makes tires, how many tires would be expected to last more than km? The life expectancy of a car tire produced by a particular plant is normally distributed with a mean of km and a standard deviation of 5000km What percent of these tires lasts between km and km? 284. If the plant makes tires, how many tires would be expected to last more than km? The life expectancy of a car tire produced by a particular plant is normally distributed with a mean of km and a standard deviation of 3500km What percent of these tires lasts between km and km? 286. If the plant makes tires, how many tires would be expected to last more than km? Math12principles/tspraynotes/2005/copyright tspray
32 A fair die is rolled 750 times What is the mean number of (3 s) that occur in 750 rolls of a fair die? 288. Use the normal approximation to the binomial to estimate the probability of obtaining a (3) between 118 and 134 times inclusive What is the standard deviation of the number of (3 s) that occur in 750 rolls of a fair die? A fair die is rolled 950 times What is the mean number of (3 s) that occur in 950 rolls of a fair die? 291. Use the normal approximation to the binomial to estimate the probability of obtaining a (3) between 100 and 150 times inclusive What is the standard deviation of the number of (3 s) that occur in 950 rolls of a fair die? Math12principles/tspraynotes/2005/copyright tspray
33 Stats Answer Key 1. Answers may vary. Example: A pointer is spun 100 times. List all the possible probabilities. 2. Answers may vary. Example: A pointer is spun 100 times. List the probabilities for the number of S s in 100 spins. 3. Answers may vary. Example: A die is rolled 120 times. List all the possible probabilities. 4. Answers may vary. Example: A die is rolled 120 times. List the probabilities for the number of 3 s in 120 rolls A A A B 29. A B 31. 2A 32. OMIT 33. A 34. OMIT , , , , ****??? ,13,10, ,22.2,15, ,14,10, ,16.57,15???? ,15,15, ,30.67,4 64. d,a,b,c 65. a,e,c,d,b,f , , , , x 2,0.5x x 4,0.373x p, 10 p(p 1) 73. p 2 80, 4p 5(1 p 2 ) ,8.2, , , , ??? ??? ??? ??? %??? % % % % %??? % % % % % % % % % % ??? % % % % ,15.9% ,99.7% , Math12principles/tspraynotes/2005/copyright tspray
34 % of the population is less than a. a is the 90 th percentile % of the population is greater than a. a is the 30 th percentile % of the data is enclosed by a zscores ± ± ± ± ± ± ± % % % ? , ??? ??? ??? Not appropriate to use since nq< Not appropriate to use since np<5, nq< % complete tires % complete tires % tires Math12principles/tspraynotes/2005/copyright tspray

35 A variable, Z, is distributed as a standard normal. Determine the percentage of the population that is shades to 3 decimal places. Find the z-score or z-scores that cut off each percentage of the standard normal distribution. Math12principles/tspraynotes/2005/copyright tspray
36 Math12principles/tspraynotes/2005/copyright tspray
37 Good news: This booklet covers the last 10 provincial exams. Not one mistake in the answer key! Look over???? in answer key Things that will eventually be added: Definitions page Next term Answers key will be added by Tuesday or Thursday( mistakes are on their way) Text book Questions Tuesday or Thursday Formatting Next term Mixing it up review next term This booklet covers the last 10 provincial exams. Not bad for hours! Math12principles/tspraynotes/2005/copyright tspray
Chapter 6. The Normal Probability Distributions
 Chapter 6 The Normal Probability Distributions 1 Chapter 6 Overview Introduction 6-1 Normal Probability Distributions 6-2 The Standard Normal Distribution 6-3 Applications of the Normal Distribution 6-5
Math 227 Elementary Statistics. Bluman 5 th edition
 Math 227 Elementary Statistics Bluman 5 th edition CHAPTER 6 The Normal Distribution 2 Objectives Identify distributions as symmetrical or skewed. Identify the properties of the normal distribution. Find
CH 5 Normal Probability Distributions Properties of the Normal Distribution
 Properties of the Normal Distribution Example A friend that is always late. Let X represent the amount of minutes that pass from the moment you are suppose to meet your friend until the moment your friend
Lecture 9. Probability Distributions. Outline. Outline
 Outline Lecture 9 Probability Distributions 6-1 Introduction 6- Probability Distributions 6-3 Mean, Variance, and Expectation 6-4 The Binomial Distribution Outline 7- Properties of the Normal Distribution
Lecture 9. Probability Distributions
 Lecture 9 Probability Distributions Outline 6-1 Introduction 6-2 Probability Distributions 6-3 Mean, Variance, and Expectation 6-4 The Binomial Distribution Outline 7-2 Properties of the Normal Distribution
The Normal Probability Distribution
 1 The Normal Probability Distribution Key Definitions Probability Density Function: An equation used to compute probabilities for continuous random variables where the output value is greater than zero
ECON 214 Elements of Statistics for Economists 2016/2017
 ECON 214 Elements of Statistics for Economists 2016/2017 Topic The Normal Distribution Lecturer: Dr. Bernardin Senadza, Dept. of Economics bsenadza@ug.edu.gh College of Education School of Continuing and
MULTIPLE CHOICE. Choose the one alternative that best completes the statement or answers the question.
 Module 5 Test Name MULTIPLE CHOICE. Choose the one alternative that best completes the statement or answers the question. Calculate the specified probability ) Suppose that T is a random variable. Given
Week 7. Texas A& M University. Department of Mathematics Texas A& M University, College Station Section 3.2, 3.3 and 3.4
 Week 7 Oğuz Gezmiş Texas A& M University Department of Mathematics Texas A& M University, College Station Section 3.2, 3.3 and 3.4 Oğuz Gezmiş (TAMU) Topics in Contemporary Mathematics II Week7 1 / 19
Example - Let X be the number of boys in a 4 child family. Find the probability distribution table:
 Chapter8 Probability Distributions and Statistics Section 8.1 Distributions of Random Variables tthe value of the result of the probability experiment is a RANDOM VARIABLE. Example - Let X be the number
Section 7.5 The Normal Distribution. Section 7.6 Application of the Normal Distribution
 Section 7.6 Application of the Normal Distribution A random variable that may take on infinitely many values is called a continuous random variable. A continuous probability distribution is defined by
Honors Statistics. Daily Agenda
 Honors Statistics Aug 23-8:26 PM Daily Agenda Aug 23-8:31 PM 1 Write a program to generate random numbers. I've decided to give them free will. A Skip 4, 12, 16 Apr 25-10:55 AM Toss 4 times Suppose you
Data that can be any numerical value are called continuous. These are usually things that are measured, such as height, length, time, speed, etc.
 Chapter 8 Measures of Center Data that can be any numerical value are called continuous. These are usually things that are measured, such as height, length, time, speed, etc. Data that can only be integer
Lecture Slides. Elementary Statistics Tenth Edition. by Mario F. Triola. and the Triola Statistics Series. Slide 1
 Lecture Slides Elementary Statistics Tenth Edition and the Triola Statistics Series by Mario F. Triola Slide 1 Chapter 6 Normal Probability Distributions 6-1 Overview 6-2 The Standard Normal Distribution
A random variable is a quantitative variable that represents a certain
 Section 6.1 Discrete Random Variables Example: Probability Distribution, Spin the Spinners Sum of Numbers on Spinners Theoretical Probability 2 0.04 3 0.08 4 0.12 5 0.16 6 0.20 7 0.16 8 0.12 9 0.08 10
Section Distributions of Random Variables
 Section 8.1 - Distributions of Random Variables Definition: A random variable is a rule that assigns a number to each outcome of an experiment. Example 1: Suppose we toss a coin three times. Then we could
ECON 214 Elements of Statistics for Economists
 ECON 214 Elements of Statistics for Economists Session 7 The Normal Distribution Part 1 Lecturer: Dr. Bernardin Senadza, Dept. of Economics Contact Information: bsenadza@ug.edu.gh College of Education
Unit 2: Statistics Probability
 Applied Math 30 3-1: Distributions Probability Distribution: - a table or a graph that displays the theoretical probability for each outcome of an experiment. - P (any particular outcome) is between 0
MATH 118 Class Notes For Chapter 5 By: Maan Omran
 MATH 118 Class Notes For Chapter 5 By: Maan Omran Section 5.1 Central Tendency Mode: the number or numbers that occur most often. Median: the number at the midpoint of a ranked data. Ex1: The test scores
Statistics (This summary is for chapters 17, 28, 29 and section G of chapter 19)
") Statistics (This summary is for chapters 17, 28, 29 and section G of chapter 19) Mean, Median, Mode Mode: most common value Median: middle value (when the values are in order) Mean = total how many = x
Statistics (This summary is for chapters 17, 28, 29 and section G of chapter 19) Mean, Median, Mode Mode: most common value Median: middle value (when the values are in order) Mean = total how many = x
No, because np = 100(0.02) = 2. The value of np must be greater than or equal to 5 to use the normal approximation.
 = 2. The value of np must be greater than or equal to 5 to use the normal approximation.") 1) If n 100 and p 0.02 in a binomial experiment, does this satisfy the rule for a normal approximation? Why or why not? No, because np 100(0.02) 2. The value of np must be greater than or equal to 5 to
1) If n 100 and p 0.02 in a binomial experiment, does this satisfy the rule for a normal approximation? Why or why not? No, because np 100(0.02) 2. The value of np must be greater than or equal to 5 to
Statistics (This summary is for chapters 18, 29 and section H of chapter 19)
") Statistics (This summary is for chapters 18, 29 and section H of chapter 19) Mean, Median, Mode Mode: most common value Median: middle value (when the values are in order) Mean = total how many = x n =
Statistics (This summary is for chapters 18, 29 and section H of chapter 19) Mean, Median, Mode Mode: most common value Median: middle value (when the values are in order) Mean = total how many = x n =
Section Distributions of Random Variables
 Section 8.1 - Distributions of Random Variables Definition: A random variable is a rule that assigns a number to each outcome of an experiment. Example 1: Suppose we toss a coin three times. Then we could
Example - Let X be the number of boys in a 4 child family. Find the probability distribution table:
 Chapter7 Probability Distributions and Statistics Distributions of Random Variables tthe value of the result of the probability experiment is a RANDOM VARIABLE. Example - Let X be the number of boys in
The Normal Distribution
 5.1 Introduction to Normal Distributions and the Standard Normal Distribution Section Learning objectives: 1. How to interpret graphs of normal probability distributions 2. How to find areas under the
Chapter 6: Random Variables. Ch. 6-3: Binomial and Geometric Random Variables
 Chapter : Random Variables Ch. -3: Binomial and Geometric Random Variables X 0 2 3 4 5 7 8 9 0 0 P(X) 3???????? 4 4 When the same chance process is repeated several times, we are often interested in whether
Example. Chapter 8 Probability Distributions and Statistics Section 8.1 Distributions of Random Variables
 Chapter 8 Probability Distributions and Statistics Section 8.1 Distributions of Random Variables You are dealt a hand of 5 cards. Find the probability distribution table for the number of hearts. Graph
Section Introduction to Normal Distributions
 Section 6.1-6.2 Introduction to Normal Distributions 2012 Pearson Education, Inc. All rights reserved. 1 of 105 Section 6.1-6.2 Objectives Interpret graphs of normal probability distributions Find areas
Math 14 Lecture Notes Ch The Normal Approximation to the Binomial Distribution. P (X ) = nc X p X q n X =
 = nc X p X q n X =") 6.4 The Normal Approximation to the Binomial Distribution Recall from section 6.4 that g A binomial experiment is a experiment that satisfies the following four requirements: 1. Each trial can have only
6.4 The Normal Approximation to the Binomial Distribution Recall from section 6.4 that g A binomial experiment is a experiment that satisfies the following four requirements: 1. Each trial can have only
MAKING SENSE OF DATA Essentials series
 MAKING SENSE OF DATA Essentials series THE NORMAL DISTRIBUTION Copyright by City of Bradford MDC Prerequisites Descriptive statistics Charts and graphs The normal distribution Surveys and sampling Correlation
Review. What is the probability of throwing two 6s in a row with a fair die? a) b) c) d) 0.333
 b) c) d) 0.333") Review In most card games cards are dealt without replacement. What is the probability of being dealt an ace and then a 3? Choose the closest answer. a) 0.0045 b) 0.0059 c) 0.0060 d) 0.1553 Review What
Review In most card games cards are dealt without replacement. What is the probability of being dealt an ace and then a 3? Choose the closest answer. a) 0.0045 b) 0.0059 c) 0.0060 d) 0.1553 Review What
Theoretical Foundations
 Theoretical Foundations Probabilities Monia Ranalli monia.ranalli@uniroma2.it Ranalli M. Theoretical Foundations - Probabilities 1 / 27 Objectives understand the probability basics quantify random phenomena
. 13. The maximum error (margin of error) of the estimate for μ (based on known σ) is:
 of the estimate for μ (based on known σ) is:") Statistics Sample Exam 3 Solution Chapters 6 & 7: Normal Probability Distributions & Estimates 1. What percent of normally distributed data value lie within 2 standard deviations to either side of the
Statistics Sample Exam 3 Solution Chapters 6 & 7: Normal Probability Distributions & Estimates 1. What percent of normally distributed data value lie within 2 standard deviations to either side of the
2011 Pearson Education, Inc
 Statistics for Business and Economics Chapter 4 Random Variables & Probability Distributions Content 1. Two Types of Random Variables 2. Probability Distributions for Discrete Random Variables 3. The Binomial
STAT Chapter 5: Continuous Distributions. Probability distributions are used a bit differently for continuous r.v. s than for discrete r.v. s.
 STAT 515 -- Chapter 5: Continuous Distributions Probability distributions are used a bit differently for continuous r.v. s than for discrete r.v. s. Continuous distributions typically are represented by
DATA HANDLING Five-Number Summary
 DATA HANDLING Five-Number Summary The five-number summary consists of the minimum and maximum values, the median, and the upper and lower quartiles. The minimum and the maximum are the smallest and greatest
Math 227 (Statistics) Chapter 6 Practice Test MULTIPLE CHOICE. Choose the one alternative that best completes the statement or answers the question.
 Chapter 6 Practice Test MULTIPLE CHOICE. Choose the one alternative that best completes the statement or answers the question.") Math 227 (Statistics) Chapter 6 Practice Test MULTIPLE CHOICE. Choose the one alternative that best completes the statement or answers the question. Using the following uniform density curve, answer the
Math 227 (Statistics) Chapter 6 Practice Test MULTIPLE CHOICE. Choose the one alternative that best completes the statement or answers the question. Using the following uniform density curve, answer the
The normal distribution is a theoretical model derived mathematically and not empirically.
 Sociology 541 The Normal Distribution Probability and An Introduction to Inferential Statistics Normal Approximation The normal distribution is a theoretical model derived mathematically and not empirically.
Solutions for practice questions: Chapter 15, Probability Distributions If you find any errors, please let me know at
 Solutions for practice questions: Chapter 15, Probability Distributions If you find any errors, please let me know at mailto:msfrisbie@pfrisbie.com. 1. Let X represent the savings of a resident; X ~ N(3000,
MATH 264 Problem Homework I
 MATH Problem Homework I Due to December 9, 00@:0 PROBLEMS & SOLUTIONS. A student answers a multiple-choice examination question that offers four possible answers. Suppose that the probability that the
7 THE CENTRAL LIMIT THEOREM
 CHAPTER 7 THE CENTRAL LIMIT THEOREM 373 7 THE CENTRAL LIMIT THEOREM Figure 7.1 If you want to figure out the distribution of the change people carry in their pockets, using the central limit theorem and
Binomial and Normal Distributions. Example: Determine whether the following experiments are binomial experiments. Explain.
 Binomial and Normal Distributions Objective 1: Determining if an Experiment is a Binomial Experiment For an experiment to be considered a binomial experiment, four things must hold: 1. The experiment is
STAT 201 Chapter 6. Distribution
 STAT 201 Chapter 6 Distribution 1 Random Variable We know variable Random Variable: a numerical measurement of the outcome of a random phenomena Capital letter refer to the random variable Lower case letters
Binomial Distributions
 . Binomial Distributions Essential Question How can you determine the frequency of each outcome of an event? Analyzing Histograms Work with a partner. The histograms show the results when n coins are flipped.
Chapter 4. The Normal Distribution
 Chapter 4 The Normal Distribution 1 Chapter 4 Overview Introduction 4-1 Normal Distributions 4-2 Applications of the Normal Distribution 4-3 The Central Limit Theorem 4-4 The Normal Approximation to the
Chapter 6 Section 1 Day s.notebook. April 29, Honors Statistics. Aug 23-8:26 PM. 3. Review OTL C6#2. Aug 23-8:31 PM
 Honors Statistics Aug 23-8:26 PM 3. Review OTL C6#2 Aug 23-8:31 PM 1 Apr 27-9:20 AM Jan 18-2:13 PM 2 Nov 27-10:28 PM 6.1 6.2 6.3 6.4 6.5 6.6 6.7 6.8 6.9 6.10 6.11 6.12 Nov 27-9:53 PM 3 Ask about 1 and
30 Wyner Statistics Fall 2013
 30 Wyner Statistics Fall 2013 CHAPTER FIVE: DISCRETE PROBABILITY DISTRIBUTIONS Summary, Terms, and Objectives A probability distribution shows the likelihood of each possible outcome. This chapter deals
Using the Central Limit Theorem It is important for you to understand when to use the CLT. If you are being asked to find the probability of the
 Using the Central Limit Theorem It is important for you to understand when to use the CLT. If you are being asked to find the probability of the mean, use the CLT for the mean. If you are being asked to
Statistical Methods in Practice STAT/MATH 3379
 Statistical Methods in Practice STAT/MATH 3379 Dr. A. B. W. Manage Associate Professor of Mathematics & Statistics Department of Mathematics & Statistics Sam Houston State University Overview 6.1 Discrete
Normal distribution. We say that a random variable X follows the normal distribution if the probability density function of X is given by
 Normal distribution The normal distribution is the most important distribution. It describes well the distribution of random variables that arise in practice, such as the heights or weights of people,
A.REPRESENTATION OF DATA
 A.REPRESENTATION OF DATA (a) GRAPHS : PART I Q: Why do we need a graph paper? Ans: You need graph paper to draw: (i) Histogram (ii) Cumulative Frequency Curve (iii) Frequency Polygon (iv) Box-and-Whisker
Lecture 6: Chapter 6
 Lecture 6: Chapter 6 C C Moxley UAB Mathematics 3 October 16 6.1 Continuous Probability Distributions Last week, we discussed the binomial probability distribution, which was discrete. 6.1 Continuous Probability
Using the Central Limit
 Using the Central Limit Theorem By: OpenStaxCollege It is important for you to understand when to use the central limit theorem. If you are being asked to find the probability of the mean, use the clt
MidTerm 1) Find the following (round off to one decimal place):
 Find the following (round off to one decimal place):") MidTerm 1) 68 49 21 55 57 61 70 42 59 50 66 99 Find the following (round off to one decimal place): Mean = 58:083, round off to 58.1 Median = 58 Range = max min = 99 21 = 78 St. Deviation = s = 8:535,
MidTerm 1) 68 49 21 55 57 61 70 42 59 50 66 99 Find the following (round off to one decimal place): Mean = 58:083, round off to 58.1 Median = 58 Range = max min = 99 21 = 78 St. Deviation = s = 8:535,
5.2 Random Variables, Probability Histograms and Probability Distributions
 Chapter 5 5.2 Random Variables, Probability Histograms and Probability Distributions A random variable (r.v.) can be either continuous or discrete. It takes on the possible values of an experiment. It
Part V - Chance Variability
 Part V - Chance Variability Dr. Joseph Brennan Math 148, BU Dr. Joseph Brennan (Math 148, BU) Part V - Chance Variability 1 / 78 Law of Averages In Chapter 13 we discussed the Kerrich coin-tossing experiment.
Derived copy of Using the Normal Distribution *
 OpenStax-CNX module: m62375 1 Derived copy of Using the Normal Distribution * Cindy Sun Based on Using the Normal Distribution by OpenStax This work is produced by OpenStax-CNX and licensed under the Creative
STAT Chapter 5: Continuous Distributions. Probability distributions are used a bit differently for continuous r.v. s than for discrete r.v. s.
 STAT 515 -- Chapter 5: Continuous Distributions Probability distributions are used a bit differently for continuous r.v. s than for discrete r.v. s. Continuous distributions typically are represented by
4.1 Probability Distributions
 Probability and Statistics Mrs. Leahy Chapter 4: Discrete Probability Distribution ALWAYS KEEP IN MIND: The Probability of an event is ALWAYS between: and!!!! 4.1 Probability Distributions Random Variables
2017 Fall QMS102 Tip Sheet 2
 Chapter 5: Basic Probability 2017 Fall QMS102 Tip Sheet 2 (Covering Chapters 5 to 8) EVENTS -- Each possible outcome of a variable is an event, including 3 types. 1. Simple event = Described by a single
5.1 Mean, Median, & Mode
 5.1 Mean, Median, & Mode definitions Mean: Median: Mode: Example 1 The Blue Jays score these amounts of runs in their last 9 games: 4, 7, 2, 4, 10, 5, 6, 7, 7 Find the mean, median, and mode: Example 2
Chapter 3: Probability Distributions and Statistics
 Chapter 3: Probability Distributions and Statistics Section 3.-3.3 3. Random Variables and Histograms A is a rule that assigns precisely one real number to each outcome of an experiment. We usually denote
5.1 Personal Probability
 5. Probability Value Page 1 5.1 Personal Probability Although we think probability is something that is confined to math class, in the form of personal probability it is something we use to make decisions
Applied Mathematics 12 Extra Practice Exercises Chapter 3
 H E LP Applied Mathematics Extra Practice Exercises Chapter Tutorial., page 98. A bag contains 5 red balls, blue balls, and green balls. For each of the experiments described below, complete the given
Seventh Grade Spiraling Review Week 1 of Fifth Six Weeks
 Week of Fifth Six Weeks Note: Record all work in your math journal. Day An aquarium is 30 inches long, 7 inches wide and 8 inches tall. The aquarium is filled with water to a level of inches. A cubic foot
Consider the following examples: ex: let X = tossing a coin three times and counting the number of heads
 Overview Both chapters and 6 deal with a similar concept probability distributions. The difference is that chapter concerns itself with discrete probability distribution while chapter 6 covers continuous
The topics in this section are related and necessary topics for both course objectives.
 2.5 Probability Distributions The topics in this section are related and necessary topics for both course objectives. A probability distribution indicates how the probabilities are distributed for outcomes
University of California, Los Angeles Department of Statistics. Normal distribution
 University of California, Los Angeles Department of Statistics Statistics 110A Instructor: Nicolas Christou Normal distribution The normal distribution is the most important distribution. It describes
MULTIPLE CHOICE. Choose the one alternative that best completes the statement or answers the question.
 Chapter 6 Exam A Name The given values are discrete. Use the continuity correction and describe the region of the normal distribution that corresponds to the indicated probability. 1) The probability of
23.1 Probability Distributions
 3.1 Probability Distributions Essential Question: What is a probability distribution for a discrete random variable, and how can it be displayed? Explore Using Simulation to Obtain an Empirical Probability
1 Sampling Distributions
 1 Sampling Distributions 1.1 Statistics and Sampling Distributions When a random sample is selected the numerical descriptive measures calculated from such a sample are called statistics. These statistics
Probability. An intro for calculus students P= Figure 1: A normal integral
 Probability An intro for calculus students.8.6.4.2 P=.87 2 3 4 Figure : A normal integral Suppose we flip a coin 2 times; what is the probability that we get more than 2 heads? Suppose we roll a six-sided
Chapter 7 Study Guide: The Central Limit Theorem
 Chapter 7 Study Guide: The Central Limit Theorem Introduction Why are we so concerned with means? Two reasons are that they give us a middle ground for comparison and they are easy to calculate. In this
11.5: Normal Distributions
 11.5: Normal Distributions 11.5.1 Up to now, we ve dealt with discrete random variables, variables that take on only a finite (or countably infinite we didn t do these) number of values. A continuous random
Density curves. (James Madison University) February 4, / 20
 February 4, / 20") Density curves Figure 6.2 p 230. A density curve is always on or above the horizontal axis, and has area exactly 1 underneath it. A density curve describes the overall pattern of a distribution. Example
Density curves Figure 6.2 p 230. A density curve is always on or above the horizontal axis, and has area exactly 1 underneath it. A density curve describes the overall pattern of a distribution. Example
5.4 Normal Approximation of the Binomial Distribution Lesson MDM4U Jensen
 5.4 Normal Approximation of the Binomial Distribution Lesson MDM4U Jensen Review From Yesterday Bernoulli Trials have 3 properties: 1. 2. 3. Binomial Probability Distribution In a binomial experiment with
Introduction to Business Statistics QM 120 Chapter 6
 DEPARTMENT OF QUANTITATIVE METHODS & INFORMATION SYSTEMS Introduction to Business Statistics QM 120 Chapter 6 Spring 2008 Chapter 6: Continuous Probability Distribution 2 When a RV x is discrete, we can
Expected Value of a Random Variable
 Knowledge Article: Probability and Statistics Expected Value of a Random Variable Expected Value of a Discrete Random Variable You're familiar with a simple mean, or average, of a set. The mean value of
Chapter 4 Random Variables & Probability. Chapter 4.5, 6, 8 Probability Distributions for Continuous Random Variables
 Chapter 4.5, 6, 8 Probability for Continuous Random Variables Discrete vs. continuous random variables Examples of continuous distributions o Uniform o Exponential o Normal Recall: A random variable =
PROBABILITY DISTRIBUTIONS. Chapter 6
 PROBABILITY DISTRIBUTIONS Chapter 6 6.1 Summarize Possible Outcomes and their Probabilities Random Variable Random variable is numerical outcome of random phenomenon www.physics.umd.edu 3 Random Variable
Chapter 5 Normal Probability Distributions
 Chapter 5 Normal Probability Distributions Section 5-1 Introduction to Normal Distributions and the Standard Normal Distribution A The normal distribution is the most important of the continuous probability
5.4 Normal Approximation of the Binomial Distribution
 5.4 Normal Approximation of the Binomial Distribution Bernoulli Trials have 3 properties: 1. Only two outcomes - PASS or FAIL 2. n identical trials Review from yesterday. 3. Trials are independent - probability
The "bell-shaped" curve, or normal curve, is a probability distribution that describes many real-life situations.
 6.1 6.2 The Standard Normal Curve The "bell-shaped" curve, or normal curve, is a probability distribution that describes many real-life situations. Basic Properties 1. The total area under the curve is.
UNIT 4 NORMAL DISTRIBUTION: DEFINITION, CHARACTERISTICS AND PROPERTIES
 f UNIT 4 NORMAL DISTRIBUTION: DEFINITION, CHARACTERISTICS AND PROPERTIES Normal Distribution: Definition, Characteristics and Properties Structure 4.1 Introduction 4.2 Objectives 4.3 Definitions of Probability
STATISTICAL DISTRIBUTIONS AND THE CALCULATOR
 STATISTICAL DISTRIBUTIONS AND THE CALCULATOR 1. Basic data sets a. Measures of Center - Mean ( ): average of all values. Characteristic: non-resistant is affected by skew and outliers. - Median: Either
Math 14, Homework 6.2 p. 337 # 3, 4, 9, 10, 15, 18, 19, 21, 22 Name
 Name 3. Population in U.S. Jails The average daily jail population in the United States is 706,242. If the distribution is normal and the standard deviation is 52,145, find the probability that on a randomly
The Normal Distribution
 Stat 6 Introduction to Business Statistics I Spring 009 Professor: Dr. Petrutza Caragea Section A Tuesdays and Thursdays 9:300:50 a.m. Chapter, Section.3 The Normal Distribution Density Curves So far we
The Binomial Probability Distribution
 The Binomial Probability Distribution MATH 130, Elements of Statistics I J. Robert Buchanan Department of Mathematics Fall 2017 Objectives After this lesson we will be able to: determine whether a probability
Chapter 8. Binomial and Geometric Distributions
 Chapter 8 Binomial and Geometric Distributions Lesson 8-1, Part 1 Binomial Distribution What is a Binomial Distribution? Specific type of discrete probability distribution The outcomes belong to two categories
Consumer Guide Dealership Word of Mouth Internet
 8.1 Graphing Data In this chapter, we will study techniques for graphing data. We will see the importance of visually displaying large sets of data so that meaningful interpretations of the data can be
In a binomial experiment of n trials, where p = probability of success and q = probability of failure. mean variance standard deviation
 Name In a binomial experiment of n trials, where p = probability of success and q = probability of failure mean variance standard deviation µ = n p σ = n p q σ = n p q Notation X ~ B(n, p) The probability
PROBABILITY DISTRIBUTIONS
 CHAPTER 3 PROBABILITY DISTRIBUTIONS Page Contents 3.1 Introduction to Probability Distributions 51 3.2 The Normal Distribution 56 3.3 The Binomial Distribution 60 3.4 The Poisson Distribution 64 Exercise
Chapter 6: Random Variables and Probability Distributions
 Chapter 6: Random Variables and Distributions These notes reflect material from our text, Statistics, Learning from Data, First Edition, by Roxy Pec, published by CENGAGE Learning, 2015. Random variables
Section Random Variables and Histograms
 Section 3.1 - Random Variables and Histograms Definition: A random variable is a rule that assigns a number to each outcome of an experiment. Example 1: Suppose we toss a coin three times. Then we could
A random variable (r. v.) is a variable whose value is a numerical outcome of a random phenomenon.
 is a variable whose value is a numerical outcome of a random phenomenon.") Chapter 14: random variables p394 A random variable (r. v.) is a variable whose value is a numerical outcome of a random phenomenon. Consider the experiment of tossing a coin. Define a random variable
Chapter 14: random variables p394 A random variable (r. v.) is a variable whose value is a numerical outcome of a random phenomenon. Consider the experiment of tossing a coin. Define a random variable
MANAGEMENT PRINCIPLES AND STATISTICS (252 BE)
") MANAGEMENT PRINCIPLES AND STATISTICS (252 BE) Normal and Binomial Distribution Applied to Construction Management Sampling and Confidence Intervals Sr Tan Liat Choon Email: tanliatchoon@gmail.com Mobile:
MANAGEMENT PRINCIPLES AND STATISTICS (252 BE) Normal and Binomial Distribution Applied to Construction Management Sampling and Confidence Intervals Sr Tan Liat Choon Email: tanliatchoon@gmail.com Mobile:
Chapter 5 Basic Probability
 Chapter 5 Basic Probability Probability is determining the probability that a particular event will occur. Probability of occurrence = / T where = the number of ways in which a particular event occurs
AP Statistics Ch 8 The Binomial and Geometric Distributions
 Ch 8.1 The Binomial Distributions The Binomial Setting A situation where these four conditions are satisfied is called a binomial setting. 1. Each observation falls into one of just two categories, which
A random variable (r. v.) is a variable whose value is a numerical outcome of a random phenomenon.
 is a variable whose value is a numerical outcome of a random phenomenon.") Chapter 14: random variables p394 A random variable (r. v.) is a variable whose value is a numerical outcome of a random phenomenon. Consider the experiment of tossing a coin. Define a random variable
Chapter 14: random variables p394 A random variable (r. v.) is a variable whose value is a numerical outcome of a random phenomenon. Consider the experiment of tossing a coin. Define a random variable
Version A. Problem 1. Let X be the continuous random variable defined by the following pdf: 1 x/2 when 0 x 2, f(x) = 0 otherwise.
 = 0 otherwise.") Math 224 Q Exam 3A Fall 217 Tues Dec 12 Version A Problem 1. Let X be the continuous random variable defined by the following pdf: { 1 x/2 when x 2, f(x) otherwise. (a) Compute the mean µ E[X]. E[X] x
Math 224 Q Exam 3A Fall 217 Tues Dec 12 Version A Problem 1. Let X be the continuous random variable defined by the following pdf: { 1 x/2 when x 2, f(x) otherwise. (a) Compute the mean µ E[X]. E[X] x