SECTION 6.2 (DAY 1) TRANSFORMING RANDOM VARIABLES NOVEMBER 16 TH, 2017
|
|
|
- Bertina Wilkinson
- 5 years ago
- Views:
Transcription
1 SECTION 6.2 (DAY 1) TRANSFORMING RANDOM VARIABLES NOVEMBER 16 TH, 2017
2 TODAY S OBJECTIVES Describe the effects of transforming a random variable by: adding or subtracting a constant multiplying or dividing a constant Calculate the mean and standard deviation of the sum or difference of independent random variables
3 ADDING OR SUBTRACTING A CONSTANT A Adds or subtracts a to the measures of center (mean or median) and location Doesn t change the measures of spread Doesn t change shape.
4 MULTIPLYING OR DIVIDING BY A CONSTANT B Multiples or divides the measures of center and location by b Multiplies or divides measures of spread by b (such as the range, IQR, standard deviation) Doesn t change shape

5 PETE S JEEP TOURS (PG ) Pete s Jeep Tours offers a popular half-day trip in a tourist area. There must be at least 2 passengers for the trip to run, and the vehicle will hold up to 6 passengers. The number of passengers X on a randomly selected day has the following probability distribution.
6 LET S CALCULATE THE MEAN, VARIANCE, AND STANDARD DEVIATION OF THE RANDOM VARIABLE X. STEP 1: SHOW THE FORMULA YOU ARE GOING TO USE. STEP 2: SHOW WORK (SUBSTITUTION STEP). STEP 3: SHOW ANSWER. STEP 4: ANSWER THE QUESTION IN A COMPLETE SENTENCE.
7 CALCULATE AND INTERPRET THE MEAN.! SHOW ALL FORMULAS AND STEPS! Step 1: Formula Step 2: Show work Step 3: Answer. Step 4: Write. = (2)(0.15)+ (3)(0.25)+ (4)(0.35)+ (5)(0.20)+ (6)(0.05) µ X = x i µ X = 3.75 p i The mean of X is 3.75, which means that Pete expects an average of 3.75 passengers per trip in his Jeep.
8 CALCULATE THE VARIANCE. Step 1: Formula Step 2: Show work Step 3: Answer. = (2 3.75) 2 (0.15)+ (3 3.75) 2 (0.25)+ (4 3.75) 2 (0.35)+ ( ) i 2 σ = 2 X i x µ X It s ok to show an ellipsis when this step gets very long! p... + (5 3.75) 2 (0.20)+ (6 3.75) 2 (0.05) = The variance is (we only need it at this point in time to calculate the standard deviation in the next step) FYI: In probability theory and statistics, variance is the expectation of the squared deviation of a random variable from its mean. Informally, it measures how far a set of (random) numbers are spread out from their average value.
9 CALCULATE THE STANDARD DEVIATION. Step 1: Formula Step 2: Show work Step 3: Answer. Step 4: Write. σ = 2 = = ( ) i xi µ X p The standard deviation is 1.087, which means that on a randomly selected day, the number of people on a trip typically differs from the mean by about passengers.

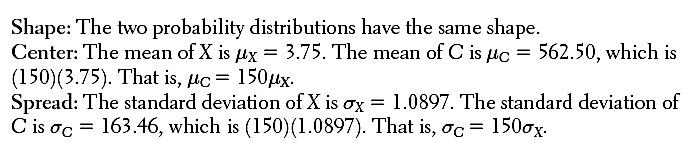
10 PETE S JEEP TOURS MULTIPLYING A RANDOM VARIABLE BY A CONSTANT Pete charges $150 per passenger. Let C = the total amount of money that Pete collects on a randomly selected trip. The probability distribution of C along with the histogram is shown: Multiply # of passengers by $150 2 passengers = $300 3 passengers = $450 4 passengers = $600 Probabilities don t change of course
11 COMPLETE (B) & (C). b) Calculate the mean, variance, and standard deviation of the random variable C. c) How do your answers from part (a) and (b) compare? Explain clearly.
12 ANSWERS
13 HOW DOES MULTIPLYING BY A CONSTANT AFFECT THE VARIANCE?

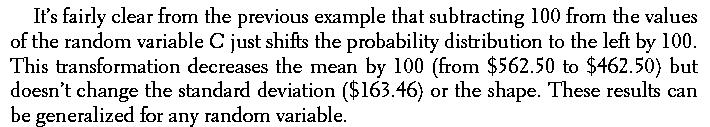
14 PETE S JEEP TOURS EFFECTS OF ADDING OR SUBTRACTING A CONSTANT It costs Pete $100 to buy permits, gas, and a ferry pass for each half-day trip. The amount of profit V that Pete makes from the trip is the total amount of money C that he collects from passengers minus $100. That is, V = C 100. $300-$100=$200 profit $450-$100=$350 profit $600-$100=$500 profit
15 COMPLETE (D) AND (E). d) Calculate the mean, variance, and standard deviation of the random variable V. e) How do your answers from part (b) and (d) compare? Explain clearly.

16 ANSWERS
17 GOOD MORNING! J 1 Turn in HW 22 2 Take out notes from last Thursday and go to Grading on a Scale. 3 Take out notebook to do warmup after we review the notes.

18 READ PG

19 The Baby and the Bathwater Example Video
20

21 GROUP WORK: SCALING A TEST Problem: In a large introductory college statistics course (STATS 101), the distribution of raw scores on a test X follows a Normal distribution with a mean of 17.2 and a standard deviation of 3.8. The professor decides to scale the scores by multiplying the raw scores by 4 and adding 10. (a) Define the variable Y to be the scaled score of a randomly selected student from this class. Find the mean and standard deviation of Y. (b) What is the probability that a randomly selected student has a scaled test score of at least 90?

22 ANSWERS a) Define the variable Y to be the scaled score of a randomly selected student from this class. Find the mean and standard deviation of Y.
23
24 SECTION 6.2 (DAY 2) COMBINING RANDOM VARIABLES & NORMAL RANDOM VARIABLES NOVEMBER 20 TH, 2017
25 TODAY S OBJECTIVES Find the mean and standard deviation of the SUM or DIFFERENCE of independent variables.

26 EXAMPLE 1: PETE S JEEPS AND ERIN S ADVENTURES Pete s sister Erin, who lives near a tourist area in another part of the country, is impressed by the success of Pete s business. She decides to join the business, running tours on the same days as Pete in her slightly smaller vehicle, under the name Erin s Adventures. After a year of steady bookings, Erin discovers that the number of passengers Y on her half-day tours has the following probability distribution. Also shown is Pete s previous probability distribution. a) What are the possible combinations of total passengers T that Pete and Erin have together on their tours on a randomly selected day? Let T = X + Y
27 A) WHAT ARE THE POSSIBLE COMBINATIONS OF TOTAL PASSENGERS T THAT PETE AND ERIN CAN HAVE TOGETHER ON THEIR TOURS ON A RANDOMLY SELECTED DAY? LET T = X + Y 2 for Pete and 2 for Erin à 4 passengers 2 for Pete and 3 for Erin à 5 passengers 2 for Pete and 4 for Erin à 6 passengers etc 6 for Pete and 4 for Erin à 10 passengers 6 for Pete and 5 for Erin à 11 passengers The total number of passengers vary between 4 (lowest) and 11 (highest).

28 Next, we need to know about the distribution of the random variable T = X + Y. We can only calculate the probabilities of the values of T if X and Y are independent events. Otherwise, we re stuck. Let s construct the probability distribution of T by listing all combinations of X and Y that yield each possible value of T and adding the corresponding probabilities, starting with the smallest possible value T = 4.
(0.2) + (0.25)(0.")
(0.1) = 0.")
29 PROBABILITY MODEL OF T (0.15)(0.2) + (0.25)(0.4) + (0.35)(0.3) = (0.05)(0.1) = 0.005
30 c) How many total passengers T will Pete and Erin have on their tours on a randomly selected day? To answer this question, we need to calculate the mean of T. METHOD 1: pi E(t) = µ T = t = (4)(0.045) + (5)(0.135)+ i... + (11)(0.005) µ T = 6.85 Pete and Erin expect an average of 6.85 passengers per tour day.
31 METHOD 2: E(t) = µ T = µ X + µ Y = µ T = 6.85 Pete and Erin expect an average of 6.85 passengers per tour day.
32 e) What is the variance of T? PLEASE NOTE: you can only add the variances of two random variables IF the random variables are independent events. METHOD 1: ( ) i 2 σ = 2 T i σ t µ T p 2 2 T = (4 6.85) σ T = ( ) ( ) 2 (0.135) ( ) (0.005)

33 METHOD 2: σ 2 = σ 2 + σ 2 = = T x y
34 What is the standard deviation of T? PLEASE NOTE: Standard deviations do not add. You must calculate the sum of the variances, then square that value. σ = =1.441 The number of people total on Pete and Erin s tours typically differs from the mean by about

35 WHAT HAPPENS IF THE EVENTS ARE NOT INDEPENDENT? Click to view video on textbook website.
36 EXAMPLE 2: Pete s and Erin s Tours $$$ Earlier, we defined X = number of passengers that Pete has and Y = number of passengers that Erin has. Pete charges $150 per passenger and Erin charges $175 per passenger. Problem: Calculate the mean and standard deviation of the total amount of money W that Pete and Erin collect on a randomly chosen day. Let C represent the amount of money that Pete collects and G represent the amount or money that Erin collects. Click for video on textbook website
37 ANSWERS C =150X G =175X µ =150(3.75) = C σ C µ = W =150(1.0897) = G µ + C µ G = =1105 W = C + G µ = 175(3.10) = G σ =175(0.943) = σ 2 = σ 2 + W C = 2 σ G 2 (163.46) + = (165.03) σ W = =
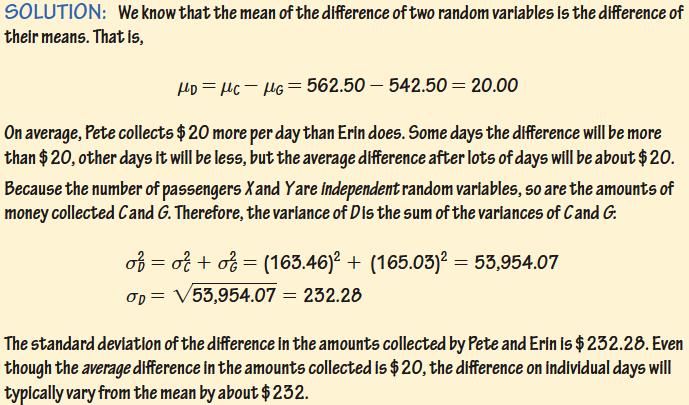
38 DIFFERENCES OF RANDOM VARIABLES a) How many more or fewer passengers D will Pete have than Erin on a randomly selected day? To answer this, we must look at the difference of passengers that Pete and Erin have, D = X Y. µ = D µ µ = = 0.65 X Y Pete averages 0.65 more passengers per day than Erin.
39 DIFFERENCES OF RANDOM VARIABLES b) C = amount of money that Pete collects and G = amount of money that Erin collects. Here are the means and standard deviations of these random variables: Problem: Calculate the mean and standard deviation of the difference D = C G in the amounts that Pete and Erin collect on a randomly chosen day. Interpret both values in context.
40
41 IN SUMMARY You can add/subtract the means of two random variables to get the sum/difference of the means. You can add the variances to get the sum of the variances. Difference of the variances = sum of the variances! You MUST calculate the sum of the variances FIRST before you calculate the sum of the standard deviation. You can NOT add standard deviations!
42 CLOSE-READING TIME BY WEDNESDAY: please READ pg We will do examples 3 and 4 IN CLASS on Wednesday.
43 QUIZ 6 ON SECTIONS 6.1 AND 6.2: TUESDAY 11/28 Updated calendar available online now
44 SECTION 6.2 (DAY 3) COMBINING RANDOM VARIABLES & NORMAL RANDOM VARIABLES WEDNESDAY, NOVEMBER 22 ND, 2017
45
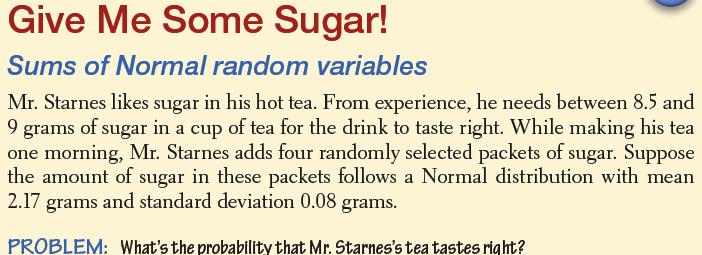
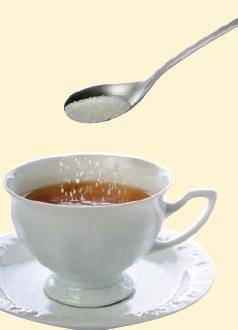
46 STEP 1: STATE VALUES OF INTEREST AND DISTRIBUTION. Let X = amount of sugar in a randomly selected packet. Let X 1 = amount of sugar in packet 1, X 2 =amount of sugar in packet 2, X 3 =amount of sugar in packet 3, and X 4 =amount of sugar in packet 4. Each of these variables has a Normal Distribution with mean 2.17 grams and standard deviation 0.08 grams. We are interested in the total amount of sugar that Mr. Starnes puts in his tea, given as T = X 1 + X 2 + X 3 + X 4 Because T is a sum of 4 independent random variables, T follows a Normal distribution with mean: And variance: And standard deviation:
47 STEP 1: STATE VALUES OF INTEREST AND DISTRIBUTION. We want to find the probability that the total amount of sugar in Mr. Starnes cup of tea is between 8.5 and 9 grams, as shown in the Normal Curve.
48 STEP 2: CALCULATIONS According to Table A, the area below z=2.00 is and the area below z=-1.13 is Therefore:
49 STEP 3: ANSWER THE QUESTION There is about an 85% chance that Mr. Starnes tea will taste right.

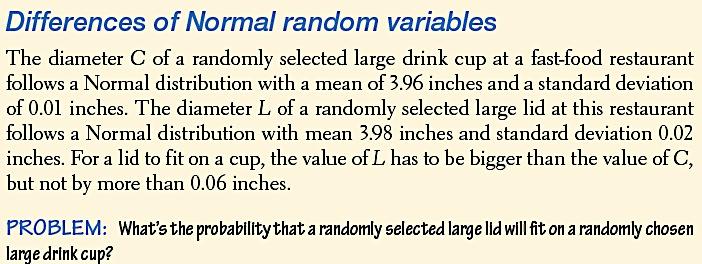
50 PUT A LID ON IT


51 STEP 1: STATE VALUES OF INTEREST AND DISTRIBUTION.
52 STEP 2: CALCULATIONS According to Table A, the area below z=1.79 is and the area below z=-0.89 is Therefore:

53 ANSWER THE QUESTION
54 HW 23 DUE TUESDAY 11/28 QUIZ 6: 11/28
Section 6.2 Transforming and Combining Random Variables. Linear Transformations
 Section 6.2 Transforming and Combining Random Variables Linear Transformations In Section 6.1, we learned that the mean and standard deviation give us important information about a random variable. In
Section 7.4 Transforming and Combining Random Variables (DAY 1)
") Section 7.4 Learning Objectives (DAY 1) After this section, you should be able to DESCRIBE the effect of performing a linear transformation on a random variable (DAY 1) COMBINE random variables and CALCULATE
Section 7.4 Learning Objectives (DAY 1) After this section, you should be able to DESCRIBE the effect of performing a linear transformation on a random variable (DAY 1) COMBINE random variables and CALCULATE
6.2.1 Linear Transformations
 6.2.1 Linear Transformations In Chapter 2, we studied the effects of transformations on the shape, center, and spread of a distribution of data. Recall what we discovered: 1. Adding (or subtracting) a
CHAPTER 6 Random Variables
 CHAPTER 6 Random Variables 6.2 Transforming and Combining Random Variables The Practice of Statistics, 5th Edition Starnes, Tabor, Yates, Moore Bedford Freeman Worth Publishers Transforming and Combining
Chapter 6: Random Variables
 Chapter 6: Random Variables Section 6.2 The Practice of Statistics, 4 th edition For AP* STARNES, YATES, MOORE Chapter 6 Random Variables 6.1 Discrete and Continuous Random Variables 6.2 6.3 Binomial and
Chapter 6: Random Variables
 Chapter 6: Random Variables Section 6.2 The Practice of Statistics, 4 th edition For AP* STARNES, YATES, MOORE Chapter 6 Random Variables 6.1 Discrete and Continuous Random Variables 6.2 6.3 Binomial and
CHAPTER 6 Random Variables
 CHAPTER 6 Random Variables 6.2 Transforming and Combining Random Variables The Practice of Statistics, 5th Edition Starnes, Tabor, Yates, Moore Bedford Freeman Worth Publishers 6.2 Reading Quiz (T or F)
Chapter 6: Random Variables
 Chapter 6: Random Variables Section 6. The Practice of Statistics, 4 th edition For AP* STARNES, YATES, MOORE Chapter 6 Random Variables 6.1 Discrete and Continuous Random Variables 6. 6.3 Binomial and
EDCC charges $50 per credit. Let T = tuition charge for a randomly-selected fulltime student. T = 50X. Tuit. T $600 $650 $700 $750 $800 $850 $900
 Chapter 7 Random Variables n 7.1 Discrete and Continuous Random Variables n 6.2 n Example: El Dorado Community College El Dorado Community College considers a student to be full-time if he or she is taking
Honors Statistics. Daily Agenda
 Honors Statistics Daily Agenda 1. Review OTL C6#5 2. Quiz Section 6.1 A-Skip 35, 39, 40 Crickets The length in inches of a cricket chosen at random from a field is a random variable X with mean 1.2 inches
Making Sense of Cents
 Name: Date: Making Sense of Cents Exploring the Central Limit Theorem Many of the variables that you have studied so far in this class have had a normal distribution. You have used a table of the normal
Honors Statistics. 3. Review OTL C6#3. 4. Normal Curve Quiz. Chapter 6 Section 2 Day s Notes.notebook. May 02, 2016.
 Honors Statistics Aug 23-8:26 PM 3. Review OTL C6#3 4. Normal Curve Quiz Aug 23-8:31 PM 1 May 1-9:09 PM Apr 28-10:29 AM 2 27, 28, 29, 30 Nov 21-8:16 PM Working out Choose a person aged 19 to 25 years at
Stats CH 6 Intro Activity 1
 Stats CH 6 Intro Activit 1 1. Purpose can ou tell the difference between bottled water and tap water? You will drink water from 3 samples. 1 of these is bottled water.. You must test them in the following
AP Stats ~ Lesson 6B: Transforming and Combining Random variables
 AP Stats ~ Lesson 6B: Transforming and Combining Random variables OBJECTIVES: DESCRIBE the effects of transforming a random variable by adding or subtracting a constant and multiplying or dividing by a
AP Statistics Chapter 6 - Random Variables
 AP Statistics Chapter 6 - Random 6.1 Discrete and Continuous Random Objective: Recognize and define discrete random variables, and construct a probability distribution table and a probability histogram
IOP 201-Q (Industrial Psychological Research) Tutorial 5
 Tutorial 5") IOP 201-Q (Industrial Psychological Research) Tutorial 5 TRUE/FALSE [1 point each] Indicate whether the sentence or statement is true or false. 1. To establish a cause-and-effect relation between two variables,
IOP 201-Q (Industrial Psychological Research) Tutorial 5 TRUE/FALSE [1 point each] Indicate whether the sentence or statement is true or false. 1. To establish a cause-and-effect relation between two variables,
Sec$on 6.1: Discrete and Con.nuous Random Variables. Tuesday, November 14 th, 2017
 Sec$on 6.1: Discrete and Con.nuous Random Variables Tuesday, November 14 th, 2017 Discrete and Continuous Random Variables Learning Objectives After this section, you should be able to: ü COMPUTE probabilities
Probability & Sampling The Practice of Statistics 4e Mostly Chpts 5 7
 Probability & Sampling The Practice of Statistics 4e Mostly Chpts 5 7 Lew Davidson (Dr.D.) Mallard Creek High School Lewis.Davidson@cms.k12.nc.us 704-786-0470 Probability & Sampling The Practice of Statistics
CHAPTER 6 Random Variables
 CHAPTER 6 Random Variables 6.1 Discrete and Continuous Random Variables The Practice of Statistics, 5th Edition Starnes, Tabor, Yates, Moore Bedford Freeman Worth Publishers Discrete and Continuous Random
MA131 Lecture 8.2. The normal distribution curve can be considered as a probability distribution curve for normally distributed variables.
 Normal distribution curve as probability distribution curve The normal distribution curve can be considered as a probability distribution curve for normally distributed variables. The area under the normal
A continuous random variable is one that can theoretically take on any value on some line interval. We use f ( x)
") Section 6-2 I. Continuous Probability Distributions A continuous random variable is one that can theoretically take on any value on some line interval. We use f ( x) to represent a probability density
Section 6-2 I. Continuous Probability Distributions A continuous random variable is one that can theoretically take on any value on some line interval. We use f ( x) to represent a probability density
Normal Model (Part 1)
") Normal Model (Part 1) Formulas New Vocabulary The Standard Deviation as a Ruler The trick in comparing very different-looking values is to use standard deviations as our rulers. The standard deviation
Normal Model (Part 1) Formulas New Vocabulary The Standard Deviation as a Ruler The trick in comparing very different-looking values is to use standard deviations as our rulers. The standard deviation
STA Module 3B Discrete Random Variables
 STA 2023 Module 3B Discrete Random Variables Learning Objectives Upon completing this module, you should be able to 1. Determine the probability distribution of a discrete random variable. 2. Construct
Found under MATH NUM
 While you wait Edit the last line of your z-score program : Disp round(z, 2) Found under MATH NUM Bluman, Chapter 6 1 Sec 6.2 Bluman, Chapter 6 2 Bluman, Chapter 6 3 6.2 Applications of the Normal Distributions
Honors Statistics. Daily Agenda
 Honors Statistics Aug 23-8:26 PM Daily Agenda 1. Review OTL C6#4 Chapter 6.2 rules for means and variances Aug 23-8:31 PM 1 Nov 21-8:16 PM Working out Choose a person aged 19 to 25 years at random and
STA Rev. F Learning Objectives. What is a Random Variable? Module 5 Discrete Random Variables
 STA 2023 Module 5 Discrete Random Variables Learning Objectives Upon completing this module, you should be able to: 1. Determine the probability distribution of a discrete random variable. 2. Construct
As you draw random samples of size n, as n increases, the sample means tend to be normally distributed.
 The Central Limit Theorem The central limit theorem (clt for short) is one of the most powerful and useful ideas in all of statistics. The clt says that if we collect samples of size n with a "large enough
Math 140 Introductory Statistics. First midterm September
 Math 140 Introductory Statistics First midterm September 23 2010 Box Plots Graphical display of 5 number summary Q1, Q2 (median), Q3, max, min Outliers If a value is more than 1.5 times the IQR from the
Section 6.5. The Central Limit Theorem
 Section 6.5 The Central Limit Theorem Idea Will allow us to combine the theory from 6.4 (sampling distribution idea) with our central limit theorem and that will allow us the do hypothesis testing in the
Central Limit Theorem
 Central Limit Theorem Lots of Samples 1 Homework Read Sec 6-5. Discussion Question pg 329 Do Ex 6-5 8-15 2 Objective Use the Central Limit Theorem to solve problems involving sample means 3 Sample Means
8.1 Estimation of the Mean and Proportion
 8.1 Estimation of the Mean and Proportion Statistical inference enables us to make judgments about a population on the basis of sample information. The mean, standard deviation, and proportions of a population
CH 5 Normal Probability Distributions Properties of the Normal Distribution
 Properties of the Normal Distribution Example A friend that is always late. Let X represent the amount of minutes that pass from the moment you are suppose to meet your friend until the moment your friend
Lecture 9. Probability Distributions. Outline. Outline
 Outline Lecture 9 Probability Distributions 6-1 Introduction 6- Probability Distributions 6-3 Mean, Variance, and Expectation 6-4 The Binomial Distribution Outline 7- Properties of the Normal Distribution
Lecture 9. Probability Distributions
 Lecture 9 Probability Distributions Outline 6-1 Introduction 6-2 Probability Distributions 6-3 Mean, Variance, and Expectation 6-4 The Binomial Distribution Outline 7-2 Properties of the Normal Distribution
Math 2311 Bekki George Office Hours: MW 11am to 12:45pm in 639 PGH Online Thursdays 4-5:30pm And by appointment
 Math 2311 Bekki George bekki@math.uh.edu Office Hours: MW 11am to 12:45pm in 639 PGH Online Thursdays 4-5:30pm And by appointment Class webpage: http://www.math.uh.edu/~bekki/math2311.html Math 2311 Class
Math 227 Elementary Statistics. Bluman 5 th edition
 Math 227 Elementary Statistics Bluman 5 th edition CHAPTER 6 The Normal Distribution 2 Objectives Identify distributions as symmetrical or skewed. Identify the properties of the normal distribution. Find
Lecture Slides. Elementary Statistics Tenth Edition. by Mario F. Triola. and the Triola Statistics Series. Slide 1
 Lecture Slides Elementary Statistics Tenth Edition and the Triola Statistics Series by Mario F. Triola Slide 1 Chapter 6 Normal Probability Distributions 6-1 Overview 6-2 The Standard Normal Distribution
Example - Let X be the number of boys in a 4 child family. Find the probability distribution table:
 Chapter8 Probability Distributions and Statistics Section 8.1 Distributions of Random Variables tthe value of the result of the probability experiment is a RANDOM VARIABLE. Example - Let X be the number
Section Introduction to Normal Distributions
 Section 6.1-6.2 Introduction to Normal Distributions 2012 Pearson Education, Inc. All rights reserved. 1 of 105 Section 6.1-6.2 Objectives Interpret graphs of normal probability distributions Find areas
STAT Chapter 6 The Standard Deviation (SD) as a Ruler and The Normal Model
 as a Ruler and The Normal Model") STAT 203 - Chapter 6 The Standard Deviation (SD) as a Ruler and The Normal Model In Chapter 5, we introduced a few measures of center and spread, and discussed how the mean and standard deviation are good
STAT 203 - Chapter 6 The Standard Deviation (SD) as a Ruler and The Normal Model In Chapter 5, we introduced a few measures of center and spread, and discussed how the mean and standard deviation are good
Chapter 4 Variability
 Chapter 4 Variability PowerPoint Lecture Slides Essentials of Statistics for the Behavioral Sciences Seventh Edition by Frederick J Gravetter and Larry B. Wallnau Chapter 4 Learning Outcomes 1 2 3 4 5
Unit 04 Review. Probability Rules
 Unit 04 Review Probability Rules A sample space contains all the possible outcomes observed in a trial of an experiment, a survey, or some random phenomenon. The sum of the probabilities for all possible
Example - Let X be the number of boys in a 4 child family. Find the probability distribution table:
 Chapter7 Probability Distributions and Statistics Distributions of Random Variables tthe value of the result of the probability experiment is a RANDOM VARIABLE. Example - Let X be the number of boys in
4.2 Probability Distributions
 4.2 Probability Distributions Definition. A random variable is a variable whose value is a numerical outcome of a random phenomenon. The probability distribution of a random variable tells us what the
Chapter 6: Random Variables
 Chapter 6: Random Variables Section 6.3 The Practice of Statistics, 4 th edition For AP* STARNES, YATES, MOORE Chapter 6 Random Variables 6.1 Discrete and Continuous Random Variables 6.2 Transforming and
Chapter 7: Random Variables
 Chapter 7: Random Variables 7.1 Discrete and Continuous Random Variables 7.2 Means and Variances of Random Variables 1 Introduction A random variable is a function that associates a unique numerical value
STAT Chapter 6 The Standard Deviation (SD) as a Ruler and The Normal Model
 as a Ruler and The Normal Model") STAT 203 - Chapter 6 The Standard Deviation (SD) as a Ruler and The Normal Model In Chapter 5, we introduced a few measures of center and spread, and discussed how the mean and standard deviation are good
STAT 203 - Chapter 6 The Standard Deviation (SD) as a Ruler and The Normal Model In Chapter 5, we introduced a few measures of center and spread, and discussed how the mean and standard deviation are good
7 THE CENTRAL LIMIT THEOREM
 CHAPTER 7 THE CENTRAL LIMIT THEOREM 373 7 THE CENTRAL LIMIT THEOREM Figure 7.1 If you want to figure out the distribution of the change people carry in their pockets, using the central limit theorem and
Variance, Standard Deviation Counting Techniques
 Variance, Standard Deviation Counting Techniques Section 1.3 & 2.1 Cathy Poliak, Ph.D. cathy@math.uh.edu Department of Mathematics University of Houston 1 / 52 Outline 1 Quartiles 2 The 1.5IQR Rule 3 Understanding
Data that can be any numerical value are called continuous. These are usually things that are measured, such as height, length, time, speed, etc.
 Chapter 8 Measures of Center Data that can be any numerical value are called continuous. These are usually things that are measured, such as height, length, time, speed, etc. Data that can only be integer
3 3 Measures of Central Tendency and Dispersion from grouped data.notebook October 23, 2017
 Warm Up a. Determine the sample standard deviation weight. Express your answer rounded to three decimal places. b. Use the Empirical Rule to determine the percentage of M&Ms with weights between 0.803
Biostatistics and Design of Experiments Prof. Mukesh Doble Department of Biotechnology Indian Institute of Technology, Madras
 Biostatistics and Design of Experiments Prof. Mukesh Doble Department of Biotechnology Indian Institute of Technology, Madras Lecture - 05 Normal Distribution So far we have looked at discrete distributions
Chapter 7 Study Guide: The Central Limit Theorem
 Chapter 7 Study Guide: The Central Limit Theorem Introduction Why are we so concerned with means? Two reasons are that they give us a middle ground for comparison and they are easy to calculate. In this
Invitational Mathematics Competition. Statistics Individual Test
 Invitational Mathematics Competition Statistics Individual Test December 12, 2016 1 MULTIPLE CHOICE. If you think that the correct answer is not present, then choose 'E' for none of the above. 1) What
MATH 264 Problem Homework I
 MATH Problem Homework I Due to December 9, 00@:0 PROBLEMS & SOLUTIONS. A student answers a multiple-choice examination question that offers four possible answers. Suppose that the probability that the
Chapter Seven: Confidence Intervals and Sample Size
 Chapter Seven: Confidence Intervals and Sample Size A point estimate is: The best point estimate of the population mean µ is the sample mean X. Three Properties of a Good Estimator 1. Unbiased 2. Consistent
5.1 Mean, Median, & Mode
 5.1 Mean, Median, & Mode definitions Mean: Median: Mode: Example 1 The Blue Jays score these amounts of runs in their last 9 games: 4, 7, 2, 4, 10, 5, 6, 7, 7 Find the mean, median, and mode: Example 2
Chapter 6: Random Variables
 Chapter 6: Random Variables Section 6.1 Discrete and Continuous Random Variables The Practice of Statistics, 4 th edition For AP* STARNES, YATES, MOORE Chapter 6 Random Variables 6.1 Discrete and Continuous
MULTIPLE CHOICE. Choose the one alternative that best completes the statement or answers the question.
 First Name: Last Name: SID: Class Time: M Tu W Th math10 - HW3 MULTIPLE CHOICE. Choose the one alternative that best completes the statement or answers the question. 1) Continuous random variables are
MAKING SENSE OF DATA Essentials series
 MAKING SENSE OF DATA Essentials series THE NORMAL DISTRIBUTION Copyright by City of Bradford MDC Prerequisites Descriptive statistics Charts and graphs The normal distribution Surveys and sampling Correlation
Section Distributions of Random Variables
 Section 8.1 - Distributions of Random Variables Definition: A random variable is a rule that assigns a number to each outcome of an experiment. Example 1: Suppose we toss a coin three times. Then we could
MA 1125 Lecture 05 - Measures of Spread. Wednesday, September 6, Objectives: Introduce variance, standard deviation, range.
 MA 115 Lecture 05 - Measures of Spread Wednesday, September 6, 017 Objectives: Introduce variance, standard deviation, range. 1. Measures of Spread In Lecture 04, we looked at several measures of central
Both the quizzes and exams are closed book. However, For quizzes: Formulas will be provided with quiz papers if there is any need.
 Both the quizzes and exams are closed book. However, For quizzes: Formulas will be provided with quiz papers if there is any need. For exams (MD1, MD2, and Final): You may bring one 8.5 by 11 sheet of
+ Chapter 7. Random Variables. Chapter 7: Random Variables 2/26/2015. Transforming and Combining Random Variables
 + Chapter 7: Random Variables Section 7.1 Discrete and Continuous Random Variables The Practice of Statistics, 4 th edition For AP* STARNES, YATES, MOORE + Chapter 7 Random Variables 7.1 7.2 7.2 Discrete
No, because np = 100(0.02) = 2. The value of np must be greater than or equal to 5 to use the normal approximation.
 = 2. The value of np must be greater than or equal to 5 to use the normal approximation.") 1) If n 100 and p 0.02 in a binomial experiment, does this satisfy the rule for a normal approximation? Why or why not? No, because np 100(0.02) 2. The value of np must be greater than or equal to 5 to
1) If n 100 and p 0.02 in a binomial experiment, does this satisfy the rule for a normal approximation? Why or why not? No, because np 100(0.02) 2. The value of np must be greater than or equal to 5 to
Section Distributions of Random Variables
 Section 8.1 - Distributions of Random Variables Definition: A random variable is a rule that assigns a number to each outcome of an experiment. Example 1: Suppose we toss a coin three times. Then we could
Normal Probability Distributions
 Normal Probability Distributions Properties of Normal Distributions The most important probability distribution in statistics is the normal distribution. Normal curve A normal distribution is a continuous
Chapter 8: Binomial and Geometric Distributions
 Chapter 8: Binomial and Geometric Distributions Section 8.1 Binomial Distributions The Practice of Statistics, 4 th edition For AP* STARNES, YATES, MOORE Section 8.1 Binomial Distribution Learning Objectives
The Normal Distribution
 5.1 Introduction to Normal Distributions and the Standard Normal Distribution Section Learning objectives: 1. How to interpret graphs of normal probability distributions 2. How to find areas under the
The Normal Probability Distribution
 1 The Normal Probability Distribution Key Definitions Probability Density Function: An equation used to compute probabilities for continuous random variables where the output value is greater than zero
The Uniform Distribution
 Connexions module: m46972 The Uniform Distribution OpenStax College This work is produced by The Connexions Project and licensed under the Creative Commons Attribution License 3.0 The uniform distribution
3.3-Measures of Variation
 3.3-Measures of Variation Variation: Variation is a measure of the spread or dispersion of a set of data from its center. Common methods of measuring variation include: 1. Range. Standard Deviation 3.
Random Variables. Note: Be sure that every possible outcome is included in the sum and verify that you have a valid probability model to start with.
 Random Variables Formulas New Vocabulary You pick a card from a deck. If you get a face card, you win $15. If you get an ace, you win $25 plus an extra $40 for the ace of hearts. For any other card you
VARIABILITY: Range Variance Standard Deviation
 VARIABILITY: Range Variance Standard Deviation Measures of Variability Describe the extent to which scores in a distribution differ from each other. Distance Between the Locations of Scores in Three Distributions
Chapter 6: The Normal Distribution
 Chapter 6: The Normal Distribution Diana Pell Section 6.1: Normal Distributions Note: Recall that a continuous variable can assume all values between any two given values of the variables. Many continuous
In a binomial experiment of n trials, where p = probability of success and q = probability of failure. mean variance standard deviation
 Name In a binomial experiment of n trials, where p = probability of success and q = probability of failure mean variance standard deviation µ = n p σ = n p q σ = n p q Notation X ~ B(n, p) The probability
I. Standard Error II. Standard Error III. Standard Error 2.54
 1) Original Population: Match the standard error (I, II, or III) with the correct sampling distribution (A, B, or C) and the correct sample size (1, 5, or 10) I. Standard Error 1.03 II. Standard Error
CHAPTER 6 Random Variables
 CHAPTER 6 Random Variables 6.3 Binomial and Geometric Random Variables The Practice of Statistics, 5th Edition Starnes, Tabor, Yates, Moore Bedford Freeman Worth Publishers Binomial and Geometric Random
Chapter 6. y y. Standardizing with z-scores. Standardizing with z-scores (cont.)
") Starter Ch. 6: A z-score Analysis Starter Ch. 6 Your Statistics teacher has announced that the lower of your two tests will be dropped. You got a 90 on test 1 and an 85 on test 2. You re all set to drop
Starter Ch. 6: A z-score Analysis Starter Ch. 6 Your Statistics teacher has announced that the lower of your two tests will be dropped. You got a 90 on test 1 and an 85 on test 2. You re all set to drop
Chapter 6: The Normal Distribution
 Chapter 6: The Normal Distribution Diana Pell Section 6.1: Normal Distributions Note: Recall that a continuous variable can assume all values between any two given values of the variables. Many continuous
CHAPTER 6 Random Variables
 CHAPTER 6 Random Variables 6.3 Binomial and Geometric Random Variables The Practice of Statistics, 5th Edition Starnes, Tabor, Yates, Moore Bedford Freeman Worth Publishers Binomial and Geometric Random
Percentiles, STATA, Box Plots, Standardizing, and Other Transformations
 Percentiles, STATA, Box Plots, Standardizing, and Other Transformations Lecture 3 Reading: Sections 5.7 54 Remember, when you finish a chapter make sure not to miss the last couple of boxes: What Can Go
ECON 214 Elements of Statistics for Economists 2016/2017
 ECON 214 Elements of Statistics for Economists 2016/2017 Topic The Normal Distribution Lecturer: Dr. Bernardin Senadza, Dept. of Economics bsenadza@ug.edu.gh College of Education School of Continuing and
4.1 Probability Distributions
 Probability and Statistics Mrs. Leahy Chapter 4: Discrete Probability Distribution ALWAYS KEEP IN MIND: The Probability of an event is ALWAYS between: and!!!! 4.1 Probability Distributions Random Variables
Using the Central Limit Theorem It is important for you to understand when to use the CLT. If you are being asked to find the probability of the
 Using the Central Limit Theorem It is important for you to understand when to use the CLT. If you are being asked to find the probability of the mean, use the CLT for the mean. If you are being asked to
Confidence Intervals. σ unknown, small samples The t-statistic /22
 Confidence Intervals σ unknown, small samples The t-statistic 1 /22 Homework Read Sec 7-3. Discussion Question pg 365 Do Ex 7-3 1-4, 6, 9, 12, 14, 15, 17 2/22 Objective find the confidence interval for
Midterm Test 1 (Sample) Student Name (PRINT):... Student Signature:... Use pencil, so that you can erase and rewrite if necessary.
 Student Name (PRINT):... Student Signature:... Use pencil, so that you can erase and rewrite if necessary.") MA 180/418 Midterm Test 1 (Sample) Student Name (PRINT):............................................. Student Signature:................................................... Use pencil, so that you can erase
MA 180/418 Midterm Test 1 (Sample) Student Name (PRINT):............................................. Student Signature:................................................... Use pencil, so that you can erase
AP Stats Review. Mrs. Daniel Alonzo & Tracy Mourning Sr. High
 AP Stats Review Mrs. Daniel Alonzo & Tracy Mourning Sr. High sdaniel@dadeschools.net Agenda 1. AP Stats Exam Overview 2. AP FRQ Scoring & FRQ: 2016 #1 3. Distributions Review 4. FRQ: 2015 #6 5. Distribution
Lecture 18 Section Mon, Feb 16, 2009
 The s the Lecture 18 Section 5.3.4 Hampden-Sydney College Mon, Feb 16, 2009 Outline The s the 1 2 3 The 4 s 5 the 6 The s the Exercise 5.12, page 333. The five-number summary for the distribution of income
Measures of Variation. Section 2-5. Dotplots of Waiting Times. Waiting Times of Bank Customers at Different Banks in minutes. Bank of Providence
 Measures of Variation Section -5 1 Waiting Times of Bank Customers at Different Banks in minutes Jefferson Valley Bank 6.5 6.6 6.7 6.8 7.1 7.3 7.4 Bank of Providence 4. 5.4 5.8 6. 6.7 8.5 9.3 10.0 Mean
5.2 Random Variables, Probability Histograms and Probability Distributions
 Chapter 5 5.2 Random Variables, Probability Histograms and Probability Distributions A random variable (r.v.) can be either continuous or discrete. It takes on the possible values of an experiment. It
Lecture 18 Section Mon, Sep 29, 2008
 The s the Lecture 18 Section 5.3.4 Hampden-Sydney College Mon, Sep 29, 2008 Outline The s the 1 2 3 The 4 s 5 the 6 The s the Exercise 5.12, page 333. The five-number summary for the distribution of income
The Central Limit Theorem
 Section 6-5 The Central Limit Theorem I. Sampling Distribution of Sample Mean ( ) Eample 1: Population Distribution Table 2 4 6 8 P() 1/4 1/4 1/4 1/4 μ (a) Find the population mean and population standard
Data Science Essentials
 Data Science Essentials Probability and Random Variables As data scientists, we re often concerned with understanding the qualities and relationships of a set of data points. For example, you may need
MidTerm 1) Find the following (round off to one decimal place):
 Find the following (round off to one decimal place):") MidTerm 1) 68 49 21 55 57 61 70 42 59 50 66 99 Find the following (round off to one decimal place): Mean = 58:083, round off to 58.1 Median = 58 Range = max min = 99 21 = 78 St. Deviation = s = 8:535,
MidTerm 1) 68 49 21 55 57 61 70 42 59 50 66 99 Find the following (round off to one decimal place): Mean = 58:083, round off to 58.1 Median = 58 Range = max min = 99 21 = 78 St. Deviation = s = 8:535,
STATISTICAL DISTRIBUTIONS AND THE CALCULATOR
 STATISTICAL DISTRIBUTIONS AND THE CALCULATOR 1. Basic data sets a. Measures of Center - Mean ( ): average of all values. Characteristic: non-resistant is affected by skew and outliers. - Median: Either
Set up a normal distribution curve, to help estimate the percent of the band that, on average, practices a greater number of hours than Alexis.
 Section 5.5 Z-Scores Example 1 Alexis plays in her school jazz band. Band members practice an average of 16.5 h per week, with a standard deviation of 4.2 h. Alexis practices an average of 22 h per week.
Statistics vs. statistics
 Statistics vs. statistics Question: What is Statistics (with a capital S)? Definition: Statistics is the science of collecting, organizing, summarizing and interpreting data. Note: There are 2 main ways
VIDEO 1. A random variable is a quantity whose value depends on chance, for example, the outcome when a die is rolled.
 Part 1: Probability Distributions VIDEO 1 Name: 11-10 Probability and Binomial Distributions A random variable is a quantity whose value depends on chance, for example, the outcome when a die is rolled.
Random Variables. 6.1 Discrete and Continuous Random Variables. Probability Distribution. Discrete Random Variables. Chapter 6, Section 1
 6.1 Discrete and Continuous Random Variables Random Variables A random variable, usually written as X, is a variable whose possible values are numerical outcomes of a random phenomenon. There are two types