Set up a normal distribution curve, to help estimate the percent of the band that, on average, practices a greater number of hours than Alexis.
|
|
|
- Claude Hawkins
- 5 years ago
- Views:
Transcription
1 Section 5.5 Z-Scores Example 1 Alexis plays in her school jazz band. Band members practice an average of 16.5 h per week, with a standard deviation of 4.2 h. Alexis practices an average of 22 h per week. Set up a normal distribution curve, to help estimate the percent of the band that, on average, practices a greater number of hours than Alexis. But this is just an estimate! How can we find an exact answer? Recall: Facts about Normal Distribution Curves Each normal distribution curve has its own mean, µ, and standard deviation, σ. Because different populations have different means and standard deviations, their curves will not be exactly the same but all normal distribution curves are bell-shaped. To compare different normal distribution curves we must standardize the normal distribution. This requires using Z-Scores!
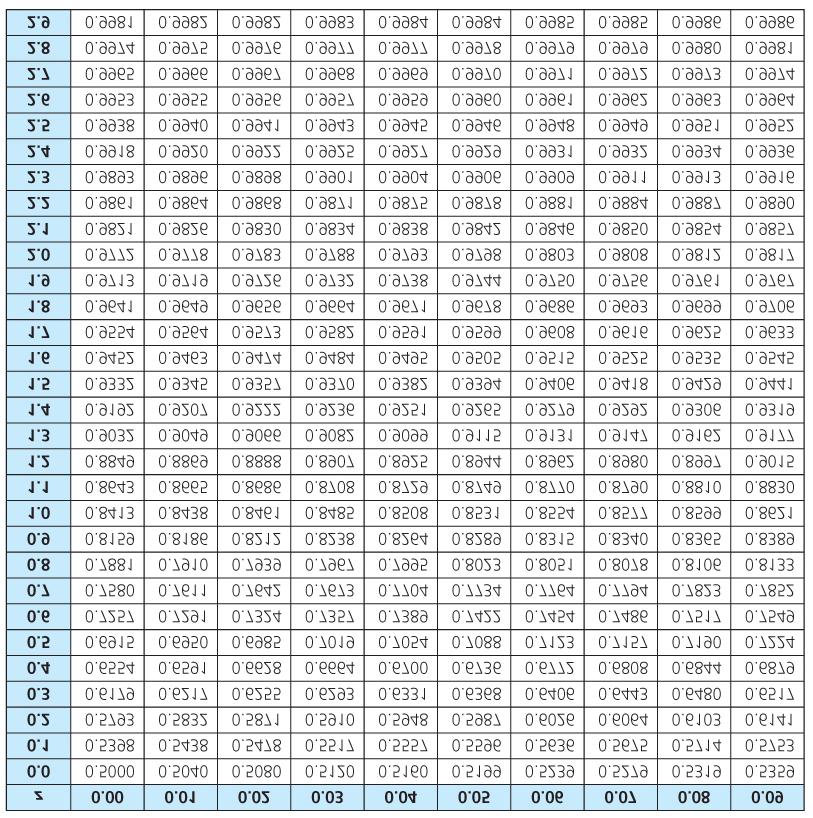
2 The Z-Score A standardized value that indicates the number of standard deviations of a data value above or below the mean. The greater the numerical value of the z-score, the farther it is from the mean. To determine the z-score we use the formula: Then refer to the chart p at the back of your book. The z-score will give you a percent for the area under the curve, less than or equal to the data value. Let's redo Alexis's problem. Find the EXACT percent of the band that practices a greater number of hours than Alexis.
3 Note Notice the z-score table goes from 2.99 to That's because the normal distribution has been standardized! It has a mean, µ = 0, and a standard deviation, σ = 1. The Standard Normal Distribution Curve: The purpose of the z-score is to determine the number of standard deviations a data value is from the mean. A positive z-score means the value is to the right or above the mean. A negative z-score means the value is to the left or below the mean. The total area under the standard normal distribution is 1.
4 We standardize the normal curve to: talk about particular scores within a set of data tell other people about whether or not a score is above or below average indicate how far away a particular score is from the average compare scores from different sets of data and figure out which score is better
5 Example 1: IQ tests are normally distributed with a mean of 100 and a standard devia<on of 15. a) Draw the normal distribu<on curve, labeling the mean and standard devia<on. What percentage of students achieved less than the 130 mark? 34% 34% 0.15% 13.5% 13.5% 2.35% 2.35% 0.15% There would be 97.5% of students achieving less than 130.
6 b) Draw the standard normal distribu<on curve and indicate where the 130 mark is found. 34% 34% 0.15% 13.5% 13.5% 2.35% 2.35% 0.15%
7 c) Using the z-score formula and then the z-score table (pg ) check what percentage of students achieved less than the 130 mark? Was there any difference in your answers from (b) and (c)? Explain. z = = or 97.72% + z-scores - z-scores Yes - my first calculation was 97.5% and using z-score I got 97.7%. The error can be attributed to rounding. The z-score uses more decimal places and is more accurate based on the normal distribution curve.
8 d) Using your diagram from (a), es<mate the percentage of students who achieved less than % 34% 50% + 34% + 6% = 90% 0.15% 13.5% 13.5% 2.35% 2.35% 0.15% e) Using your diagram from (b), the z-score formula and the z-score table determine the percentage of students who achieved less than % 34% 0.15% 13.5% 13.5% 2.35% 2.35% 0.15% z = = so about 91% f) Was your es<mate reasonable when you compared it to the z-score? Yes! They were very close!!
9 g) Why is the z-score more reliable than es<ma<ng using standard devia<on? The z-score has less rounding error! h) What percentage of students achieved more than 120? If approximately 91% achieved less than 120, than 100% - 91% or 9% achieved more than
10 Example 2: Two students competed in a nation-wide mathematics competition and received these scores. Alma 70 Bruce 80 If µ = 66 and σ = 10, find their z-scores. Alma: Bruce: = = 0.4 = = 1.4
11 Example 3: On the math placement test at Memorial University of Newfoundland, the mean score was 62 and the standard deviation was 11. If Mark s z-score was 0.8, what was his actual exam mark? 0.8 = x = x cross multiply!! x - 62 = x = 70.8 He scored 70.8
12 Example 4: On her first math test, Susan scored 70%. The mean class score was 65% with a standard devia<on of 4%. On her second test she received 76%. The mean class score was 73% with a standard devia<on of 10%. a) Without performing any calcula<ons, which test do you think she did bewer on?
13 b) By calcula<ng 2 separate z-scores, which test did Susan perform bewer with respect to the rest of her class? First test z = = 1.25 She did better than 89.44% of the class. Second test z = = 0.30 She did better than 61.79% of the class. With respect to the rest of her class Susan did better on the first test!
14 Example 6: Quality Control Red candy hearts are packaged according to weight with a mean of 300 g and a standard deviation of 8 g. Packages with weights less than 290 g and more than 312 g are rejected by quality control workers. a) If packages are produced each day, how many packages would quality control expect to reject in a day?
15 minimum maximum = = = = = 12 8 = 1.5
16 unacceptable acceptable unacceptable z = z = % will weigh less than 312 g. 100% % or 6.68% will weigh more than 312 g % will weigh less than 290 g. so 6.68% % or 17.24% are outside the limits.
17 If packages are produced in a day: 17.24% of are rejected x packages are rejected each day!
18 b) What advice would you give this company? Adjustments to the packaging process MUST be made packages are too many to reject!
19 Example 7: Warranties Cars are undercoated as a protec<on against rust. A car dealer determines the mean life of protec<on is 65 months and the standard devia<on is 4.5 months. a) What guarantee should the dealer give so that fewer than 15% of the customers will return their cars? 15% the z-score for 15% is In months, this represents (-1.035) = x (-1.035) = x = x = x The dealer should offer a 60 month warranty.
20 b) The dealer creates a fund, based on the guarantee, from which refunds and repairs are made. It is es<mated that about 2500 cars will be undercoated annually. The average repair on returned cars is about $165. How much money should be placed in the fund to cover customer returns? If 15% of cars will be returned before 60 months: 15% of 2500 cars is 0.15 x cars 375 cars at $165 each is $ to place in the fund to cover returns.
21 c) What is the probability that an undercoated car, chosen at random, will be returned in 5 years? 5 years = 5 x 12 months = 60 months = = = so there is a 13.35% chance that a car will return in 5 years.

22 Page ab, 2ab, 3a, 4, 6ab, 7ab, 8, 9,10,13, 15, 16,17,18

23
24
Section 5.5 Z Scores soln.notebook. December 07, Section 5.5 Z Scores
 Section 5.5 Z Scores 1 Warm up/review: The Normal Distribution Curve Given that the average adult in North America has a mean mass of 72 kg, with a standard deviation of 14 kg. a) How many standard deviations
The Normal Probability Distribution
 1 The Normal Probability Distribution Key Definitions Probability Density Function: An equation used to compute probabilities for continuous random variables where the output value is greater than zero
CH 5 Normal Probability Distributions Properties of the Normal Distribution
 Properties of the Normal Distribution Example A friend that is always late. Let X represent the amount of minutes that pass from the moment you are suppose to meet your friend until the moment your friend
Applications of Data Dispersions
 1 Applications of Data Dispersions Key Definitions Standard Deviation: The standard deviation shows how far away each value is from the mean on average. Z-Scores: The distance between the mean and a given
5.1 Mean, Median, & Mode
 5.1 Mean, Median, & Mode definitions Mean: Median: Mode: Example 1 The Blue Jays score these amounts of runs in their last 9 games: 4, 7, 2, 4, 10, 5, 6, 7, 7 Find the mean, median, and mode: Example 2
Department of Quantitative Methods & Information Systems. Business Statistics. Chapter 6 Normal Probability Distribution QMIS 120. Dr.
 Department of Quantitative Methods & Information Systems Business Statistics Chapter 6 Normal Probability Distribution QMIS 120 Dr. Mohammad Zainal Chapter Goals After completing this chapter, you should
Lecture 9. Probability Distributions. Outline. Outline
 Outline Lecture 9 Probability Distributions 6-1 Introduction 6- Probability Distributions 6-3 Mean, Variance, and Expectation 6-4 The Binomial Distribution Outline 7- Properties of the Normal Distribution
The Monthly Payment. ( ) ( ) n. P r M = r 12. k r. 12C, which must be rounded up to the next integer.
 ( ) n. P r M = r 12. k r. 12C, which must be rounded up to the next integer.") MATH 116 Amortization One of the most useful arithmetic formulas in mathematics is the monthly payment for an amortized loan. Here are some standard questions that apply whenever you borrow money to buy
MATH 116 Amortization One of the most useful arithmetic formulas in mathematics is the monthly payment for an amortized loan. Here are some standard questions that apply whenever you borrow money to buy
Lecture 9. Probability Distributions
 Lecture 9 Probability Distributions Outline 6-1 Introduction 6-2 Probability Distributions 6-3 Mean, Variance, and Expectation 6-4 The Binomial Distribution Outline 7-2 Properties of the Normal Distribution
Midterm Test 1 (Sample) Student Name (PRINT):... Student Signature:... Use pencil, so that you can erase and rewrite if necessary.
 Student Name (PRINT):... Student Signature:... Use pencil, so that you can erase and rewrite if necessary.") MA 180/418 Midterm Test 1 (Sample) Student Name (PRINT):............................................. Student Signature:................................................... Use pencil, so that you can erase
MA 180/418 Midterm Test 1 (Sample) Student Name (PRINT):............................................. Student Signature:................................................... Use pencil, so that you can erase
Fall 2011 Exam Score: /75. Exam 3
 Math 12 Fall 2011 Name Exam Score: /75 Total Class Percent to Date Exam 3 For problems 1-10, circle the letter next to the response that best answers the question or completes the sentence. You do not
Since his score is positive, he s above average. Since his score is not close to zero, his score is unusual.
 Chapter 06: The Standard Deviation as a Ruler and the Normal Model This is the worst chapter title ever! This chapter is about the most important random variable distribution of them all the normal distribution.
Section 5 3 The Mean and Standard Deviation of a Binomial Distribution!
 Section 5 3 The Mean and Standard Deviation of a Binomial Distribution! Previous sections required that you to find the Mean and Standard Deviation of a Binomial Distribution by using the values from a
Introduction to Statistics I
 Introduction to Statistics I Keio University, Faculty of Economics Continuous random variables Simon Clinet (Keio University) Intro to Stats November 1, 2018 1 / 18 Definition (Continuous random variable)
Statistics, Their Distributions, and the Central Limit Theorem
 Statistics, Their Distributions, and the Central Limit Theorem MATH 3342 Sections 5.3 and 5.4 Sample Means Suppose you sample from a popula0on 10 0mes. You record the following sample means: 10.1 9.5 9.6
1/12/2011. Chapter 5: z-scores: Location of Scores and Standardized Distributions. Introduction to z-scores. Introduction to z-scores cont.
 Chapter 5: z-scores: Location of Scores and Standardized Distributions Introduction to z-scores In the previous two chapters, we introduced the concepts of the mean and the standard deviation as methods
Club Standard Deviation: (s) Hailey s Run Time (s) At which location was Hailey s run time better, when compared with the club results?
 Hailey s Run Time (s) At which location was Hailey s run time better, when compared with the club results?") 5.5 Z-Scores GOAL Use z-scores to compare data, make predictions, and solve problems. LEARN ABOUT the Math Hailey and Serge belong to a running club in Vancouver. Part of their training involves a 200
5.5 Z-Scores GOAL Use z-scores to compare data, make predictions, and solve problems. LEARN ABOUT the Math Hailey and Serge belong to a running club in Vancouver. Part of their training involves a 200
Exam II Math 1342 Capters 3-5 HCCS. Name
 Exam II Math 1342 Capters 3-5 HCCS Name Date Provide an appropriate response. 1) A single six-sided die is rolled. Find the probability of rolling a number less than 3. A) 0.5 B) 0.1 C) 0.25 D 0.333 1)
Discrete Probability Distribution
 1 Discrete Probability Distribution Key Definitions Discrete Random Variable: Has a countable number of values. This means that each data point is distinct and separate. Continuous Random Variable: Has
The Binomial Probability Distribution
 The Binomial Probability Distribution MATH 130, Elements of Statistics I J. Robert Buchanan Department of Mathematics Fall 2017 Objectives After this lesson we will be able to: determine whether a probability
Math 227 Elementary Statistics. Bluman 5 th edition
 Math 227 Elementary Statistics Bluman 5 th edition CHAPTER 6 The Normal Distribution 2 Objectives Identify distributions as symmetrical or skewed. Identify the properties of the normal distribution. Find
STAT Chapter 6 The Standard Deviation (SD) as a Ruler and The Normal Model
 as a Ruler and The Normal Model") STAT 203 - Chapter 6 The Standard Deviation (SD) as a Ruler and The Normal Model In Chapter 5, we introduced a few measures of center and spread, and discussed how the mean and standard deviation are good
STAT 203 - Chapter 6 The Standard Deviation (SD) as a Ruler and The Normal Model In Chapter 5, we introduced a few measures of center and spread, and discussed how the mean and standard deviation are good
MidTerm 1) Find the following (round off to one decimal place):
 Find the following (round off to one decimal place):") MidTerm 1) 68 49 21 55 57 61 70 42 59 50 66 99 Find the following (round off to one decimal place): Mean = 58:083, round off to 58.1 Median = 58 Range = max min = 99 21 = 78 St. Deviation = s = 8:535,
MidTerm 1) 68 49 21 55 57 61 70 42 59 50 66 99 Find the following (round off to one decimal place): Mean = 58:083, round off to 58.1 Median = 58 Range = max min = 99 21 = 78 St. Deviation = s = 8:535,
STAT Chapter 6 The Standard Deviation (SD) as a Ruler and The Normal Model
 as a Ruler and The Normal Model") STAT 203 - Chapter 6 The Standard Deviation (SD) as a Ruler and The Normal Model In Chapter 5, we introduced a few measures of center and spread, and discussed how the mean and standard deviation are good
STAT 203 - Chapter 6 The Standard Deviation (SD) as a Ruler and The Normal Model In Chapter 5, we introduced a few measures of center and spread, and discussed how the mean and standard deviation are good
Section 6.5. The Central Limit Theorem
 Section 6.5 The Central Limit Theorem Idea Will allow us to combine the theory from 6.4 (sampling distribution idea) with our central limit theorem and that will allow us the do hypothesis testing in the
Section Introduction to Normal Distributions
 Section 6.1-6.2 Introduction to Normal Distributions 2012 Pearson Education, Inc. All rights reserved. 1 of 105 Section 6.1-6.2 Objectives Interpret graphs of normal probability distributions Find areas
6.1 Graphs of Normal Probability Distributions:
 6.1 Graphs of Normal Probability Distributions: Normal Distribution one of the most important examples of a continuous probability distribution, studied by Abraham de Moivre (1667 1754) and Carl Friedrich
Expected Value of a Random Variable
 Knowledge Article: Probability and Statistics Expected Value of a Random Variable Expected Value of a Discrete Random Variable You're familiar with a simple mean, or average, of a set. The mean value of
Uniform Probability Distribution. Continuous Random Variables &
 Continuous Random Variables & What is a Random Variable? It is a quantity whose values are real numbers and are determined by the number of desired outcomes of an experiment. Is there any special Random
11.5: Normal Distributions
 11.5: Normal Distributions 11.5.1 Up to now, we ve dealt with discrete random variables, variables that take on only a finite (or countably infinite we didn t do these) number of values. A continuous random
Solutions for practice questions: Chapter 15, Probability Distributions If you find any errors, please let me know at
 Solutions for practice questions: Chapter 15, Probability Distributions If you find any errors, please let me know at mailto:msfrisbie@pfrisbie.com. 1. Let X represent the savings of a resident; X ~ N(3000,
The Standard Deviation as a Ruler and the Normal Model. Copyright 2009 Pearson Education, Inc.
 The Standard Deviation as a Ruler and the Normal Mol Copyright 2009 Pearson Education, Inc. The trick in comparing very different-looking values is to use standard viations as our rulers. The standard
A Derivation of the Normal Distribution. Robert S. Wilson PhD.
 A Derivation of the Normal Distribution Robert S. Wilson PhD. Data are said to be normally distributed if their frequency histogram is apporximated by a bell shaped curve. In practice, one can tell by
Chapter Seven: Confidence Intervals and Sample Size
 Chapter Seven: Confidence Intervals and Sample Size A point estimate is: The best point estimate of the population mean µ is the sample mean X. Three Properties of a Good Estimator 1. Unbiased 2. Consistent
Version A. Problem 1. Let X be the continuous random variable defined by the following pdf: 1 x/2 when 0 x 2, f(x) = 0 otherwise.
 = 0 otherwise.") Math 224 Q Exam 3A Fall 217 Tues Dec 12 Version A Problem 1. Let X be the continuous random variable defined by the following pdf: { 1 x/2 when x 2, f(x) otherwise. (a) Compute the mean µ E[X]. E[X] x
Math 224 Q Exam 3A Fall 217 Tues Dec 12 Version A Problem 1. Let X be the continuous random variable defined by the following pdf: { 1 x/2 when x 2, f(x) otherwise. (a) Compute the mean µ E[X]. E[X] x
Class 16. Daniel B. Rowe, Ph.D. Department of Mathematics, Statistics, and Computer Science. Marquette University MATH 1700
 Class 16 Daniel B. Rowe, Ph.D. Department of Mathematics, Statistics, and Computer Science Copyright 013 by D.B. Rowe 1 Agenda: Recap Chapter 7. - 7.3 Lecture Chapter 8.1-8. Review Chapter 6. Problem Solving
CHAPTER 5 SAMPLING DISTRIBUTIONS
 CHAPTER 5 SAMPLING DISTRIBUTIONS Sampling Variability. We will visualize our data as a random sample from the population with unknown parameter μ. Our sample mean Ȳ is intended to estimate population mean
The Binomial Distribution
 The Binomial Distribution Properties of a Binomial Experiment 1. It consists of a fixed number of observations called trials. 2. Each trial can result in one of only two mutually exclusive outcomes labeled
Section 7.5 The Normal Distribution. Section 7.6 Application of the Normal Distribution
 Section 7.6 Application of the Normal Distribution A random variable that may take on infinitely many values is called a continuous random variable. A continuous probability distribution is defined by
Midterm Exam III Review
 Midterm Exam III Review Dr. Joseph Brennan Math 148, BU Dr. Joseph Brennan (Math 148, BU) Midterm Exam III Review 1 / 25 Permutations and Combinations ORDER In order to count the number of possible ways
8.2 The Standard Deviation as a Ruler Chapter 8 The Normal and Other Continuous Distributions 8-1
 8.2 The Standard Deviation as a Ruler Chapter 8 The Normal and Other Continuous Distributions For Example: On August 8, 2011, the Dow dropped 634.8 points, sending shock waves through the financial community.
( G O O D L U C K!! )
") Stat 1030 Exam 2 Prep Worksheet Monday Week 10 In today s class we ll work three problems: A, B, and C. The work is open-notes. Work together with Prof. Whitten, classmates and TAs. Carry calculations
Stat 1030 Exam 2 Prep Worksheet Monday Week 10 In today s class we ll work three problems: A, B, and C. The work is open-notes. Work together with Prof. Whitten, classmates and TAs. Carry calculations
Unit2: Probabilityanddistributions. 3. Normal and binomial distributions
 Announcements Unit2: Probabilityanddistributions 3. Normal and binomial distributions Sta 101 - Summer 2017 Duke University, Department of Statistical Science PS: Explain your reasoning + show your work
( ) P = = =
 P = = =") 1. On a lunch counter, there are 5 oranges and 6 apples. If 3 pieces of fruit are selected, find the probability that 1 orange and apples are selected. Order does not matter Combinations: 5C1 (1 ) 6C P
1. On a lunch counter, there are 5 oranges and 6 apples. If 3 pieces of fruit are selected, find the probability that 1 orange and apples are selected. Order does not matter Combinations: 5C1 (1 ) 6C P
Both the quizzes and exams are closed book. However, For quizzes: Formulas will be provided with quiz papers if there is any need.
 Both the quizzes and exams are closed book. However, For quizzes: Formulas will be provided with quiz papers if there is any need. For exams (MD1, MD2, and Final): You may bring one 8.5 by 11 sheet of
MAKING SENSE OF DATA Essentials series
 MAKING SENSE OF DATA Essentials series THE NORMAL DISTRIBUTION Copyright by City of Bradford MDC Prerequisites Descriptive statistics Charts and graphs The normal distribution Surveys and sampling Correlation
Chapter Seven. The Normal Distribution
 Chapter Seven The Normal Distribution 7-1 Introduction Many continuous variables have distributions that are bellshaped and are called approximately normally distributed variables, such as the heights
VIDEO 1. A random variable is a quantity whose value depends on chance, for example, the outcome when a die is rolled.
 Part 1: Probability Distributions VIDEO 1 Name: 11-10 Probability and Binomial Distributions A random variable is a quantity whose value depends on chance, for example, the outcome when a die is rolled.
Contents. The Binomial Distribution. The Binomial Distribution The Normal Approximation to the Binomial Left hander example
 Contents The Binomial Distribution The Normal Approximation to the Binomial Left hander example The Binomial Distribution When you flip a coin there are only two possible outcomes - heads or tails. This
Prob and Stats, Nov 7
 Prob and Stats, Nov 7 The Standard Normal Distribution Book Sections: 7.1, 7.2 Essential Questions: What is the standard normal distribution, how is it related to all other normal distributions, and how
Lecture 8. The Binomial Distribution. Binomial Distribution. Binomial Distribution. Probability Distributions: Normal and Binomial
 Lecture 8 The Binomial Distribution Probability Distributions: Normal and Binomial 1 2 Binomial Distribution >A binomial experiment possesses the following properties. The experiment consists of a fixed
A LEVEL MATHEMATICS QUESTIONBANKS NORMAL DISTRIBUTION - BASIC
 1. The random variable X has a normal distribution with mean 5 and standard deviation 2. Find: a) P(X
Math 2311 Bekki George Office Hours: MW 11am to 12:45pm in 639 PGH Online Thursdays 4-5:30pm And by appointment
 Math 2311 Bekki George bekki@math.uh.edu Office Hours: MW 11am to 12:45pm in 639 PGH Online Thursdays 4-5:30pm And by appointment Class webpage: http://www.math.uh.edu/~bekki/math2311.html Math 2311 Class
MATH CALCULUS & STATISTICS/BUSN - PRACTICE EXAM #2 - SUMMER DR. DAVID BRIDGE
 MATH 2053 - CALCULUS & STATISTICS/BUSN - PRACTICE EXAM #2 - SUMMER 2007 - DR. DAVID BRIDGE MULTIPLE CHOICE. Choose the one alternative that best completes the statement or answers the question. Find the
STAT 3090 Test 2 - Version B Fall Student s Printed Name: PLEASE READ DIRECTIONS!!!!
 Student s Printed Name: Instructor: XID: Section #: Read each question very carefully. You are permitted to use a calculator on all portions of this exam. You are NOT allowed to use any textbook, notes,
MTH 245: Mathematics for Management, Life, and Social Sciences
 1/14 MTH 245: Mathematics for Management, Life, and Social Sciences Section 7.6 Section 7.6: The Normal Distribution. 2/14 The Normal Distribution. Figure: Abraham DeMoivre Section 7.6: The Normal Distribution.
Chapter 3. Lecture 3 Sections
 Chapter 3 Lecture 3 Sections 3.4 3.5 Measure of Position We would like to compare values from different data sets. We will introduce a z score or standard score. This measures how many standard deviation
Statistics 511 Supplemental Materials
 Gaussian (or Normal) Random Variable In this section we introduce the Gaussian Random Variable, which is more commonly referred to as the Normal Random Variable. This is a random variable that has a bellshaped
Normal distribution. We say that a random variable X follows the normal distribution if the probability density function of X is given by
 Normal distribution The normal distribution is the most important distribution. It describes well the distribution of random variables that arise in practice, such as the heights or weights of people,
SECTION 6.2 (DAY 1) TRANSFORMING RANDOM VARIABLES NOVEMBER 16 TH, 2017
 TRANSFORMING RANDOM VARIABLES NOVEMBER 16 TH, 2017") SECTION 6.2 (DAY 1) TRANSFORMING RANDOM VARIABLES NOVEMBER 16 TH, 2017 TODAY S OBJECTIVES Describe the effects of transforming a random variable by: adding or subtracting a constant multiplying or dividing
SECTION 6.2 (DAY 1) TRANSFORMING RANDOM VARIABLES NOVEMBER 16 TH, 2017 TODAY S OBJECTIVES Describe the effects of transforming a random variable by: adding or subtracting a constant multiplying or dividing
Sec$on 6.1: Discrete and Con.nuous Random Variables. Tuesday, November 14 th, 2017
 Sec$on 6.1: Discrete and Con.nuous Random Variables Tuesday, November 14 th, 2017 Discrete and Continuous Random Variables Learning Objectives After this section, you should be able to: ü COMPUTE probabilities
Standard Deviation. 1 Motivation 1
 Standard Deviation Table of Contents 1 Motivation 1 2 Standard Deviation 2 3 Computing Standard Deviation 4 4 Calculator Instructions 7 5 Homework Problems 8 5.1 Instructions......................................
Part 1 In which we meet the law of averages. The Law of Averages. The Expected Value & The Standard Error. Where Are We Going?
 1 The Law of Averages The Expected Value & The Standard Error Where Are We Going? Sums of random numbers The law of averages Box models for generating random numbers Sums of draws: the Expected Value Standard
ECON 214 Elements of Statistics for Economists
 ECON 214 Elements of Statistics for Economists Session 7 The Normal Distribution Part 1 Lecturer: Dr. Bernardin Senadza, Dept. of Economics Contact Information: bsenadza@ug.edu.gh College of Education
MA 1125 Lecture 14 - Expected Values. Wednesday, October 4, Objectives: Introduce expected values.
 MA 5 Lecture 4 - Expected Values Wednesday, October 4, 27 Objectives: Introduce expected values.. Means, Variances, and Standard Deviations of Probability Distributions Two classes ago, we computed the
The Normal Model The famous bell curve
 Math 243 Sections 6.1-6.2 The Normal Model Here are some roughly symmetric, unimodal histograms The Normal Model The famous bell curve Example 1. Let s say the mean annual rainfall in Portland is 40 inches
Chapter 6. y y. Standardizing with z-scores. Standardizing with z-scores (cont.)
") Starter Ch. 6: A z-score Analysis Starter Ch. 6 Your Statistics teacher has announced that the lower of your two tests will be dropped. You got a 90 on test 1 and an 85 on test 2. You re all set to drop
Starter Ch. 6: A z-score Analysis Starter Ch. 6 Your Statistics teacher has announced that the lower of your two tests will be dropped. You got a 90 on test 1 and an 85 on test 2. You re all set to drop
Distribution. Lecture 34 Section Fri, Oct 31, Hampden-Sydney College. Student s t Distribution. Robb T. Koether.
 Lecture 34 Section 10.2 Hampden-Sydney College Fri, Oct 31, 2008 Outline 1 2 3 4 5 6 7 8 Exercise 10.4, page 633. A psychologist is studying the distribution of IQ scores of girls at an alternative high
Lecture 7 Random Variables
 Lecture 7 Random Variables Definition: A random variable is a variable whose value is a numerical outcome of a random phenomenon, so its values are determined by chance. We shall use letters such as X
3 3 Measures of Central Tendency and Dispersion from grouped data.notebook October 23, 2017
 Warm Up a. Determine the sample standard deviation weight. Express your answer rounded to three decimal places. b. Use the Empirical Rule to determine the percentage of M&Ms with weights between 0.803
5.2 Random Variables, Probability Histograms and Probability Distributions
 Chapter 5 5.2 Random Variables, Probability Histograms and Probability Distributions A random variable (r.v.) can be either continuous or discrete. It takes on the possible values of an experiment. It
The Normal Distribution
 5.1 Introduction to Normal Distributions and the Standard Normal Distribution Section Learning objectives: 1. How to interpret graphs of normal probability distributions 2. How to find areas under the
Abraham Baldwin Agricultural College Math 2000 Practice Test 3
 Abraham Baldwin Agricultural College Math 000 Practice Test 3 To get credit you must show your work. If your answer involves using a formula, make sure you write down the formula! Also write down any expression
The Mathematics of Normality
 MATH 110 Week 9 Chapter 17 Worksheet The Mathematics of Normality NAME Normal (bell-shaped) distributions play an important role in the world of statistics. One reason the normal distribution is important
Determining Sample Size. Slide 1 ˆ ˆ. p q n E = z α / 2. (solve for n by algebra) n = E 2
 n = E 2") Determining Sample Size Slide 1 E = z α / 2 ˆ ˆ p q n (solve for n by algebra) n = ( zα α / 2) 2 p ˆ qˆ E 2 Sample Size for Estimating Proportion p When an estimate of ˆp is known: Slide 2 n = ˆ ˆ ( )
Determining Sample Size Slide 1 E = z α / 2 ˆ ˆ p q n (solve for n by algebra) n = ( zα α / 2) 2 p ˆ qˆ E 2 Sample Size for Estimating Proportion p When an estimate of ˆp is known: Slide 2 n = ˆ ˆ ( )
Before How can lines on a graph show the effect of interest rates on savings accounts?
 Compound Interest LAUNCH (7 MIN) Before How can lines on a graph show the effect of interest rates on savings accounts? During How can you tell what the graph of simple interest looks like? After What
FEEG6017 lecture: The normal distribution, estimation, confidence intervals. Markus Brede,
 FEEG6017 lecture: The normal distribution, estimation, confidence intervals. Markus Brede, mb8@ecs.soton.ac.uk The normal distribution The normal distribution is the classic "bell curve". We've seen that
1 Math 1313 Final Review Final Review for Finite. 1. Find the equation of the line containing the points 1, 2)
") Math 33 Final Review Final Review for Finite. Find the equation of the line containing the points, 2) ( and (,3) 2. 2. The Ace Company installed a new machine in one of its factories at a cost of $2,.
Math 33 Final Review Final Review for Finite. Find the equation of the line containing the points, 2) ( and (,3) 2. 2. The Ace Company installed a new machine in one of its factories at a cost of $2,.
Statistics Class 15 3/21/2012
 Statistics Class 15 3/21/2012 Quiz 1. Cans of regular Pepsi are labeled to indicate that they contain 12 oz. Data Set 17 in Appendix B lists measured amounts for a sample of Pepsi cans. The same statistics
2 DESCRIPTIVE STATISTICS
 Chapter 2 Descriptive Statistics 47 2 DESCRIPTIVE STATISTICS Figure 2.1 When you have large amounts of data, you will need to organize it in a way that makes sense. These ballots from an election are rolled
6.1 Discrete & Continuous Random Variables. Nov 4 6:53 PM. Objectives
 6.1 Discrete & Continuous Random Variables examples vocab Objectives Today we will... - Compute probabilities using the probability distribution of a discrete random variable. - Calculate and interpret
Examples of continuous probability distributions: The normal and standard normal
 Examples of continuous probability distributions: The normal and standard normal The Normal Distribution f(x) Changing μ shifts the distribution left or right. Changing σ increases or decreases the spread.
MULTIPLE CHOICE. Choose the one alternative that best completes the statement or answers the question.
 Ch. 8 Sampling Distributions 8.1 Distribution of the Sample Mean 1 Describe the distribution of the sample mean: normal population. MULTIPLE CHOICE. Choose the one alternative that best completes the statement
Central Limit Theorem
 Central Limit Theorem Lots of Samples 1 Homework Read Sec 6-5. Discussion Question pg 329 Do Ex 6-5 8-15 2 Objective Use the Central Limit Theorem to solve problems involving sample means 3 Sample Means
Business Statistics 41000: Probability 4
 Business Statistics 41000: Probability 4 Drew D. Creal University of Chicago, Booth School of Business February 14 and 15, 2014 1 Class information Drew D. Creal Email: dcreal@chicagobooth.edu Office:
STAT:2010 Statistical Methods and Computing. Using density curves to describe the distribution of values of a quantitative
 STAT:10 Statistical Methods and Computing Normal Distributions Lecture 4 Feb. 6, 17 Kate Cowles 374 SH, 335-0727 kate-cowles@uiowa.edu 1 2 Using density curves to describe the distribution of values of
NOTES: Chapter 4 Describing Data
 NOTES: Chapter 4 Describing Data Intro to Statistics COLYER Spring 2017 Student Name: Page 2 Section 4.1 ~ What is Average? Objective: In this section you will understand the difference between the three
MATH 264 Problem Homework I
 MATH Problem Homework I Due to December 9, 00@:0 PROBLEMS & SOLUTIONS. A student answers a multiple-choice examination question that offers four possible answers. Suppose that the probability that the
1.00/1.001 Introduction to Computers and Engineering Problem Solving Fall 2002 Problem Set 7 Due: Day 24
 1.00/1.001 Introduction to Computers and Engineering Problem Solving Fall 2002 Problem Set 7 Due: Day 24 Problem 1. YTM (50%) BeaverBank.com starts offering a new student loan program to 1.00 students
Chapter 6.1 Confidence Intervals. Stat 226 Introduction to Business Statistics I. Chapter 6, Section 6.1
 Stat 226 Introduction to Business Statistics I Spring 2009 Professor: Dr. Petrutza Caragea Section A Tuesdays and Thursdays 9:30-10:50 a.m. Chapter 6, Section 6.1 Confidence Intervals Confidence Intervals
PROBABILITY AND STATISTICS CHAPTER 4 NOTES DISCRETE PROBABILITY DISTRIBUTIONS
 PROBABILITY AND STATISTICS CHAPTER 4 NOTES DISCRETE PROBABILITY DISTRIBUTIONS I. INTRODUCTION TO RANDOM VARIABLES AND PROBABILITY DISTRIBUTIONS A. Random Variables 1. A random variable x represents a value
Math 14 Lecture Notes Ch The Normal Approximation to the Binomial Distribution. P (X ) = nc X p X q n X =
 = nc X p X q n X =") 6.4 The Normal Approximation to the Binomial Distribution Recall from section 6.4 that g A binomial experiment is a experiment that satisfies the following four requirements: 1. Each trial can have only
6.4 The Normal Approximation to the Binomial Distribution Recall from section 6.4 that g A binomial experiment is a experiment that satisfies the following four requirements: 1. Each trial can have only
3. The n observations are independent. Knowing the result of one observation tells you nothing about the other observations.
 Binomial and Geometric Distributions - Terms and Formulas Binomial Experiments - experiments having all four conditions: 1. Each observation falls into one of two categories we call them success or failure.
Math 1070 Sample Exam 2 Spring 2015
 University of Connecticut Department of Mathematics Math 1070 Sample Exam 2 Spring 2015 Name: Instructor Name: Section: Exam 2 will cover Sections 4.6-4.7, 5.3-5.4, 6.1-6.4, and F.1-F.4. This sample exam
Review. What is the probability of throwing two 6s in a row with a fair die? a) b) c) d) 0.333
 b) c) d) 0.333") Review In most card games cards are dealt without replacement. What is the probability of being dealt an ace and then a 3? Choose the closest answer. a) 0.0045 b) 0.0059 c) 0.0060 d) 0.1553 Review What
Review In most card games cards are dealt without replacement. What is the probability of being dealt an ace and then a 3? Choose the closest answer. a) 0.0045 b) 0.0059 c) 0.0060 d) 0.1553 Review What
The Central Limit Theorem
 Section 6-5 The Central Limit Theorem I. Sampling Distribution of Sample Mean ( ) Eample 1: Population Distribution Table 2 4 6 8 P() 1/4 1/4 1/4 1/4 μ (a) Find the population mean and population standard
Chapter 6. The Normal Probability Distributions
 Chapter 6 The Normal Probability Distributions 1 Chapter 6 Overview Introduction 6-1 Normal Probability Distributions 6-2 The Standard Normal Distribution 6-3 Applications of the Normal Distribution 6-5
Class 12. Daniel B. Rowe, Ph.D. Department of Mathematics, Statistics, and Computer Science. Marquette University MATH 1700
 Class 12 Daniel B. Rowe, Ph.D. Department of Mathematics, Statistics, and Computer Science Copyright 2017 by D.B. Rowe 1 Agenda: Recap Chapter 6.1-6.2 Lecture Chapter 6.3-6.5 Problem Solving Session. 2
The Binomial Distribution
 The Binomial Distribution January 31, 2018 Contents The Binomial Distribution The Normal Approximation to the Binomial The Binomial Hypothesis Test Computing Binomial Probabilities in R 30 Problems The
University of California, Los Angeles Department of Statistics. Normal distribution
 University of California, Los Angeles Department of Statistics Statistics 110A Instructor: Nicolas Christou Normal distribution The normal distribution is the most important distribution. It describes