AP Stats Review. Mrs. Daniel Alonzo & Tracy Mourning Sr. High
|
|
|
- Elijah Ball
- 5 years ago
- Views:
Transcription
1 AP Stats Review Mrs. Daniel Alonzo & Tracy Mourning Sr. High
2 Agenda 1. AP Stats Exam Overview 2. AP FRQ Scoring & FRQ: 2016 #1 3. Distributions Review 4. FRQ: 2015 #6 5. Distribution Mash-Up 6. FRQ:
3 AP Stats Exam
4 Exam Format Two 90 minute sections Reference Sheet and Calculator! First section: 40 multiple choice questions Second section: 6 free response questions (FRQs) First 5 FRQs = 12 minutes each FRQ # 6 : Investigative task for 30 minutes
5 Scoring Exam is scored out of 100 points. Each MC is worth 1.25 points Each FRQ (#1-5) is worth 7.5 points FRQ #6 is worth 15 points
6 What s on the Exam? Exploring Data (20-30%): Describing patterns and departures from patterns (CH. 1-3) Sampling and Experimentation (10-15%): Planning and conducting a study (CH. 4) Anticipating Patterns (20-30%): Exploring random phenomena using probability and simulation (CH. 5-7) Statistical Inference (30-40%): Estimating population parameters and testing hypotheses (CH 8-12)
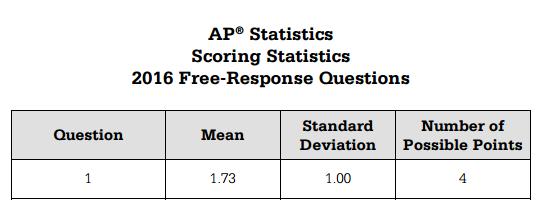
7 FRQ Scoring Each question is scored from 1 to 4. The raw score is then multiplied by to determined the scaled score. The numerical score is derived from a series of: Essentially Correct Partially Correct Incorrect
8 FRQ Scoring Sample Scale for a 4 part question.
9 FRQ Scoring

10 AP Stats 2016 Scores
11 Thursday, May 11, 2017 NOON
12 FRQ: 2016 #1 You have 12 minutes. Go!!!
13 Solution Part a: The distribution of Robin s tip amounts is skewed to the right. There is a gap between the largest tip amount (between $20 to 22.50) and the second largest tip amount (between $12.50 and $15 interval). The largest tip amount appears to be an outlier. The median tip amount is between $2.50 and $5. Robin s tip amounts vary from a minimum of $0 to $2.50 to a maximum of between $20 and $ About 78% of tip amounts are between $0 and $5.
14 Scoring
15 Solution Part b: If the $8 tip had really been $18, the total would increase by $10. Then, we would divide by 60, so the increase to the mean would be about 17 cents. The median would not change, since both $8 and $18 are greater than the current median.
16 Scoring
17 Scoring Guidelines
18
19 Distributions Normal Binomial Geometric Sampling
20 Normal Distributions All Normal curves are symmetric, single-peaked, and bellshaped A Specific Normal curve is described by giving its mean µ and standard deviation σ. Two Normal curves, showing the mean µ and standard deviation σ.
21 Normal Distributions We abbreviate the Normal distribution with mean µ and standard deviation σ as N(µ,σ). Any particular Normal distribution is completely specified by two numbers: its mean µ and standard deviation σ. The mean of a Normal distribution is the center of the symmetric Normal curve. The standard deviation is the distance from the center to the change-of-curvature points on either side.
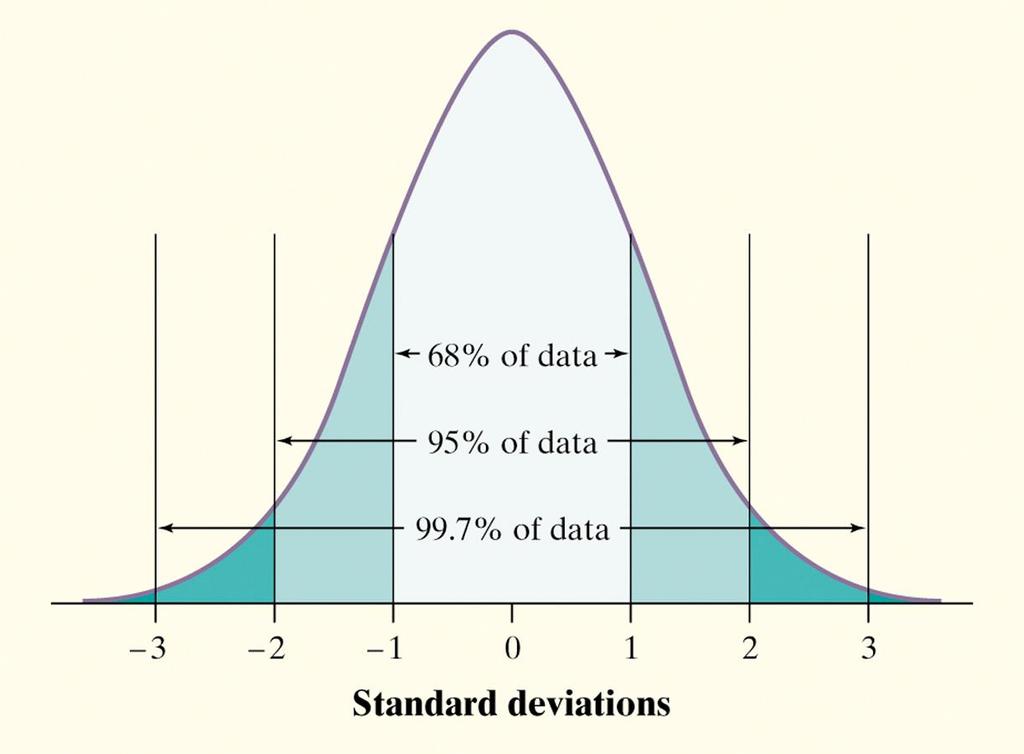
 In the Normal distribution with mean µ and standard deviation σ: Approximately 68% of the observations fall within σ of µ.")
22 The Rule Although there are many different sizes and shapes of Normal curves, they all have properties in common. The Rule ( The Empirical Rule ) In the Normal distribution with mean µ and standard deviation σ: Approximately 68% of the observations fall within σ of µ. Approximately 95% of the observations fall within 2σ of µ. Approximately 99.7% of the observations fall within 3σ of µ.
23
24 Binomial v. Geometric The primary difference between a binomial random variable and a geometric random variable is what you are counting. A binomial random variable counts the number of "successes" in n trials. A geometric random variable counts the number of trials up to and including the first "success."
25 Binomial vs. Geometric The Binomial Setting 1. Each observation falls into one of two categories. 2. The probability of success is the same for each observation. 3. The observations are all independent. 4. There is a fixed number n of observations. The Geometric Setting 1. Each observation falls into one of two categories. 2. The probability of success is the same for each observation. 3. The observations are all independent. 4. The variable of interest is the number of trials required to obtain the 1 st success.
26 FRQ Answers Must Include: 1. Name of distribution Geometric, Binomial 2. Parameters Binomial: X (define variable), n & p Geometric: X (define variable), p 3. Probability Statement Ex: P (X = 7) or P (X 3) 4. Calculation and p-value Calculator notation is okay, but needs to be labeled. 5. Solution interpreted in context.
27 Let s Practice Twenty-five percent of the customers entering a grocery store between 5 p.m. and 7 p.m. use an express checkout. Consider five randomly selected customers, and let X denote the number among the five who use the express checkout. What is the probability that two customers used the express check out?
28 Twenty-five percent of the customers entering a grocery store between 5 p.m. and 7 p.m. use an express checkout. Consider five randomly selected customers, and let X denote the number among the five who use the express checkout. hat is the probability that two customers used the express check out? Binomial Distribution N= 5 P = 0.25 X = # of people use express P (X =2)
29 Twenty-five percent of the customers entering a grocery store between 5 p.m. and 7 p.m. use an express checkout. Consider five randomly selected customers, and let X denote the number among the five who use the express checkout. What is the probability that two customers used the express check out? binompdf(5, 0.25, 2) = = number of customers 0.25= probability of success 2= number of successes desired There is a 26.37% chance that exactly 2 customers will use the express checkout lane between 5pm and 7pm.
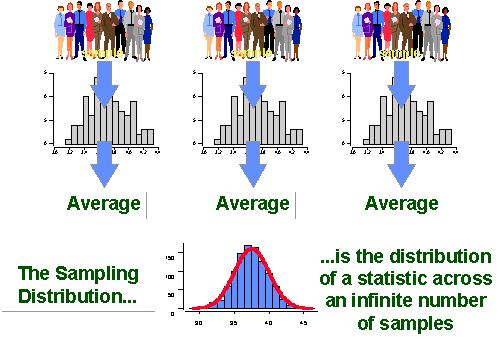
30 Sampling Distribution
31
32 Population Distributions vs. Sampling Distributions There are actually three distinct distributions involved when we sample repeatedly and measure a variable of interest. 1) The population distribution gives the values of the variable for all the individuals in the population. 2) The distribution of sample data shows the values of the variable for all the individuals in the sample. 3) The sampling distribution shows the statistic values from all the possible samples of the same size from the population.
33 Sample Proportion Formulas pˆ p(1 n p) The sample size MUST be less than 10% of the total population.
34 Sample Means Formulas x Notes: The sample size must be less than 10% of the population to satisfy the independence condition. The mean and standard deviation of the sample mean are true no matter the same of the population distribution.
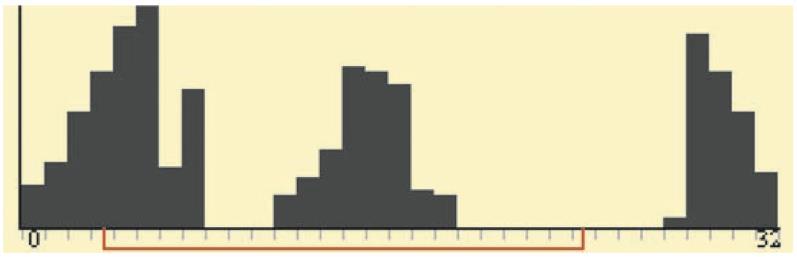
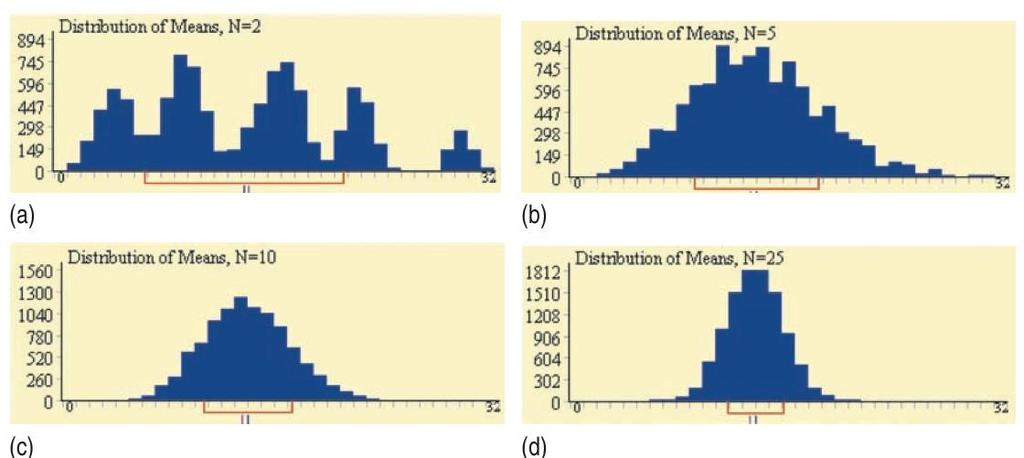
35 Sample Distributions & Normality:

36 Sample Distributions & Normality:
37 Sample Distributions & Normality: HOW LARGE IS LARGE ENOUGH? If the Population shape is. Minimum Sample Size to assume Normal Normal 0 Slightly Skewed 15 Heavily Skewed 30 Unknown 30
38 FRQ: 2015 #6 You have 22 minutes. Go!!!
39 Scoring Rubric
40 Scoring Rubric

41 Scoring Rubric
42 Scoring Rubric
43
44 Distributions Mash Up
45 SKIP: Distributions Mash Up 2B. 3B (bonus!!) 6 A
46 Distributions Mash Up 1. a a. normalcdf ( 140, inf, 120, 10.5) = c. binompdf (3,.5, 0) = a. normpdf (850, inf, 840, 7.9) = a. $0.70 b. 715 plays c. Normcdf ( 500, inf, 700, 92.79) =
47 Distributions Mash Up 5. a. geometcdf (.1, 4, 100) = b. binompdf (20,.1, 2) = c. binomcdf (104,.1, 21) = b. normcdf (4, inf, 3.9, ) = OR normcdf (160, inf, 156, 6.987) 7. a. 5 questions b (7) -.8(7)(.25) c. binomcdf (7, 0.2, 3, 7) = 0.148
48 FRQ: 2011 #6 You have 25 minutes. Go!!!
49
AP Stats. Review. Mrs. Daniel Alonzo & Tracy Mourning Sr. High
 AP Stats Review Mrs. Daniel Alonzo & Tracy Mourning Sr. High sdaniel@dadeschools.net Agenda 1. AP Stats Exam Overview 2. AP FRQ Scoring & FRQ: 2016 #1 3. Distributions Review 4. FRQ: 2015 #6 5. Distribution
Section 6.3 Binomial and Geometric Random Variables
 Section 6.3 Binomial and Geometric Random Variables Mrs. Daniel AP Stats Binomial Settings A binomial setting arises when we perform several independent trials of the same chance process and record the
Chapter 6: Random Variables. Ch. 6-3: Binomial and Geometric Random Variables
 Chapter : Random Variables Ch. -3: Binomial and Geometric Random Variables X 0 2 3 4 5 7 8 9 0 0 P(X) 3???????? 4 4 When the same chance process is repeated several times, we are often interested in whether
Random Variables CHAPTER 6.3 BINOMIAL AND GEOMETRIC RANDOM VARIABLES
 Random Variables CHAPTER 6.3 BINOMIAL AND GEOMETRIC RANDOM VARIABLES Essential Question How can I determine whether the conditions for using binomial random variables are met? Binomial Settings When the
CHAPTER 6 Random Variables
 CHAPTER 6 Random Variables 6.3 Binomial and Geometric Random Variables The Practice of Statistics, 5th Edition Starnes, Tabor, Yates, Moore Bedford Freeman Worth Publishers Binomial and Geometric Random
Distribution. Lecture 34 Section Fri, Oct 31, Hampden-Sydney College. Student s t Distribution. Robb T. Koether.
 Lecture 34 Section 10.2 Hampden-Sydney College Fri, Oct 31, 2008 Outline 1 2 3 4 5 6 7 8 Exercise 10.4, page 633. A psychologist is studying the distribution of IQ scores of girls at an alternative high
Chapter 7 1. Random Variables
 Chapter 7 1 Random Variables random variable numerical variable whose value depends on the outcome of a chance experiment - discrete if its possible values are isolated points on a number line - continuous
Probability is the tool used for anticipating what the distribution of data should look like under a given model.
 AP Statistics NAME: Exam Review: Strand 3: Anticipating Patterns Date: Block: III. Anticipating Patterns: Exploring random phenomena using probability and simulation (20%-30%) Probability is the tool used
Statistics Class 15 3/21/2012
 Statistics Class 15 3/21/2012 Quiz 1. Cans of regular Pepsi are labeled to indicate that they contain 12 oz. Data Set 17 in Appendix B lists measured amounts for a sample of Pepsi cans. The same statistics
Binomial and Normal Distributions. Example: Determine whether the following experiments are binomial experiments. Explain.
 Binomial and Normal Distributions Objective 1: Determining if an Experiment is a Binomial Experiment For an experiment to be considered a binomial experiment, four things must hold: 1. The experiment is
Chapter 7 presents the beginning of inferential statistics. The two major activities of inferential statistics are
 Chapter 7 presents the beginning of inferential statistics. Concept: Inferential Statistics The two major activities of inferential statistics are 1 to use sample data to estimate values of population
CH 5 Normal Probability Distributions Properties of the Normal Distribution
 Properties of the Normal Distribution Example A friend that is always late. Let X represent the amount of minutes that pass from the moment you are suppose to meet your friend until the moment your friend
Previously, when making inferences about the population mean, μ, we were assuming the following simple conditions:
 Chapter 17 Inference about a Population Mean Conditions for inference Previously, when making inferences about the population mean, μ, we were assuming the following simple conditions: (1) Our data (observations)
CHAPTER 6 Random Variables
 CHAPTER 6 Random Variables 6.3 Binomial and Geometric Random Variables The Practice of Statistics, 5th Edition Starnes, Tabor, Yates, Moore Bedford Freeman Worth Publishers Binomial and Geometric Random
Random Variables. Chapter 6: Random Variables 2/2/2014. Discrete and Continuous Random Variables. Transforming and Combining Random Variables
 Chapter 6: Random Variables Section 6.3 The Practice of Statistics, 4 th edition For AP* STARNES, YATES, MOORE Random Variables 6.1 6.2 6.3 Discrete and Continuous Random Variables Transforming and Combining
Midterm Exam III Review
 Midterm Exam III Review Dr. Joseph Brennan Math 148, BU Dr. Joseph Brennan (Math 148, BU) Midterm Exam III Review 1 / 25 Permutations and Combinations ORDER In order to count the number of possible ways
The normal distribution is a theoretical model derived mathematically and not empirically.
 Sociology 541 The Normal Distribution Probability and An Introduction to Inferential Statistics Normal Approximation The normal distribution is a theoretical model derived mathematically and not empirically.
Chapter 7. Sampling Distributions
 Chapter 7 Sampling Distributions Section 7.1 Sampling Distributions and the Central Limit Theorem Sampling Distributions Sampling distribution The probability distribution of a sample statistic. Formed
CHAPTER 5 SAMPLING DISTRIBUTIONS
 CHAPTER 5 SAMPLING DISTRIBUTIONS Sampling Variability. We will visualize our data as a random sample from the population with unknown parameter μ. Our sample mean Ȳ is intended to estimate population mean
Normal Model (Part 1)
") Normal Model (Part 1) Formulas New Vocabulary The Standard Deviation as a Ruler The trick in comparing very different-looking values is to use standard deviations as our rulers. The standard deviation
Normal Model (Part 1) Formulas New Vocabulary The Standard Deviation as a Ruler The trick in comparing very different-looking values is to use standard deviations as our rulers. The standard deviation
STATISTICAL DISTRIBUTIONS AND THE CALCULATOR
 STATISTICAL DISTRIBUTIONS AND THE CALCULATOR 1. Basic data sets a. Measures of Center - Mean ( ): average of all values. Characteristic: non-resistant is affected by skew and outliers. - Median: Either
In a binomial experiment of n trials, where p = probability of success and q = probability of failure. mean variance standard deviation
 Name In a binomial experiment of n trials, where p = probability of success and q = probability of failure mean variance standard deviation µ = n p σ = n p q σ = n p q Notation X ~ B(n, p) The probability
Data that can be any numerical value are called continuous. These are usually things that are measured, such as height, length, time, speed, etc.
 Chapter 8 Measures of Center Data that can be any numerical value are called continuous. These are usually things that are measured, such as height, length, time, speed, etc. Data that can only be integer
2011 Pearson Education, Inc
 Statistics for Business and Economics Chapter 4 Random Variables & Probability Distributions Content 1. Two Types of Random Variables 2. Probability Distributions for Discrete Random Variables 3. The Binomial
The Binomial Probability Distribution
 The Binomial Probability Distribution MATH 130, Elements of Statistics I J. Robert Buchanan Department of Mathematics Fall 2017 Objectives After this lesson we will be able to: determine whether a probability
Sampling & populations
 Sampling & populations Sample proportions Sampling distribution - small populations Sampling distribution - large populations Sampling distribution - normal distribution approximation Mean & variance of
AP STATISTICS FALL SEMESTSER FINAL EXAM STUDY GUIDE
 AP STATISTICS Name: FALL SEMESTSER FINAL EXAM STUDY GUIDE Period: *Go over Vocabulary Notecards! *This is not a comprehensive review you still should look over your past notes, homework/practice, Quizzes,
MAKING SENSE OF DATA Essentials series
 MAKING SENSE OF DATA Essentials series THE NORMAL DISTRIBUTION Copyright by City of Bradford MDC Prerequisites Descriptive statistics Charts and graphs The normal distribution Surveys and sampling Correlation
Chapter Seven. The Normal Distribution
 Chapter Seven The Normal Distribution 7-1 Introduction Many continuous variables have distributions that are bellshaped and are called approximately normally distributed variables, such as the heights
Chapter 8. Binomial and Geometric Distributions
 Chapter 8 Binomial and Geometric Distributions Lesson 8-1, Part 1 Binomial Distribution What is a Binomial Distribution? Specific type of discrete probability distribution The outcomes belong to two categories
Homework: Due Wed, Feb 20 th. Chapter 8, # 60a + 62a (count together as 1), 74, 82
, 74, 82") Announcements: Week 5 quiz begins at 4pm today and ends at 3pm on Wed If you take more than 20 minutes to complete your quiz, you will only receive partial credit. (It doesn t cut you off.) Today: Sections
Announcements: Week 5 quiz begins at 4pm today and ends at 3pm on Wed If you take more than 20 minutes to complete your quiz, you will only receive partial credit. (It doesn t cut you off.) Today: Sections
Section Distributions of Random Variables
 Section 8.1 - Distributions of Random Variables Definition: A random variable is a rule that assigns a number to each outcome of an experiment. Example 1: Suppose we toss a coin three times. Then we could
A random variable (r. v.) is a variable whose value is a numerical outcome of a random phenomenon.
 is a variable whose value is a numerical outcome of a random phenomenon.") Chapter 14: random variables p394 A random variable (r. v.) is a variable whose value is a numerical outcome of a random phenomenon. Consider the experiment of tossing a coin. Define a random variable
Chapter 14: random variables p394 A random variable (r. v.) is a variable whose value is a numerical outcome of a random phenomenon. Consider the experiment of tossing a coin. Define a random variable
Binomial Random Variable - The count X of successes in a binomial setting
 6.3.1 Binomial Settings and Binomial Random Variables What do the following scenarios have in common? Toss a coin 5 times. Count the number of heads. Spin a roulette wheel 8 times. Record how many times
Chapter 8: The Binomial and Geometric Distributions
 Chapter 8: The Binomial and Geometric Distributions 8.1 Binomial Distributions 8.2 Geometric Distributions 1 Let me begin with an example My best friends from Kent School had three daughters. What is the
SAMPLING DISTRIBUTIONS. Chapter 7
 SAMPLING DISTRIBUTIONS Chapter 7 7.1 How Likely Are the Possible Values of a Statistic? The Sampling Distribution Statistic and Parameter Statistic numerical summary of sample data: p-hat or xbar Parameter
If the distribution of a random variable x is approximately normal, then
 Confidence Intervals for the Mean (σ unknown) In many real life situations, the standard deviation is unknown. In order to construct a confidence interval for a random variable that is normally distributed
Chapter 6: Random Variables
 Chapter 6: Random Variables Section 6.3 The Practice of Statistics, 4 th edition For AP* STARNES, YATES, MOORE Chapter 6 Random Variables 6.1 Discrete and Continuous Random Variables 6.2 Transforming and
Homework: (Due Wed) Chapter 10: #5, 22, 42
 Chapter 10: #5, 22, 42") Announcements: Discussion today is review for midterm, no credit. You may attend more than one discussion section. Bring 2 sheets of notes and calculator to midterm. We will provide Scantron form. Homework:
Announcements: Discussion today is review for midterm, no credit. You may attend more than one discussion section. Bring 2 sheets of notes and calculator to midterm. We will provide Scantron form. Homework:
Econ 6900: Statistical Problems. Instructor: Yogesh Uppal
 Econ 6900: Statistical Problems Instructor: Yogesh Uppal Email: yuppal@ysu.edu Lecture Slides 4 Random Variables Probability Distributions Discrete Distributions Discrete Uniform Probability Distribution
Chapter 6 Probability
 Chapter 6 Probability Learning Objectives 1. Simulate simple experiments and compute empirical probabilities. 2. Compute both theoretical and empirical probabilities. 3. Apply the rules of probability
Section Introduction to Normal Distributions
 Section 6.1-6.2 Introduction to Normal Distributions 2012 Pearson Education, Inc. All rights reserved. 1 of 105 Section 6.1-6.2 Objectives Interpret graphs of normal probability distributions Find areas
The Binomial and Geometric Distributions. Chapter 8
 The Binomial and Geometric Distributions Chapter 8 8.1 The Binomial Distribution A binomial experiment is statistical experiment that has the following properties: The experiment consists of n repeated
As you draw random samples of size n, as n increases, the sample means tend to be normally distributed.
 The Central Limit Theorem The central limit theorem (clt for short) is one of the most powerful and useful ideas in all of statistics. The clt says that if we collect samples of size n with a "large enough
Statistical Methods in Practice STAT/MATH 3379
 Statistical Methods in Practice STAT/MATH 3379 Dr. A. B. W. Manage Associate Professor of Mathematics & Statistics Department of Mathematics & Statistics Sam Houston State University Overview 6.1 Discrete
Statistics (This summary is for chapters 18, 29 and section H of chapter 19)
") Statistics (This summary is for chapters 18, 29 and section H of chapter 19) Mean, Median, Mode Mode: most common value Median: middle value (when the values are in order) Mean = total how many = x n =
Statistics (This summary is for chapters 18, 29 and section H of chapter 19) Mean, Median, Mode Mode: most common value Median: middle value (when the values are in order) Mean = total how many = x n =
Chapter 5 Discrete Probability Distributions. Random Variables Discrete Probability Distributions Expected Value and Variance
 Chapter 5 Discrete Probability Distributions Random Variables Discrete Probability Distributions Expected Value and Variance.40.30.20.10 0 1 2 3 4 Random Variables A random variable is a numerical description
Binomial Probabilities The actual probability that P ( X k ) the formula n P X k p p. = for any k in the range {0, 1, 2,, n} is given by. n n!
 the formula n P X k p p. = for any k in the range {0, 1, 2,, n} is given by. n n!") Introduction We are often more interested in experiments in which there are two outcomes of interest (success/failure, make/miss, yes/no, etc.). In this chapter we study two types of probability distributions
Introduction We are often more interested in experiments in which there are two outcomes of interest (success/failure, make/miss, yes/no, etc.). In this chapter we study two types of probability distributions
Theoretical Foundations
 Theoretical Foundations Probabilities Monia Ranalli monia.ranalli@uniroma2.it Ranalli M. Theoretical Foundations - Probabilities 1 / 27 Objectives understand the probability basics quantify random phenomena
8.2 The Standard Deviation as a Ruler Chapter 8 The Normal and Other Continuous Distributions 8-1
 8.2 The Standard Deviation as a Ruler Chapter 8 The Normal and Other Continuous Distributions For Example: On August 8, 2011, the Dow dropped 634.8 points, sending shock waves through the financial community.
Counting Basics. Venn diagrams
 Counting Basics Sets Ways of specifying sets Union and intersection Universal set and complements Empty set and disjoint sets Venn diagrams Counting Inclusion-exclusion Multiplication principle Addition
Introduction to Statistics I
 Introduction to Statistics I Keio University, Faculty of Economics Continuous random variables Simon Clinet (Keio University) Intro to Stats November 1, 2018 1 / 18 Definition (Continuous random variable)
Chapter Seven: Confidence Intervals and Sample Size
 Chapter Seven: Confidence Intervals and Sample Size A point estimate is: The best point estimate of the population mean µ is the sample mean X. Three Properties of a Good Estimator 1. Unbiased 2. Consistent
Central Limit Theorem
 Central Limit Theorem Lots of Samples 1 Homework Read Sec 6-5. Discussion Question pg 329 Do Ex 6-5 8-15 2 Objective Use the Central Limit Theorem to solve problems involving sample means 3 Sample Means
Binomial Random Variables. Binomial Random Variables
 Bernoulli Trials Definition A Bernoulli trial is a random experiment in which there are only two possible outcomes - success and failure. 1 Tossing a coin and considering heads as success and tails as
Unit 2: Statistics Probability
 Applied Math 30 3-1: Distributions Probability Distribution: - a table or a graph that displays the theoretical probability for each outcome of an experiment. - P (any particular outcome) is between 0
Chapter 7. Confidence Intervals and Sample Sizes. Definition. Definition. Definition. Definition. Confidence Interval : CI. Point Estimate.
 Chapter 7 Confidence Intervals and Sample Sizes 7. Estimating a Proportion p 7.3 Estimating a Mean µ (σ known) 7.4 Estimating a Mean µ (σ unknown) 7.5 Estimating a Standard Deviation σ In a recent poll,
Both the quizzes and exams are closed book. However, For quizzes: Formulas will be provided with quiz papers if there is any need.
 Both the quizzes and exams are closed book. However, For quizzes: Formulas will be provided with quiz papers if there is any need. For exams (MD1, MD2, and Final): You may bring one 8.5 by 11 sheet of
Examples: Random Variables. Discrete and Continuous Random Variables. Probability Distributions
 Random Variables Examples: Random variable a variable (typically represented by x) that takes a numerical value by chance. Number of boys in a randomly selected family with three children. Possible values:
What is the probability of success? Failure? How could we do this simulation using a random number table?
 Probability Ch.4, sections 4.2 & 4.3 Binomial and Geometric Distributions Name: Date: Pd: 4.2. What is a binomial distribution? How do we find the probability of success? Suppose you have three daughters.
Chapter 9: Sampling Distributions
 Chapter 9: Sampling Distributions 9. Introduction This chapter connects the material in Chapters 4 through 8 (numerical descriptive statistics, sampling, and probability distributions, in particular) with
Key Objectives. Module 2: The Logic of Statistical Inference. Z-scores. SGSB Workshop: Using Statistical Data to Make Decisions
 SGSB Workshop: Using Statistical Data to Make Decisions Module 2: The Logic of Statistical Inference Dr. Tom Ilvento January 2006 Dr. Mugdim Pašić Key Objectives Understand the logic of statistical inference
Department of Quantitative Methods & Information Systems. Business Statistics. Chapter 6 Normal Probability Distribution QMIS 120. Dr.
 Department of Quantitative Methods & Information Systems Business Statistics Chapter 6 Normal Probability Distribution QMIS 120 Dr. Mohammad Zainal Chapter Goals After completing this chapter, you should
Chapter 7: Point Estimation and Sampling Distributions
 Chapter 7: Point Estimation and Sampling Distributions Seungchul Baek Department of Statistics, University of South Carolina STAT 509: Statistics for Engineers 1 / 20 Motivation In chapter 3, we learned
MATH 104 CHAPTER 5 page 1 NORMAL DISTRIBUTION
 MATH 104 CHAPTER 5 page 1 NORMAL DISTRIBUTION We have examined discrete random variables, those random variables for which we can list the possible values. We will now look at continuous random variables.
5.2 Random Variables, Probability Histograms and Probability Distributions
 Chapter 5 5.2 Random Variables, Probability Histograms and Probability Distributions A random variable (r.v.) can be either continuous or discrete. It takes on the possible values of an experiment. It
Chapter 8 Estimation
 Chapter 8 Estimation There are two important forms of statistical inference: estimation (Confidence Intervals) Hypothesis Testing Statistical Inference drawing conclusions about populations based on samples
Section Distributions of Random Variables
 Section 8.1 - Distributions of Random Variables Definition: A random variable is a rule that assigns a number to each outcome of an experiment. Example 1: Suppose we toss a coin three times. Then we could
Sampling Distributions
 AP Statistics Ch. 7 Notes Sampling Distributions A major field of statistics is statistical inference, which is using information from a sample to draw conclusions about a wider population. Parameter:
Homework: Due Wed, Nov 3 rd Chapter 8, # 48a, 55c and 56 (count as 1), 67a
, 67a") Homework: Due Wed, Nov 3 rd Chapter 8, # 48a, 55c and 56 (count as 1), 67a Announcements: There are some office hour changes for Nov 5, 8, 9 on website Week 5 quiz begins after class today and ends at
Homework: Due Wed, Nov 3 rd Chapter 8, # 48a, 55c and 56 (count as 1), 67a Announcements: There are some office hour changes for Nov 5, 8, 9 on website Week 5 quiz begins after class today and ends at
ECO220Y Estimation: Confidence Interval Estimator for Sample Proportions Readings: Chapter 11 (skip 11.5)
") ECO220Y Estimation: Confidence Interval Estimator for Sample Proportions Readings: Chapter 11 (skip 11.5) Fall 2011 Lecture 10 (Fall 2011) Estimation Lecture 10 1 / 23 Review: Sampling Distributions Sample
ECO220Y Estimation: Confidence Interval Estimator for Sample Proportions Readings: Chapter 11 (skip 11.5) Fall 2011 Lecture 10 (Fall 2011) Estimation Lecture 10 1 / 23 Review: Sampling Distributions Sample
5.1 Sampling Distributions for Counts and Proportions. Ulrich Hoensch MAT210 Rocky Mountain College Billings, MT 59102
 5.1 Sampling Distributions for Counts and Proportions Ulrich Hoensch MAT210 Rocky Mountain College Billings, MT 59102 Sampling and Population Distributions Example: Count of People with Bachelor s Degrees
Chapter 4 and 5 Note Guide: Probability Distributions
 Chapter 4 and 5 Note Guide: Probability Distributions Probability Distributions for a Discrete Random Variable A discrete probability distribution function has two characteristics: Each probability is
5.1 Mean, Median, & Mode
 5.1 Mean, Median, & Mode definitions Mean: Median: Mode: Example 1 The Blue Jays score these amounts of runs in their last 9 games: 4, 7, 2, 4, 10, 5, 6, 7, 7 Find the mean, median, and mode: Example 2
Chapter 6 Continuous Probability Distributions. Learning objectives
 Chapter 6 Continuous s Slide 1 Learning objectives 1. Understand continuous probability distributions 2. Understand Uniform distribution 3. Understand Normal distribution 3.1. Understand Standard normal
Binomial Distribution. Normal Approximation to the Binomial
 Binomial Distribution Normal Approximation to the Binomial /29 Homework Read Sec 6-6. Discussion Question pg 337 Do Ex 6-6 -4 2 /29 Objectives Objective: Use the normal approximation to calculate 3 /29
Chapter 14 - Random Variables
 Chapter 14 - Random Variables October 29, 2014 There are many scenarios where probabilities are used to determine risk factors. Examples include Insurance, Casino, Lottery, Business, Medical, and other
Overview. Definitions. Definitions. Graphs. Chapter 5 Probability Distributions. probability distributions
 Chapter 5 Probability Distributions 5-1 Overview 5-2 Random Variables 5-3 Binomial Probability Distributions 5-4 Mean, Variance, and Standard Deviation for the Binomial Distribution 5-5 The Poisson Distribution
CHAPTER 4 DISCRETE PROBABILITY DISTRIBUTIONS
 CHAPTER 4 DISCRETE PROBABILITY DISTRIBUTIONS A random variable is the description of the outcome of an experiment in words. The verbal description of a random variable tells you how to find or calculate
Statistics (This summary is for chapters 17, 28, 29 and section G of chapter 19)
") Statistics (This summary is for chapters 17, 28, 29 and section G of chapter 19) Mean, Median, Mode Mode: most common value Median: middle value (when the values are in order) Mean = total how many = x
Statistics (This summary is for chapters 17, 28, 29 and section G of chapter 19) Mean, Median, Mode Mode: most common value Median: middle value (when the values are in order) Mean = total how many = x
the number of correct answers on question i. (Note that the only possible values of X i
 6851_ch08_137_153 16/9/02 19:48 Page 137 8 8.1 (a) No: There is no fixed n (i.e., there is no definite upper limit on the number of defects). (b) Yes: It is reasonable to believe that all responses are
Chapter 7. Sampling Distributions and the Central Limit Theorem
 Chapter 7. Sampling Distributions and the Central Limit Theorem 1 Introduction 2 Sampling Distributions related to the normal distribution 3 The central limit theorem 4 The normal approximation to binomial
Chapter 7 Sampling Distributions and Point Estimation of Parameters
 Chapter 7 Sampling Distributions and Point Estimation of Parameters Part 1: Sampling Distributions, the Central Limit Theorem, Point Estimation & Estimators Sections 7-1 to 7-2 1 / 25 Statistical Inferences
Section 7.5 The Normal Distribution. Section 7.6 Application of the Normal Distribution
 Section 7.6 Application of the Normal Distribution A random variable that may take on infinitely many values is called a continuous random variable. A continuous probability distribution is defined by
Section Random Variables
 Section 6.2 - Random Variables According to the Bureau of the Census, the latest family data pertaining to family size for a small midwestern town, Nomore, is shown in Table 6.. If a family from this town
Chapter 7. Sampling Distributions and the Central Limit Theorem
 Chapter 7. Sampling Distributions and the Central Limit Theorem 1 Introduction 2 Sampling Distributions related to the normal distribution 3 The central limit theorem 4 The normal approximation to binomial
The Normal Probability Distribution
 1 The Normal Probability Distribution Key Definitions Probability Density Function: An equation used to compute probabilities for continuous random variables where the output value is greater than zero
Topic 1 Problems. Step 5 Exactly 13/40 = or 32.5% of the 40 stores audited generate at least 20% of sales revenue from foreign-made goods.
 Stats for Business HOMEWORK 2 Solution (updated 1/29/218) Topic 1 Problems Problem 1 A non-numerical version of the Question: Do either Wal-Mart or the consumer group appear to be correct in their claims
Chapter 7. Inferences about Population Variances
 Chapter 7. Inferences about Population Variances Introduction () The variability of a population s values is as important as the population mean. Hypothetical distribution of E. coli concentrations from
Chapter 11: Inference for Distributions Inference for Means of a Population 11.2 Comparing Two Means
 Chapter 11: Inference for Distributions 11.1 Inference for Means of a Population 11.2 Comparing Two Means 1 Population Standard Deviation In the previous chapter, we computed confidence intervals and performed
6. THE BINOMIAL DISTRIBUTION
 6. THE BINOMIAL DISTRIBUTION Eg: For 1000 borrowers in the lowest risk category (FICO score between 800 and 850), what is the probability that at least 250 of them will default on their loan (thereby rendering
Introduction to Statistical Data Analysis II
 Introduction to Statistical Data Analysis II JULY 2011 Afsaneh Yazdani Preface Major branches of Statistics: - Descriptive Statistics - Inferential Statistics Preface What is Inferential Statistics? Preface
Study Ch. 7.3, # 63 71
 GOALS: 1. Understand the distribution of the sample mean. 2. Understand that using the distribution of the sample mean with sufficiently large sample sizes enables us to use parametric statistics for distributions
A random variable (r. v.) is a variable whose value is a numerical outcome of a random phenomenon.
 is a variable whose value is a numerical outcome of a random phenomenon.") Chapter 14: random variables p394 A random variable (r. v.) is a variable whose value is a numerical outcome of a random phenomenon. Consider the experiment of tossing a coin. Define a random variable
Chapter 14: random variables p394 A random variable (r. v.) is a variable whose value is a numerical outcome of a random phenomenon. Consider the experiment of tossing a coin. Define a random variable
Chapter 5. Continuous Random Variables and Probability Distributions. 5.1 Continuous Random Variables
 Chapter 5 Continuous Random Variables and Probability Distributions 5.1 Continuous Random Variables 1 2CHAPTER 5. CONTINUOUS RANDOM VARIABLES AND PROBABILITY DISTRIBUTIONS Probability Distributions Probability
Probability & Sampling The Practice of Statistics 4e Mostly Chpts 5 7
 Probability & Sampling The Practice of Statistics 4e Mostly Chpts 5 7 Lew Davidson (Dr.D.) Mallard Creek High School Lewis.Davidson@cms.k12.nc.us 704-786-0470 Probability & Sampling The Practice of Statistics
Chapter 6.1 Confidence Intervals. Stat 226 Introduction to Business Statistics I. Chapter 6, Section 6.1
 Stat 226 Introduction to Business Statistics I Spring 2009 Professor: Dr. Petrutza Caragea Section A Tuesdays and Thursdays 9:30-10:50 a.m. Chapter 6, Section 6.1 Confidence Intervals Confidence Intervals
The Central Limit Theorem for Sums
 OpenStax-CNX module: m46997 1 The Central Limit Theorem for Sums OpenStax College This work is produced by OpenStax-CNX and licensed under the Creative Commons Attribution License 3.0 Suppose X is a random
Review of the Topics for Midterm I
 Review of the Topics for Midterm I STA 100 Lecture 9 I. Introduction The objective of statistics is to make inferences about a population based on information contained in a sample. A population is the
a) Less than 0.66 b) Greater than 0.74 c) Between 0.64 and 0.76
 Less than 0.66 b) Greater than 0.74 c) Between 0.64 and 0.76") Example #7 According to a National Sleep Foundation Survey, 70% of adults takes more than 30 minutes to fall asleep at night. Assume that this percentage is true for the population of all U.S. adults.
Example #7 According to a National Sleep Foundation Survey, 70% of adults takes more than 30 minutes to fall asleep at night. Assume that this percentage is true for the population of all U.S. adults.