Chapter 8 Estimation
|
|
|
- Coral Jacobs
- 6 years ago
- Views:
Transcription
1 Chapter 8 Estimation There are two important forms of statistical inference: estimation (Confidence Intervals) Hypothesis Testing Statistical Inference drawing conclusions about populations based on samples of the population parameter unknown : μ, σ A parameter is a number that describes the population of interest. Since we usually cannot examine the entire population of interest, parameters are generally unknown. statistic known:, s A statistic is a number that is computed from sample data. We often use a statistic to estimate an unknown population parameter. sample statistic and population parameter Notation μ = population mean (unknown) = sample mean (computed from the data we have on hand from a sample of the population) σ = population standard deviation (unknown) s = sample standard deviation (computed from the data we have on hand from a sample of the population) estimates μ s estimates Point Estimate An estimate of a population parameter given by a single number. A point estimation of a population parameter is an estimate of the parameter using a single number. is a point estimate of μ S is a point estimate of 1 P a g e
2 Sampling Variability Example: What is the average weight of women 5 1 tall between the ages of 21-45? The American Medical Association takes a sample of 1000 women between the ages of years and with height 5 1 They find that that the mean weight is = 13 2 lbs Question: If our goal is to estimate the mean weight of the population, how should we deal with the fact that different samples yield different estimates of the mean weight?? The basic fact that the value of a sample statistic varies in (hypothetical) repeated random sampling is called sampling variability. E ample: If another sample of 1000 women was chosen from the same population of 5 1 women between years old, the value of would almost certainly be different something other than lbs. Answer: Allow a margin of error that takes sampling variability into account. Confidence Intervals Confidence intervals are generally of the form point estimate ± margin of error ± margin of error Question: Why should we estimate μ, true population mean, with an interval of numbers? Why not just use the point estimate as our estimate of μ? Answer: (1) Using an interval estimate (i.e. confidence interval) takes sampling variability into consideration, and (2) we can attach a level of confidence to an interval estimate which we cannot do with a point estimate. A confidence interval for μ has two parts: 1) A margin of error says how close lies to μ 2) A level of confidence says what percent of all possible samples satisfy the margin of error. 2 P a g e
3 A confidence level, c, is any value between 0 and 1 that corresponds to the area under the standard normal curve between zc and +zc. Margin of Error Even if we take a very large sample size, may differ from µ. Critical Values For an interval of numbers there is a left endpoint and a right endpoint. (lower bound, upper bound) For a confidence level c, the critical value is the number such that the area under the standard normal curve between and equals c (your confidence level) Example - Which of the following correctly expresses the confidence interval shown below? a)p 0.99 < z < 1 = 2.58 b) P 2.58 < z < 2.58 = 0.99 c) P 0 < z < 0.99 = 5.16 d) P 2.58 < z < 2.58 = P a g e
4 Common Confidence Levels Area = 0.9 or 90% Area = 0.95 or 95% Area = 0.98 or 98% Area = 0.99 or 99% Notice as the confidence level increase the interval gets wider When constructing a confidence interval, you must decide on the risk you are willing to take of being wrong. A confidence interval is wrong if it doesn t contain the true value of the population parameter. 99% confidence ==> 1% chance of being wrong 95% confidence ==> 5% chance of being wrong 90% confidence ==> 10% chance of being wrong How confidence intervals behave High confidence says that our method almost always gives correct answers. A small margin of error says that we have pinned down the parameter quite precisely. 4 P a g e
5 The margin of error determines the width of the confidence interval. 1) The margin of error is larger for higher confidence levels. To obtain a smaller margin of error from the same data, you must be willing to accept lower confidence. 2) The margin of error is larger for smaller sample sizes. 3) The margin of error is larger for populations that have lots of variability. Interpreting confidence levels Take 95% confidence, for example. Practical Interpretation: We are confident that the is between and,on average. Statistical Interpretation: If we repeatedly take random samples of size n from the population and construct 95% confidence intervals for each sample, then in the long run 95% of these confidence intervals will capture the true value of μ Our sample is either one of the 95% for which the calculated interval captures μ, or one of the unlucky 5% that do not The idea of sampling distribution Take many samples from the same population. Collect the s from all the samples Display the distribution of the histogram, for example). s (in a The histogram will be bell-shaped and symmetric, centered at the population mean. The sampling distribution of distribution! is a normal 5 P a g e
6 Sampling Distribution The sampling distribution of a statistic is the distribution of values taken by the statistic in all possible samples of the same size from the same population. ampling Distribution of : eans that if we collect all the possible samples of si e n from the population of interest and collect all of the s and plot them in a histogram, that histogram will be bell shaped, symmetric and centered at μ with standard deviation σ/ n Facts about the sampling distribution of These facts describe how varies from one sample to the next: 1) In repeated sampling, will sometimes fall above the true value of μ and sometimes below it, but there is no systematic tendency for to overestimate or underestimate μ The sampling distribution of is centered at μ, and so is called an unbiased estimator of μ 2) The values of from larger samples are less variable than those from smaller samples. The standard deviation of the sampling distribution of is Mean of x : x x Standard Deviation of x: x x n ( ) Confidence interval for μ for 95% Confidence σ is known σ is unknown. ( ). ( ) If σ is known then we use Z c If σ is unknown then we have s, then we use t c 6 P a g e
 = < < ) = In words, c is the probability that the sample mean,, will differ from the population mean, µ, by at most, margin")
7 Maximal Margin of Error Since µ is unknown, the margin of error µ is unknown. Using confidence level c, we can say that differs from µ by at most:.. = = The Probability Statement ( ( < < ) = < < ) = In words, c is the probability that the sample mean,, will differ from the population mean, µ, by at most, margin of error. 7 P a g e

8 Confidence Intervals A c confidence interval for µ is an interval computer from sample data in such a way that c is the probability of generating an interval containing the actual value of µ Example - For a population of domesticated geese, the standard deviation of the mass is 1.3 kg. A sample of 45 geese has a mean mass of 5.7 kg. Find the confidence interval for the population mean at the 95% confidence level. Notice that we have (population standard deviation) so we can use Z c Calculator: STAT, TEST, 7: Z-Interval, Choose STAT Critical Thinking Since is a random variable, so are the endpoints. After the confidence interval is numerically fixed for a specific sample, it either does or does not contain µ. If we repeated the confidence interval process by taking multiple random samples of equal size, some intervals would capture µ and some would not! The equation ( all intervals containing µ will be c. < < ) = states that the proportion of 8 P a g e
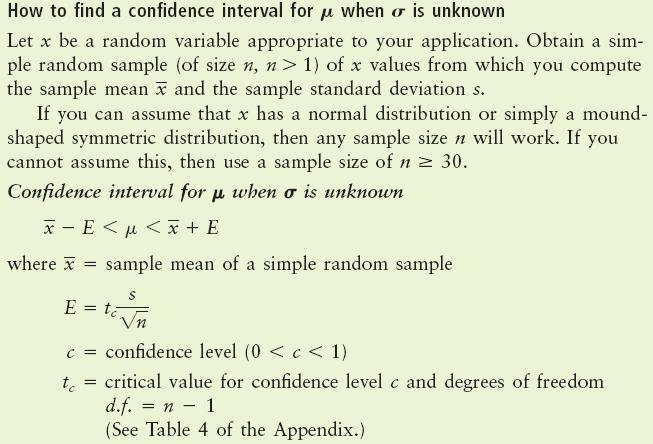
9 Estimating µ When σ is Unknown In most cases, researchers will have to estimate σ with s (the standard deviation of the sample). The sampling distribution for will follow a non-normal distribution called the Student s t distribution. The t Distribution Assume that x has a normal distribution with mean μ. For samples of size n with sample mean and sample standard deviation s, the t variable is = degrees of freedom = n-1 has a tudent s t distribution with Properties of the t-distribution bell shaped and symmetric and centered at zero there is more area in the tails in the t-distribution than there is in the N(0,1) distribution the t-distribution is really a family of density curves such that each one is significantly different depending on the degrees of freedom as degrees of freedom gets larger and larger the t-density curve looks more and more identical to the N(0,1) For different levels of Confidence: For 95% Confidence Interval For 90% Confidence Interval For 99% Confidence Interval 9 P a g e


10 Example -Find the t-value for the following data: a) b) x 55.2, 58.1, s 4.2, n 40 c) d) To find values of t c you use Table 6 of Appendix II to find the critical values t c for a confidence level c. Degrees of freedom, df, are the row headings. Confidence levels, c, are the column headings Maximal Margin of Error If we are using the t distribution: 10 P a g e
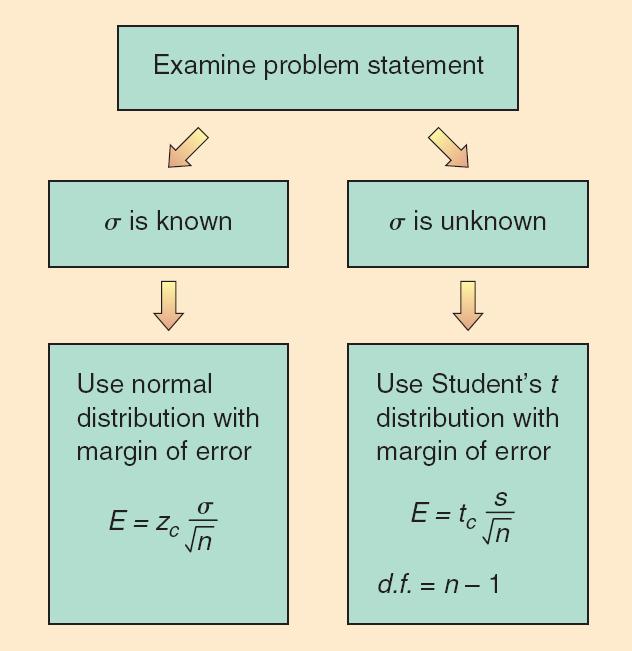
11 What Distribution Should We Use? 11 P a g e
12 Notes on Calculator: For Normal Distribution For Proportion σ is unknown σ is known Test Statistic t obs z obs Calculator Stat Test T-test Stat Test Z-test Stat Test 1-Prop Z-test Confidence ( ) ( σ Interval ) Calculator Stat Test T-Interval Stat Test Z-Interval Stat Test 1-Prop Z-Interval Example - A study was done to determine the average number of homes that a homeowner owns in his or her lifetime. For the 60 homeowners surveyed, the sample average was 4.2 and the sample standard deviation was 2.1. Calculate the 95% confidence interval for the true average number of homes that a person owns in his or her lifetime. Example - A study was done to determine the average number of homes that a homeowner owns in his or her lifetime. Suppose that this time sigma is known to be 2.8. Assume that we collect a sample of 60 homeowners and compute the sample average to be 4.2. Calculate the 95% confidence interval for the true average number of homes that a person owns in his or her lifetime. 12 P a g e
13 Example: The numbers of advertisements seen or heard in one week for 30 randomly selected people in the United States are listed below. Construct a 95% confidence interval for the true mean number of advertisements P a g e
 > 5.")
14 Estimating p in the Binomial Distribution We will use large-sample methods in which the sample size, n, is fixed. We assume the normal curve is a good approximation to the binomial distribution if both np > 5 and nq = n(1 p) > 5. Point Estimates in the Binomial Case Margin of Error The magnitude of the difference between the actual value of p and its estimate is the margin of error. The Distribution of For large samples, the distribution is well approximated by a normal distribution. A Probability Statement With confidence level c, as before. 14 P a g e

15 Example - Suppose that 800 students were randomly selected from the student body of 20,000 and are given shots to prevent a certain type of flu. All 800 students were exposed to the flu, and 600 of them did not get the flu. Let p represent the probability that the shot will be successful for any single student selected at random from the entire population of 20,000. a) What are the point estimates for p and q? What is the value of n and r? b) Is the number of trials large enough to justify a normal approximation to the binomial? 15 P a g e
16 c) Find a 99% confidence interval for p. Calculator: STAT, TESTS, A: 1- Prop Z Int. The value of x = r Example: A survey of 300 fatal accidents showed that 123 were alcohol related. Construct a 98% confidence interval for the proportion of fatal accidents that were alcohol related. 16 P a g e


17 Choosing Sample Sizes When designing statistical studies, it is good practice to decide in advance: The confidence level The maximal margin of error Then, we can calculate the required minimum sample size to meet these goals. Sample Size for Estimating μ If σ is unknown, use σ from a previous study or conduct a pilot study to obtain s. Always round n up to the next integer!! Sample Size for Estimating If we have a preliminary estimate for p, use the following. If we have no preliminary estimate for p, use the following modification: Example A wildlife study is designed to find the mean weight of salmon caught be an Alaskan fishing company. A preliminary study of a random sample of 50 salmon showed = 2.15 pounds. How large a sample should be taken to be 90% confident that the sample mean, is within 0.20 pounds of the true mean weight μ? 17 P a g e
18 Example: A researcher wishes to estimate the number of households with two cars. How large a sample is needed in order to be 98% confident that the sample proportion will not differ from the true proportion by more than 5%? A previous study indicates that the proportion of households with two cars is 19%. 18 P a g e
Estimation. Focus Points 10/11/2011. Estimating p in the Binomial Distribution. Section 7.3
 Estimation 7 Copyright Cengage Learning. All rights reserved. Section 7.3 Estimating p in the Binomial Distribution Copyright Cengage Learning. All rights reserved. Focus Points Compute the maximal length
Section 8.1 Estimating μ When σ is Known
 Chapter 8 Estimation Name Section 8.1 Estimating μ When σ is Known Objective: In this lesson you learned to explain the meanings of confidence level, error of estimate, and critical value; to find the
LESSON 7 INTERVAL ESTIMATION SAMIE L.S. LY
 LESSON 7 INTERVAL ESTIMATION SAMIE L.S. LY 1 THIS WEEK S PLAN Part I: Theory + Practice ( Interval Estimation ) Part II: Theory + Practice ( Interval Estimation ) z-based Confidence Intervals for a Population
Statistical Intervals (One sample) (Chs )
 (Chs )") 7 Statistical Intervals (One sample) (Chs 8.1-8.3) Confidence Intervals The CLT tells us that as the sample size n increases, the sample mean X is close to normally distributed with expected value µ and
7 Statistical Intervals (One sample) (Chs 8.1-8.3) Confidence Intervals The CLT tells us that as the sample size n increases, the sample mean X is close to normally distributed with expected value µ and
3/28/18. Estimation. Focus Points. Focus Points. Estimating p in the Binomial Distribution. Estimating p in the Binomial Distribution. Section 7.
 Which side of a cheetah has the most spots? Estimation The outside. 7 Section 7.3 Estimating p in the Binomial Distribution Boy, I m tired. I ve been up since the quack of dawn. Focus Points Compute the
If the distribution of a random variable x is approximately normal, then
 Confidence Intervals for the Mean (σ unknown) In many real life situations, the standard deviation is unknown. In order to construct a confidence interval for a random variable that is normally distributed
ECON 214 Elements of Statistics for Economists 2016/2017
 ECON 214 Elements of Statistics for Economists 2016/2017 Topic The Normal Distribution Lecturer: Dr. Bernardin Senadza, Dept. of Economics bsenadza@ug.edu.gh College of Education School of Continuing and
STAT Chapter 7: Confidence Intervals
 STAT 515 -- Chapter 7: Confidence Intervals With a point estimate, we used a single number to estimate a parameter. We can also use a set of numbers to serve as reasonable estimates for the parameter.
T.I.H.E. IT 233 Statistics and Probability: Sem. 1: 2013 ESTIMATION
 In Inferential Statistic, ESTIMATION (i) (ii) is called the True Population Mean and is called the True Population Proportion. You must also remember that are not the only population parameters. There
Statistical Intervals. Chapter 7 Stat 4570/5570 Material from Devore s book (Ed 8), and Cengage
, and Cengage") 7 Statistical Intervals Chapter 7 Stat 4570/5570 Material from Devore s book (Ed 8), and Cengage Confidence Intervals The CLT tells us that as the sample size n increases, the sample mean X is close to
7 Statistical Intervals Chapter 7 Stat 4570/5570 Material from Devore s book (Ed 8), and Cengage Confidence Intervals The CLT tells us that as the sample size n increases, the sample mean X is close to
Chapter 7. Sampling Distributions
 Chapter 7 Sampling Distributions Section 7.1 Sampling Distributions and the Central Limit Theorem Sampling Distributions Sampling distribution The probability distribution of a sample statistic. Formed
Statistics 13 Elementary Statistics
 Statistics 13 Elementary Statistics Summer Session I 2012 Lecture Notes 5: Estimation with Confidence intervals 1 Our goal is to estimate the value of an unknown population parameter, such as a population
8.1 Estimation of the Mean and Proportion
 8.1 Estimation of the Mean and Proportion Statistical inference enables us to make judgments about a population on the basis of sample information. The mean, standard deviation, and proportions of a population
Chapter 6 Confidence Intervals Section 6-1 Confidence Intervals for the Mean (Large Samples) Estimating Population Parameters
 Estimating Population Parameters") Chapter 6 Confidence Intervals Section 6-1 Confidence Intervals for the Mean (Large Samples) Estimating Population Parameters VOCABULARY: Point Estimate a value for a parameter. The most point estimate
Chapter 6 Confidence Intervals Section 6-1 Confidence Intervals for the Mean (Large Samples) Estimating Population Parameters VOCABULARY: Point Estimate a value for a parameter. The most point estimate
CH 5 Normal Probability Distributions Properties of the Normal Distribution
 Properties of the Normal Distribution Example A friend that is always late. Let X represent the amount of minutes that pass from the moment you are suppose to meet your friend until the moment your friend
ECON 214 Elements of Statistics for Economists
 ECON 214 Elements of Statistics for Economists Session 7 The Normal Distribution Part 1 Lecturer: Dr. Bernardin Senadza, Dept. of Economics Contact Information: bsenadza@ug.edu.gh College of Education
STAT Chapter 5: Continuous Distributions. Probability distributions are used a bit differently for continuous r.v. s than for discrete r.v. s.
 STAT 515 -- Chapter 5: Continuous Distributions Probability distributions are used a bit differently for continuous r.v. s than for discrete r.v. s. Continuous distributions typically are represented by
Interval estimation. September 29, Outline Basic ideas Sampling variation and CLT Interval estimation using X More general problems
 Interval estimation September 29, 2017 STAT 151 Class 7 Slide 1 Outline of Topics 1 Basic ideas 2 Sampling variation and CLT 3 Interval estimation using X 4 More general problems STAT 151 Class 7 Slide
Chapter 8 Statistical Intervals for a Single Sample
 Chapter 8 Statistical Intervals for a Single Sample Part 1: Confidence intervals (CI) for population mean µ Section 8-1: CI for µ when σ 2 known & drawing from normal distribution Section 8-1.2: Sample
CHAPTER 8. Confidence Interval Estimation Point and Interval Estimates
 CHAPTER 8. Confidence Interval Estimation Point and Interval Estimates A point estimate is a single number, a confidence interval provides additional information about the variability of the estimate Lower
Lecture Slides. Elementary Statistics Tenth Edition. by Mario F. Triola. and the Triola Statistics Series. Slide 1
 Lecture Slides Elementary Statistics Tenth Edition and the Triola Statistics Series by Mario F. Triola Slide 1 Chapter 6 Normal Probability Distributions 6-1 Overview 6-2 The Standard Normal Distribution
Section 7.5 The Normal Distribution. Section 7.6 Application of the Normal Distribution
 Section 7.6 Application of the Normal Distribution A random variable that may take on infinitely many values is called a continuous random variable. A continuous probability distribution is defined by
Determining Sample Size. Slide 1 ˆ ˆ. p q n E = z α / 2. (solve for n by algebra) n = E 2
 n = E 2") Determining Sample Size Slide 1 E = z α / 2 ˆ ˆ p q n (solve for n by algebra) n = ( zα α / 2) 2 p ˆ qˆ E 2 Sample Size for Estimating Proportion p When an estimate of ˆp is known: Slide 2 n = ˆ ˆ ( )
Determining Sample Size Slide 1 E = z α / 2 ˆ ˆ p q n (solve for n by algebra) n = ( zα α / 2) 2 p ˆ qˆ E 2 Sample Size for Estimating Proportion p When an estimate of ˆp is known: Slide 2 n = ˆ ˆ ( )
STAT Chapter 5: Continuous Distributions. Probability distributions are used a bit differently for continuous r.v. s than for discrete r.v. s.
 STAT 515 -- Chapter 5: Continuous Distributions Probability distributions are used a bit differently for continuous r.v. s than for discrete r.v. s. Continuous distributions typically are represented by
Chapter 6 Confidence Intervals
 Chapter 6 Confidence Intervals Section 6-1 Confidence Intervals for the Mean (Large Samples) VOCABULARY: Point Estimate A value for a parameter. The most point estimate of the population parameter is the
Statistics 431 Spring 2007 P. Shaman. Preliminaries
 Statistics 4 Spring 007 P. Shaman The Binomial Distribution Preliminaries A binomial experiment is defined by the following conditions: A sequence of n trials is conducted, with each trial having two possible
Statistical Methods in Practice STAT/MATH 3379
 Statistical Methods in Practice STAT/MATH 3379 Dr. A. B. W. Manage Associate Professor of Mathematics & Statistics Department of Mathematics & Statistics Sam Houston State University Overview 6.1 Discrete
Chapter 6.1 Confidence Intervals. Stat 226 Introduction to Business Statistics I. Chapter 6, Section 6.1
 Stat 226 Introduction to Business Statistics I Spring 2009 Professor: Dr. Petrutza Caragea Section A Tuesdays and Thursdays 9:30-10:50 a.m. Chapter 6, Section 6.1 Confidence Intervals Confidence Intervals
MATH 104 CHAPTER 5 page 1 NORMAL DISTRIBUTION
 MATH 104 CHAPTER 5 page 1 NORMAL DISTRIBUTION We have examined discrete random variables, those random variables for which we can list the possible values. We will now look at continuous random variables.
MA131 Lecture 9.1. = µ = 25 and σ X P ( 90 < X < 100 ) = = /// σ X
 = = /// σ X") The Central Limit Theorem (CLT): As the sample size n increases, the shape of the distribution of the sample means taken with replacement from the population with mean µ and standard deviation σ will approach
The Central Limit Theorem (CLT): As the sample size n increases, the shape of the distribution of the sample means taken with replacement from the population with mean µ and standard deviation σ will approach
Chapter 14 : Statistical Inference 1. Note : Here the 4-th and 5-th editions of the text have different chapters, but the material is the same.
 Chapter 14 : Statistical Inference 1 Chapter 14 : Introduction to Statistical Inference Note : Here the 4-th and 5-th editions of the text have different chapters, but the material is the same. Data x
2011 Pearson Education, Inc
 Statistics for Business and Economics Chapter 4 Random Variables & Probability Distributions Content 1. Two Types of Random Variables 2. Probability Distributions for Discrete Random Variables 3. The Binomial
Statistics for Business and Economics: Random Variables:Continuous
 Statistics for Business and Economics: Random Variables:Continuous STT 315: Section 107 Acknowledgement: I d like to thank Dr. Ashoke Sinha for allowing me to use and edit the slides. Murray Bourne (interactive
Chapter 7 Sampling Distributions and Point Estimation of Parameters
 Chapter 7 Sampling Distributions and Point Estimation of Parameters Part 1: Sampling Distributions, the Central Limit Theorem, Point Estimation & Estimators Sections 7-1 to 7-2 1 / 25 Statistical Inferences
Point Estimation. Stat 4570/5570 Material from Devore s book (Ed 8), and Cengage
, and Cengage") 6 Point Estimation Stat 4570/5570 Material from Devore s book (Ed 8), and Cengage Point Estimation Statistical inference: directed toward conclusions about one or more parameters. We will use the generic
6 Point Estimation Stat 4570/5570 Material from Devore s book (Ed 8), and Cengage Point Estimation Statistical inference: directed toward conclusions about one or more parameters. We will use the generic
Estimating parameters 5.3 Confidence Intervals 5.4 Sample Variance
 Estimating parameters 5.3 Confidence Intervals 5.4 Sample Variance Prof. Tesler Math 186 Winter 2017 Prof. Tesler Ch. 5: Confidence Intervals, Sample Variance Math 186 / Winter 2017 1 / 29 Estimating parameters
CHAPTER 5 Sampling Distributions
 CHAPTER 5 Sampling Distributions 5.1 The possible values of p^ are 0, 1/3, 2/3, and 1. These correspond to getting 0 persons with lung cancer, 1 with lung cancer, 2 with lung cancer, and all 3 with lung
Distribution. Lecture 34 Section Fri, Oct 31, Hampden-Sydney College. Student s t Distribution. Robb T. Koether.
 Lecture 34 Section 10.2 Hampden-Sydney College Fri, Oct 31, 2008 Outline 1 2 3 4 5 6 7 8 Exercise 10.4, page 633. A psychologist is studying the distribution of IQ scores of girls at an alternative high
The normal distribution is a theoretical model derived mathematically and not empirically.
 Sociology 541 The Normal Distribution Probability and An Introduction to Inferential Statistics Normal Approximation The normal distribution is a theoretical model derived mathematically and not empirically.
Lecture 12. Some Useful Continuous Distributions. The most important continuous probability distribution in entire field of statistics.
 ENM 207 Lecture 12 Some Useful Continuous Distributions Normal Distribution The most important continuous probability distribution in entire field of statistics. Its graph, called the normal curve, is
Chapter 6. The Normal Probability Distributions
 Chapter 6 The Normal Probability Distributions 1 Chapter 6 Overview Introduction 6-1 Normal Probability Distributions 6-2 The Standard Normal Distribution 6-3 Applications of the Normal Distribution 6-5
Math 251: Practice Questions Hints and Answers. Review II. Questions from Chapters 4 6
 Math 251: Practice Questions Hints and Answers Review II. Questions from Chapters 4 6 II.A Probability II.A.1. The following is from a sample of 500 bikers who attended the annual rally in Sturgis South
Confidence Intervals Introduction
 Confidence Intervals Introduction A point estimate provides no information about the precision and reliability of estimation. For example, the sample mean X is a point estimate of the population mean μ
Chapter 7: SAMPLING DISTRIBUTIONS & POINT ESTIMATION OF PARAMETERS
 Chapter 7: SAMPLING DISTRIBUTIONS & POINT ESTIMATION OF PARAMETERS Part 1: Introduction Sampling Distributions & the Central Limit Theorem Point Estimation & Estimators Sections 7-1 to 7-2 Sample data
Statistics and Probability
 Statistics and Probability Continuous RVs (Normal); Confidence Intervals Outline Continuous random variables Normal distribution CLT Point estimation Confidence intervals http://www.isrec.isb-sib.ch/~darlene/geneve/
Key Objectives. Module 2: The Logic of Statistical Inference. Z-scores. SGSB Workshop: Using Statistical Data to Make Decisions
 SGSB Workshop: Using Statistical Data to Make Decisions Module 2: The Logic of Statistical Inference Dr. Tom Ilvento January 2006 Dr. Mugdim Pašić Key Objectives Understand the logic of statistical inference
Homework: Due Wed, Nov 3 rd Chapter 8, # 48a, 55c and 56 (count as 1), 67a
, 67a") Homework: Due Wed, Nov 3 rd Chapter 8, # 48a, 55c and 56 (count as 1), 67a Announcements: There are some office hour changes for Nov 5, 8, 9 on website Week 5 quiz begins after class today and ends at
Homework: Due Wed, Nov 3 rd Chapter 8, # 48a, 55c and 56 (count as 1), 67a Announcements: There are some office hour changes for Nov 5, 8, 9 on website Week 5 quiz begins after class today and ends at
Hypothesis Tests: One Sample Mean Cal State Northridge Ψ320 Andrew Ainsworth PhD
 Hypothesis Tests: One Sample Mean Cal State Northridge Ψ320 Andrew Ainsworth PhD MAJOR POINTS Sampling distribution of the mean revisited Testing hypotheses: sigma known An example Testing hypotheses:
Point Estimation. Some General Concepts of Point Estimation. Example. Estimator quality
 Point Estimation Some General Concepts of Point Estimation Statistical inference = conclusions about parameters Parameters == population characteristics A point estimate of a parameter is a value (based
AMS7: WEEK 4. CLASS 3
 AMS7: WEEK 4. CLASS 3 Sampling distributions and estimators. Central Limit Theorem Normal Approximation to the Binomial Distribution Friday April 24th, 2015 Sampling distributions and estimators REMEMBER:
The Binomial Distribution
 The Binomial Distribution January 31, 2018 Contents The Binomial Distribution The Normal Approximation to the Binomial The Binomial Hypothesis Test Computing Binomial Probabilities in R 30 Problems The
Data Analysis. BCF106 Fundamentals of Cost Analysis
 Data Analysis BCF106 Fundamentals of Cost Analysis June 009 Chapter 5 Data Analysis 5.0 Introduction... 3 5.1 Terminology... 3 5. Measures of Central Tendency... 5 5.3 Measures of Dispersion... 7 5.4 Frequency
Confidence Intervals. σ unknown, small samples The t-statistic /22
 Confidence Intervals σ unknown, small samples The t-statistic 1 /22 Homework Read Sec 7-3. Discussion Question pg 365 Do Ex 7-3 1-4, 6, 9, 12, 14, 15, 17 2/22 Objective find the confidence interval for
The Binomial Distribution
 The Binomial Distribution January 31, 2019 Contents The Binomial Distribution The Normal Approximation to the Binomial The Binomial Hypothesis Test Computing Binomial Probabilities in R 30 Problems The
Example - Let X be the number of boys in a 4 child family. Find the probability distribution table:
 Chapter7 Probability Distributions and Statistics Distributions of Random Variables tthe value of the result of the probability experiment is a RANDOM VARIABLE. Example - Let X be the number of boys in
Chapter Seven: Confidence Intervals and Sample Size
 Chapter Seven: Confidence Intervals and Sample Size A point estimate is: The best point estimate of the population mean µ is the sample mean X. Three Properties of a Good Estimator 1. Unbiased 2. Consistent
6.1, 7.1 Estimating with confidence (CIS: Chapter 10)
") Objectives 6.1, 7.1 Estimating with confidence (CIS: Chapter 10) Statistical confidence (CIS gives a good explanation of a 95% CI) Confidence intervals Choosing the sample size t distributions One-sample
Objectives 6.1, 7.1 Estimating with confidence (CIS: Chapter 10) Statistical confidence (CIS gives a good explanation of a 95% CI) Confidence intervals Choosing the sample size t distributions One-sample
Unit2: Probabilityanddistributions. 3. Normal and binomial distributions
 Announcements Unit2: Probabilityanddistributions 3. Normal and binomial distributions Sta 101 - Summer 2017 Duke University, Department of Statistical Science PS: Explain your reasoning + show your work
Unit 5: Sampling Distributions of Statistics
 Unit 5: Sampling Distributions of Statistics Statistics 571: Statistical Methods Ramón V. León 6/12/2004 Unit 5 - Stat 571 - Ramon V. Leon 1 Definitions and Key Concepts A sample statistic used to estimate
1 Small Sample CI for a Population Mean µ
 Lecture 7: Small Sample Confidence Intervals Based on a Normal Population Distribution Readings: Sections 7.4-7.5 1 Small Sample CI for a Population Mean µ The large sample CI x ± z α/2 s n was constructed
Unit 5: Sampling Distributions of Statistics
 Unit 5: Sampling Distributions of Statistics Statistics 571: Statistical Methods Ramón V. León 6/12/2004 Unit 5 - Stat 571 - Ramon V. Leon 1 Definitions and Key Concepts A sample statistic used to estimate
Solutions for practice questions: Chapter 15, Probability Distributions If you find any errors, please let me know at
 Solutions for practice questions: Chapter 15, Probability Distributions If you find any errors, please let me know at mailto:msfrisbie@pfrisbie.com. 1. Let X represent the savings of a resident; X ~ N(3000,
Example - Let X be the number of boys in a 4 child family. Find the probability distribution table:
 Chapter8 Probability Distributions and Statistics Section 8.1 Distributions of Random Variables tthe value of the result of the probability experiment is a RANDOM VARIABLE. Example - Let X be the number
Continuous Probability Distributions & Normal Distribution
 Mathematical Methods Units 3/4 Student Learning Plan Continuous Probability Distributions & Normal Distribution 7 lessons Notes: Students need practice in recognising whether a problem involves a discrete
Data that can be any numerical value are called continuous. These are usually things that are measured, such as height, length, time, speed, etc.
 Chapter 8 Measures of Center Data that can be any numerical value are called continuous. These are usually things that are measured, such as height, length, time, speed, etc. Data that can only be integer
Contents. The Binomial Distribution. The Binomial Distribution The Normal Approximation to the Binomial Left hander example
 Contents The Binomial Distribution The Normal Approximation to the Binomial Left hander example The Binomial Distribution When you flip a coin there are only two possible outcomes - heads or tails. This
Both the quizzes and exams are closed book. However, For quizzes: Formulas will be provided with quiz papers if there is any need.
 Both the quizzes and exams are closed book. However, For quizzes: Formulas will be provided with quiz papers if there is any need. For exams (MD1, MD2, and Final): You may bring one 8.5 by 11 sheet of
Class 16. Daniel B. Rowe, Ph.D. Department of Mathematics, Statistics, and Computer Science. Marquette University MATH 1700
 Class 16 Daniel B. Rowe, Ph.D. Department of Mathematics, Statistics, and Computer Science Copyright 013 by D.B. Rowe 1 Agenda: Recap Chapter 7. - 7.3 Lecture Chapter 8.1-8. Review Chapter 6. Problem Solving
Normal Probability Distributions
 Normal Probability Distributions Properties of Normal Distributions The most important probability distribution in statistics is the normal distribution. Normal curve A normal distribution is a continuous
Part V - Chance Variability
 Part V - Chance Variability Dr. Joseph Brennan Math 148, BU Dr. Joseph Brennan (Math 148, BU) Part V - Chance Variability 1 / 78 Law of Averages In Chapter 13 we discussed the Kerrich coin-tossing experiment.
1. Statistical problems - a) Distribution is known. b) Distribution is unknown.
 Distribution is known. b) Distribution is unknown.") Probability February 5, 2013 Debdeep Pati Estimation 1. Statistical problems - a) Distribution is known. b) Distribution is unknown. 2. When Distribution is known, then we can have either i) Parameters
Probability February 5, 2013 Debdeep Pati Estimation 1. Statistical problems - a) Distribution is known. b) Distribution is unknown. 2. When Distribution is known, then we can have either i) Parameters
Unit 2: Statistics Probability
 Applied Math 30 3-1: Distributions Probability Distribution: - a table or a graph that displays the theoretical probability for each outcome of an experiment. - P (any particular outcome) is between 0
Confidence Intervals and Sample Size
 Confidence Intervals and Sample Size Chapter 6 shows us how we can use the Central Limit Theorem (CLT) to 1. estimate a population parameter (such as the mean or proportion) using a sample, and. determine
Expected Value of a Random Variable
 Knowledge Article: Probability and Statistics Expected Value of a Random Variable Expected Value of a Discrete Random Variable You're familiar with a simple mean, or average, of a set. The mean value of
CHAPTER 4 DISCRETE PROBABILITY DISTRIBUTIONS
 CHAPTER 4 DISCRETE PROBABILITY DISTRIBUTIONS A random variable is the description of the outcome of an experiment in words. The verbal description of a random variable tells you how to find or calculate
Math 14 Lecture Notes Ch The Normal Approximation to the Binomial Distribution. P (X ) = nc X p X q n X =
 = nc X p X q n X =") 6.4 The Normal Approximation to the Binomial Distribution Recall from section 6.4 that g A binomial experiment is a experiment that satisfies the following four requirements: 1. Each trial can have only
6.4 The Normal Approximation to the Binomial Distribution Recall from section 6.4 that g A binomial experiment is a experiment that satisfies the following four requirements: 1. Each trial can have only
Statistics (This summary is for chapters 17, 28, 29 and section G of chapter 19)
") Statistics (This summary is for chapters 17, 28, 29 and section G of chapter 19) Mean, Median, Mode Mode: most common value Median: middle value (when the values are in order) Mean = total how many = x
Statistics (This summary is for chapters 17, 28, 29 and section G of chapter 19) Mean, Median, Mode Mode: most common value Median: middle value (when the values are in order) Mean = total how many = x
μ: ESTIMATES, CONFIDENCE INTERVALS, AND TESTS Business Statistics
 μ: ESTIMATES, CONFIDENCE INTERVALS, AND TESTS Business Statistics CONTENTS Estimating parameters The sampling distribution Confidence intervals for μ Hypothesis tests for μ The t-distribution Comparison
MidTerm 1) Find the following (round off to one decimal place):
 Find the following (round off to one decimal place):") MidTerm 1) 68 49 21 55 57 61 70 42 59 50 66 99 Find the following (round off to one decimal place): Mean = 58:083, round off to 58.1 Median = 58 Range = max min = 99 21 = 78 St. Deviation = s = 8:535,
MidTerm 1) 68 49 21 55 57 61 70 42 59 50 66 99 Find the following (round off to one decimal place): Mean = 58:083, round off to 58.1 Median = 58 Range = max min = 99 21 = 78 St. Deviation = s = 8:535,
Chapter ! Bell Shaped
 Chapter 6 6-1 Business Statistics: A First Course 5 th Edition Chapter 7 Continuous Probability Distributions Learning Objectives In this chapter, you learn:! To compute probabilities from the normal distribution!
Math 227 Elementary Statistics. Bluman 5 th edition
 Math 227 Elementary Statistics Bluman 5 th edition CHAPTER 6 The Normal Distribution 2 Objectives Identify distributions as symmetrical or skewed. Identify the properties of the normal distribution. Find
GETTING STARTED. To OPEN MINITAB: Click Start>Programs>Minitab14>Minitab14 or Click Minitab 14 on your Desktop
 Minitab 14 1 GETTING STARTED To OPEN MINITAB: Click Start>Programs>Minitab14>Minitab14 or Click Minitab 14 on your Desktop The Minitab session will come up like this 2 To SAVE FILE 1. Click File>Save Project
Section Introduction to Normal Distributions
 Section 6.1-6.2 Introduction to Normal Distributions 2012 Pearson Education, Inc. All rights reserved. 1 of 105 Section 6.1-6.2 Objectives Interpret graphs of normal probability distributions Find areas
Homework: Due Wed, Feb 20 th. Chapter 8, # 60a + 62a (count together as 1), 74, 82
, 74, 82") Announcements: Week 5 quiz begins at 4pm today and ends at 3pm on Wed If you take more than 20 minutes to complete your quiz, you will only receive partial credit. (It doesn t cut you off.) Today: Sections
Announcements: Week 5 quiz begins at 4pm today and ends at 3pm on Wed If you take more than 20 minutes to complete your quiz, you will only receive partial credit. (It doesn t cut you off.) Today: Sections
Statistics (This summary is for chapters 18, 29 and section H of chapter 19)
") Statistics (This summary is for chapters 18, 29 and section H of chapter 19) Mean, Median, Mode Mode: most common value Median: middle value (when the values are in order) Mean = total how many = x n =
Statistics (This summary is for chapters 18, 29 and section H of chapter 19) Mean, Median, Mode Mode: most common value Median: middle value (when the values are in order) Mean = total how many = x n =
Sampling Distributions
 AP Statistics Ch. 7 Notes Sampling Distributions A major field of statistics is statistical inference, which is using information from a sample to draw conclusions about a wider population. Parameter:
Learning Objectives for Ch. 7
 Chapter 7: Point and Interval Estimation Hildebrand, Ott and Gray Basic Statistical Ideas for Managers Second Edition 1 Learning Objectives for Ch. 7 Obtaining a point estimate of a population parameter
Introduction to Statistics I
 Introduction to Statistics I Keio University, Faculty of Economics Continuous random variables Simon Clinet (Keio University) Intro to Stats November 1, 2018 1 / 18 Definition (Continuous random variable)
Lecture 2 INTERVAL ESTIMATION II
 Lecture 2 INTERVAL ESTIMATION II Recap Population of interest - want to say something about the population mean µ perhaps Take a random sample... Recap When our random sample follows a normal distribution,
PROBABILITY DISTRIBUTIONS
 CHAPTER 3 PROBABILITY DISTRIBUTIONS Page Contents 3.1 Introduction to Probability Distributions 51 3.2 The Normal Distribution 56 3.3 The Binomial Distribution 60 3.4 The Poisson Distribution 64 Exercise
8.2 The Standard Deviation as a Ruler Chapter 8 The Normal and Other Continuous Distributions 8-1
 8.2 The Standard Deviation as a Ruler Chapter 8 The Normal and Other Continuous Distributions For Example: On August 8, 2011, the Dow dropped 634.8 points, sending shock waves through the financial community.
Elementary Statistics Triola, Elementary Statistics 11/e Unit 14 The Confidence Interval for Means, σ Unknown
 Elementary Statistics We are now ready to begin our exploration of how we make estimates of the population mean. Before we get started, I want to emphasize the importance of having collected a representative
Math 120 Introduction to Statistics Mr. Toner s Lecture Notes. Standardizing normal distributions The Standard Normal Curve
 6.1 6.2 The Standard Normal Curve Standardizing normal distributions The "bell-shaped" curve, or normal curve, is a probability distribution that describes many reallife situations. Basic Properties 1.
Lecture 6: Chapter 6
 Lecture 6: Chapter 6 C C Moxley UAB Mathematics 3 October 16 6.1 Continuous Probability Distributions Last week, we discussed the binomial probability distribution, which was discrete. 6.1 Continuous Probability
Y i % (% ( ( ' & ( # % s 2 = ( ( Review - order of operations. Samples and populations. Review - order of operations. Review - order of operations
 Review - order of operations Samples and populations Estimating with uncertainty s 2 = # % # n & % % $ n "1'% % $ n ) i=1 Y i 2 n & "Y 2 ' Review - order of operations Review - order of operations 1. Parentheses
Normal distribution. We say that a random variable X follows the normal distribution if the probability density function of X is given by
 Normal distribution The normal distribution is the most important distribution. It describes well the distribution of random variables that arise in practice, such as the heights or weights of people,
Previously, when making inferences about the population mean, μ, we were assuming the following simple conditions:
 Chapter 17 Inference about a Population Mean Conditions for inference Previously, when making inferences about the population mean, μ, we were assuming the following simple conditions: (1) Our data (observations)
The Normal Probability Distribution
 1 The Normal Probability Distribution Key Definitions Probability Density Function: An equation used to compute probabilities for continuous random variables where the output value is greater than zero
The "bell-shaped" curve, or normal curve, is a probability distribution that describes many real-life situations.
 6.1 6.2 The Standard Normal Curve The "bell-shaped" curve, or normal curve, is a probability distribution that describes many real-life situations. Basic Properties 1. The total area under the curve is.
MATH 264 Problem Homework I
 MATH Problem Homework I Due to December 9, 00@:0 PROBLEMS & SOLUTIONS. A student answers a multiple-choice examination question that offers four possible answers. Suppose that the probability that the