GETTING STARTED. To OPEN MINITAB: Click Start>Programs>Minitab14>Minitab14 or Click Minitab 14 on your Desktop
|
|
|
- Gwendoline French
- 6 years ago
- Views:
Transcription
1 Minitab 14 1


2 GETTING STARTED To OPEN MINITAB: Click Start>Programs>Minitab14>Minitab14 or Click Minitab 14 on your Desktop The Minitab session will come up like this 2


3 To SAVE FILE 1. Click File>Save Project As 2. A dialog box will come up like 3


4 3. Do the followings Click to make new folder Type the folder name and press enter Type the file name and press enter To OPEN A SAVED FILE 1. click File>Open Project 4


5 2. A new dialog box will be shown on screen like Select the file and press enter or click open To EXIT from Minitab Click File>Exit 5
6 Using CALCULATOR Sometimes we need to manipulate variables. For example, suppose we are given Height (in inch) of 10 students, but we want it in Feet. Height: 65, 66, 64, 68, 65, 67, 66, 70, 72, 68 That is, we want to convert the variable and get a new one with units in feet. The rules for converting variable is very simple Converting Variable 1. Go to Calculation from Menu-bar 2. Click Calculator 3. Write the variable name in Store result in variable. (you can use the same variable name, then the earlier variable will be replaced by the converted one or you can use different variable name) 4. Then in the Expression, mention what to calculate. Calculation of Height (inch) into Height (ft) 1. Go to Calculation from Menu-bar 2. Click Calculator 3. Write the variable name in Height Ft. (If you use Height, then the values of Height will be replaced by new one, i.e. 1 st value of Height 65 will be replaced by and so on) 4. Then in the Expression, write Height / 12 (There are many other options functions located in the Function scroll menu). Question: The table below is the scores of 50 students in a mathematics course: Construct a stem-and-leaf display for all 50 scores Construct a histogram for all 50 scores Calculate the mean, median and variance of all scores 6

7 Inputting Data In Minitab: 1. Input data in Worksheet Window. 2. Input variables in columns. 3. First row of worksheet window can be used for variables names. Minitab Project Report (a) Steps: 1. Go to the menu "Graph" 2. Select: "Stem-and-leaf" 3. Select the variable "Score" 4. Write the increment = Click "OK" Output: Stem-and-leaf of Score N = 50 Leaf Unit = (12)


8 (b) Steps: 1. Go to the menu "Graph" 2. Select: "Histogram" 3. Select the variable "Score" under 'Graph variables' 4. Choose "Bar" under 'Display' and "Graph" under 'For each' 5. Click "Annotation" dropdown menu and select "Title" to write a title of the graph 6. Click "OK" Output: Graphical representation of scores of 50 students using Histogram 20 Frequency Score 8


9 (c) Steps: 1. Go to the menu "Stat" 2. Select "Display Descriptive Statistics" under 'Basic Statistics' 3. Select the variable "Score" 4. Click "OK" Output: Descriptive Statistics: Score Variable N Mean Median TrMean StDev SE Mean Score Variable Minimum Maximum Q1 Q3 Score Downloading data from the webpage: 1. Go to the webpage 2. Save data in your computer. 3. Click Files>open worksheet> data file name 9
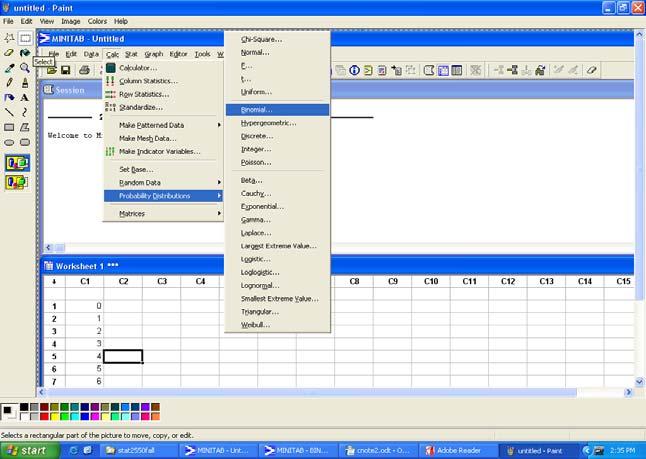
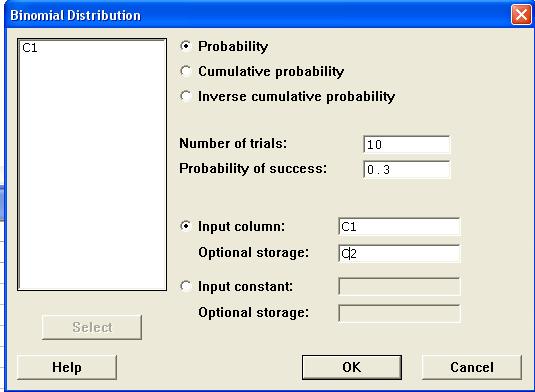
10 FINDING PROBABILITIES (BINOMIAL DISTRIBUTION) Suppose x is a binomial random variable. Use MINITABto find the following probabilities: (a) P(x = 4) for n = 10, p = 0.3 (b) P(x >= 6) for n = 10, p = 0.3 (c) P(1 < x < 9) for n = 15, p = 0.4 (d) P(x > 5) for n = 15, p = 0.4 (e) P(x<4) for n=15, p=0.4 (f) For n = 10, p = 0.3, obtain the plot of the binomial distribution. Steps: 1. Go to Menu "Calc" > "Probability distribution" > "Binomial" 2. Select: Probability, No. of trials, Probability of success and "Input constant" 1. Click "OK" Solution Figure: Calculation of 3 (a) Find P(x=4) for n=10, p=0.3 P(X = 3) = b) Find P(x>=6) for n=10, p=0.3 P(X >= 6) = P(X = 6) P(X = 10) = 1- P(X = 0) + P(X = 1) P(X = 5) = 1- (
11 ) = = c) Find P(1<X<9) for n=15, and p=0.4 P(1<X<9)= P(2<=X<= 8) = P(X=2) P(X=8) = = d) Find P(x>5) for n=15, p=0.4 P(X>5) = 1- P(X<=5) = 1- P(X=0)-...- P(X=5) = = e) Find P(x<4) for n=15, p=0.4 P(X <4) = P(X=0) + P(X=1)+ P(X=2)+P(X=3) = Alternative way : Using Cumulative Probability Steps: 1. Go to Menu "Calc" > "Probability distribution" > "Binomial" 2. Select: Cumulative Probability, No. of trials, Probability of success and "Input constant" 3. Click "OK" b) P(x>=6) = 1- P(x <= 5) For this problem, 1. Go to Menu "Calc" > Prob. dist > Binomial 2. Select Cumulative Probability, type 15 in 'No. of trials' and 0.4 in 'prob. of success' 3. Type 5 in 'Input Constant' and click OK. Output 11
 0 -- 1 --.... 10 -- Steps: 1.")
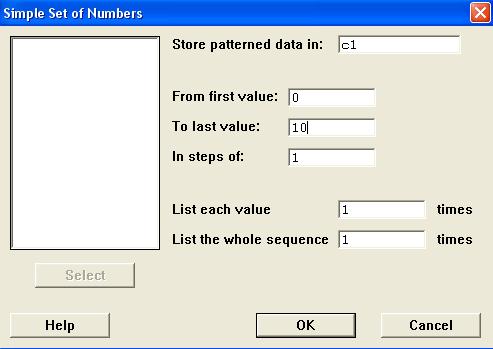
12 Cumulative Distribution Function Binomial with n = 10 and p = 0.3 x P( X <= x ) Thus, P(x >= 6 ) = = (f) Plot of binomial distribution when n=10 and p=0.3 Recall when n=10, the binomial r.v. can take the values as x=0, 1,..., 10. Therefore, we need to compute a table first like this x p(x=x) Steps: 1. go to calculator>make patterned data>simple set of numbers 2. Do the followings: 12
13 3. 13


14 then go to graph> bar chart and do this The binomial graph is then have the shape: 0.30 Chart of C2 vs C C C

, when Mean = 0 and Variance = 1 Output Cumulative Distribution Function Normal with mean = 0 and standard deviation = 1.00000 x P( X <= x ) 0.")
15 Finding Probabilities for Normal Distribution Steps: Go to Calc Probability Dist Normal Select Cumulative probability, Mean St. Deviation Select input constant If you type 0.3 in Input Constant, you will have the probability that X lies between (-, 0.3) Figure: Calculation of P(x 0.3), when Mean = 0 and Variance = 1 Output Cumulative Distribution Function Normal with mean = 0 and standard deviation = x P( X <= x ) Problem 1: The random variable X has a normal distribution with μ=70 and σ=10. Find the following probabilities: a) P(X<75) b) P(X 90) c) P(60 X 75) 15
 P(X 48) b) P(50 X 65) c) P(X 70) Hints: For normal approximation: P(X 48) = P(X 48.")
 (approx) Then obtain those probabilities from normal distribution using μ = np, σ = npq.")
16 Problem 2: Assume that X is a binomial random variable with n=100 and p=0.5. Calculate the exact binomial probability and the approximation obtained by using the normal distribution for a) P(X 48) b) P(50 X 65) c) P(X 70) Hints: For normal approximation: P(X 48) = P(X 48.5)(approx) P(50 X 65)= P(X 65) P(X 49) = P(X 65.5) P(X 49.5) (approx) P(X 70) = 1-P(X<70) = 1-P(X 69) = 1- P(X 69.5) (approx) Then obtain those probabilities from normal distribution using μ = np, σ = npq. Generating Random Samples from Normal Population Steps: Go to Calc Random Data Normal Select Number of random sample, where to store the data (size of random sample, eg. c1-c5 means size 5), Mean and Standard Deviation Click OK The above figure describes drawing 100 random samples (written in Generate rows of data) of size 2 (C1 and C2) from a Normal distribution with Mean 100, Standard Deviation

")
 or Z = x μ0 s / n (σ unknown) Calculation in")
17 Large Sample Test and Confidence Interval (CI) for Mean Suppose you have a sample of 225 observations of which the known variance is 16 and you want to test: H 0 : μ = 8 vs H 1 : μ 8 Also you want find 90% CI for μ CI: σ ± Z α / (σ known) or n x 2 s ± Zα / (σ unknown) n x 2 Test Statistic: Z = x μ0 σ/ n (σ known) or Z = x μ0 s / n (σ unknown) Calculation in Mintitab 17
 13.37 0.")
 pˆ ± Z0.")
18 The data is located in 1 st Column (C1) OUTPUT Test of mu = 8 vs mu not = 8 The assumed sigma = 4 Variable N Mean StDev SE Mean C Variable 90.0% CI Z P C1 ( , ) Large Sample Test and Confidence Interval for Proportion Confidence Interval Confidence Interval Example: 7.4 (Page: 310, Ninth Edition) pˆ ± Z0. 05 pˆqˆ n n = Number of trials: 484, x = number of successes: 257 Calculation in Mintitab 18
19 Small Sample (n<30) Test and Confidence Interval (CI) for Mean Formula: 100(1-α)% CI for mean s CI: x ± t α / 2 where t α / 2 is based on (n-1) degrees of freedom (df). n Test Statistic: For testing, H 0 : μ = μ0 vs H 1 : μ μ0 x μ0 t =, where t has student s t-distribution with (n-1) df. s / n Example Given a sample 14, 9, 12, 14, 10, 9, 10, 12, 11, 9, 6, 2, 14, 10, 11, 12, 9, 6, 4, 8 Test a) H 0 : = 10 μ vs H 1 : μ 10 H 0 : μ = vs H 1 : μ> 10 H 0 : μ = vs H 1 : μ< 10 b) 10 c) 10 at 5% level of significance, 10% level of significance Find 95% confidence interval for μ Solution: Note that, here the sample size n = 20 (<30), i.e. we have a small sample and also population standard deviation σ is unknown. So we have to use t-distribution to perform the test and to find the confidence interval after estimating σ by the sample standard deviation S. 19
 -0.49 0.")
 is the value of the corresponding test statistics and P is the p-value which is 0.632.")
20 Calculation in Mintitab One-Sample T: OUTPUT Test of mu = 10 vs not = 10 Variable N Mean StDev SE Mean 95% CI T P ex ( , ) In the output T (= -0.49) is the value of the corresponding test statistics and P is the p-value which is If the p-value is less than or equal to your level (α ), you can reject H 0. 20


21 Proportion Test for large sample Test H 0 : p = 0.5 vs H 1 : p < 0.5 pˆ p0 Test Statistic: Z = p0q0, pˆ = 10/ 300, p 0 = 0. 5, q 0 = 1-p 0, n = 300 n α = 0.01 (1%) Using Minitab OUTPUT: Test of p = 0.05 vs p < 0.05 Sample X N Sample p 99.0% Upper Bound Z-Value P-Value Acknowledgments: This work was mostly done by Taslim S. mallick, Dept. of Mathematics & Statistics, Memorial University of Newfoundland. 21
Sampling Distributions
 Section 8.1 119 Sampling Distributions Section 8.1 C H A P T E R 8 4Example 2 (pg. 378) Sampling Distribution of the Sample Mean The heights of 3-year-old girls are normally distributed with μ=38.72 and
Discrete Probability Distributions
 90 Discrete Probability Distributions Discrete Probability Distributions C H A P T E R 6 Section 6.2 4Example 2 (pg. 00) Constructing a Binomial Probability Distribution In this example, 6% of the human
Session Window. Variable Name Row. Worksheet Window. Double click on MINITAB icon. You will see a split screen: Getting Started with MINITAB
 STARTING MINITAB: Double click on MINITAB icon. You will see a split screen: Session Window Worksheet Window Variable Name Row ACTIVE WINDOW = BLUE INACTIVE WINDOW = GRAY f(x) F(x) Getting Started with
Week 7. Texas A& M University. Department of Mathematics Texas A& M University, College Station Section 3.2, 3.3 and 3.4
 Week 7 Oğuz Gezmiş Texas A& M University Department of Mathematics Texas A& M University, College Station Section 3.2, 3.3 and 3.4 Oğuz Gezmiş (TAMU) Topics in Contemporary Mathematics II Week7 1 / 19
MATH 104 CHAPTER 5 page 1 NORMAL DISTRIBUTION
 MATH 104 CHAPTER 5 page 1 NORMAL DISTRIBUTION We have examined discrete random variables, those random variables for which we can list the possible values. We will now look at continuous random variables.
MAS187/AEF258. University of Newcastle upon Tyne
 MAS187/AEF258 University of Newcastle upon Tyne 2005-6 Contents 1 Collecting and Presenting Data 5 1.1 Introduction...................................... 5 1.1.1 Examples...................................
Lean Six Sigma: Training/Certification Books and Resources
 Lean Si Sigma Training/Certification Books and Resources Samples from MINITAB BOOK Quality and Si Sigma Tools using MINITAB Statistical Software A complete Guide to Si Sigma DMAIC Tools using MINITAB Prof.
Lab#3 Probability
 36-220 Lab#3 Probability Week of September 19, 2005 Please write your name below, tear off this front page and give it to a teaching assistant as you leave the lab. It will be a record of your participation
No, because np = 100(0.02) = 2. The value of np must be greater than or equal to 5 to use the normal approximation.
 = 2. The value of np must be greater than or equal to 5 to use the normal approximation.") 1) If n 100 and p 0.02 in a binomial experiment, does this satisfy the rule for a normal approximation? Why or why not? No, because np 100(0.02) 2. The value of np must be greater than or equal to 5 to
1) If n 100 and p 0.02 in a binomial experiment, does this satisfy the rule for a normal approximation? Why or why not? No, because np 100(0.02) 2. The value of np must be greater than or equal to 5 to
CHAPTER 7 INTRODUCTION TO SAMPLING DISTRIBUTIONS
 CHAPTER 7 INTRODUCTION TO SAMPLING DISTRIBUTIONS Note: This section uses session window commands instead of menu choices CENTRAL LIMIT THEOREM (SECTION 7.2 OF UNDERSTANDABLE STATISTICS) The Central Limit
Discrete Random Variables and Their Probability Distributions
 58 Chapter 5 Discrete Random Variables and Their Probability Distributions Discrete Random Variables and Their Probability Distributions Chapter 5 Section 5.6 Example 5-18, pg. 213 Calculating a Binomial
Statistics (This summary is for chapters 18, 29 and section H of chapter 19)
") Statistics (This summary is for chapters 18, 29 and section H of chapter 19) Mean, Median, Mode Mode: most common value Median: middle value (when the values are in order) Mean = total how many = x n =
Statistics (This summary is for chapters 18, 29 and section H of chapter 19) Mean, Median, Mode Mode: most common value Median: middle value (when the values are in order) Mean = total how many = x n =
The Normal Probability Distribution
 1 The Normal Probability Distribution Key Definitions Probability Density Function: An equation used to compute probabilities for continuous random variables where the output value is greater than zero
Statistics TI-83 Usage Handout
 Statistics TI-83 Usage Handout This handout includes instructions for performing several different functions on a TI-83 calculator for use in Statistics. The Contents table below lists the topics covered
Discrete Random Variables
 Discrete Random Variables In this chapter, we introduce a new concept that of a random variable or RV. A random variable is a model to help us describe the state of the world around us. Roughly, a RV can
Learning Objectives for Ch. 7
 Chapter 7: Point and Interval Estimation Hildebrand, Ott and Gray Basic Statistical Ideas for Managers Second Edition 1 Learning Objectives for Ch. 7 Obtaining a point estimate of a population parameter
A random variable (r. v.) is a variable whose value is a numerical outcome of a random phenomenon.
 is a variable whose value is a numerical outcome of a random phenomenon.") Chapter 14: random variables p394 A random variable (r. v.) is a variable whose value is a numerical outcome of a random phenomenon. Consider the experiment of tossing a coin. Define a random variable
Chapter 14: random variables p394 A random variable (r. v.) is a variable whose value is a numerical outcome of a random phenomenon. Consider the experiment of tossing a coin. Define a random variable
2011 Pearson Education, Inc
 Statistics for Business and Economics Chapter 4 Random Variables & Probability Distributions Content 1. Two Types of Random Variables 2. Probability Distributions for Discrete Random Variables 3. The Binomial
The instructions on this page also work for the TI-83 Plus and the TI-83 Plus Silver Edition.
 The instructions on this page also work for the TI-83 Plus and the TI-83 Plus Silver Edition. The position of the graphically represented keys can be found by moving your mouse on top of the graphic. Turn
Monte Carlo Simulation (General Simulation Models)
") Monte Carlo Simulation (General Simulation Models) Revised: 10/11/2017 Summary... 1 Example #1... 1 Example #2... 10 Summary Monte Carlo simulation is used to estimate the distribution of variables when
Monte Carlo Simulation (General Simulation Models) Revised: 10/11/2017 Summary... 1 Example #1... 1 Example #2... 10 Summary Monte Carlo simulation is used to estimate the distribution of variables when
LAB 2 INSTRUCTIONS PROBABILITY DISTRIBUTIONS IN EXCEL
 LAB 2 INSTRUCTIONS PROBABILITY DISTRIBUTIONS IN EXCEL There is a wide range of probability distributions (both discrete and continuous) available in Excel. They can be accessed through the Insert Function
6.3: The Binomial Model
 6.3: The Binomial Model The Normal distribution is a good model for many situations involving a continuous random variable. For experiments involving a discrete random variable, where the outcome of the
ECON 214 Elements of Statistics for Economists
 ECON 214 Elements of Statistics for Economists Session 7 The Normal Distribution Part 1 Lecturer: Dr. Bernardin Senadza, Dept. of Economics Contact Information: bsenadza@ug.edu.gh College of Education
ECON 214 Elements of Statistics for Economists 2016/2017
 ECON 214 Elements of Statistics for Economists 2016/2017 Topic The Normal Distribution Lecturer: Dr. Bernardin Senadza, Dept. of Economics bsenadza@ug.edu.gh College of Education School of Continuing and
. 13. The maximum error (margin of error) of the estimate for μ (based on known σ) is:
 of the estimate for μ (based on known σ) is:") Statistics Sample Exam 3 Solution Chapters 6 & 7: Normal Probability Distributions & Estimates 1. What percent of normally distributed data value lie within 2 standard deviations to either side of the
Statistics Sample Exam 3 Solution Chapters 6 & 7: Normal Probability Distributions & Estimates 1. What percent of normally distributed data value lie within 2 standard deviations to either side of the
Statistics (This summary is for chapters 17, 28, 29 and section G of chapter 19)
") Statistics (This summary is for chapters 17, 28, 29 and section G of chapter 19) Mean, Median, Mode Mode: most common value Median: middle value (when the values are in order) Mean = total how many = x
Statistics (This summary is for chapters 17, 28, 29 and section G of chapter 19) Mean, Median, Mode Mode: most common value Median: middle value (when the values are in order) Mean = total how many = x
Section Introduction to Normal Distributions
 Section 6.1-6.2 Introduction to Normal Distributions 2012 Pearson Education, Inc. All rights reserved. 1 of 105 Section 6.1-6.2 Objectives Interpret graphs of normal probability distributions Find areas
7. For the table that follows, answer the following questions: x y 1-1/4 2-1/2 3-3/4 4
 7. For the table that follows, answer the following questions: x y 1-1/4 2-1/2 3-3/4 4 - Would the correlation between x and y in the table above be positive or negative? The correlation is negative. -
CH 5 Normal Probability Distributions Properties of the Normal Distribution
 Properties of the Normal Distribution Example A friend that is always late. Let X represent the amount of minutes that pass from the moment you are suppose to meet your friend until the moment your friend
Statistics 6 th Edition
 Statistics 6 th Edition Chapter 5 Discrete Probability Distributions Chap 5-1 Definitions Random Variables Random Variables Discrete Random Variable Continuous Random Variable Ch. 5 Ch. 6 Chap 5-2 Discrete
5.2 Random Variables, Probability Histograms and Probability Distributions
 Chapter 5 5.2 Random Variables, Probability Histograms and Probability Distributions A random variable (r.v.) can be either continuous or discrete. It takes on the possible values of an experiment. It
Math 2311 Bekki George Office Hours: MW 11am to 12:45pm in 639 PGH Online Thursdays 4-5:30pm And by appointment
 Math 2311 Bekki George bekki@math.uh.edu Office Hours: MW 11am to 12:45pm in 639 PGH Online Thursdays 4-5:30pm And by appointment Class webpage: http://www.math.uh.edu/~bekki/math2311.html Math 2311 Class
Chapter 3: Probability Distributions and Statistics
 Chapter 3: Probability Distributions and Statistics Section 3.-3.3 3. Random Variables and Histograms A is a rule that assigns precisely one real number to each outcome of an experiment. We usually denote
Chapter 8 Statistical Intervals for a Single Sample
 Chapter 8 Statistical Intervals for a Single Sample Part 1: Confidence intervals (CI) for population mean µ Section 8-1: CI for µ when σ 2 known & drawing from normal distribution Section 8-1.2: Sample
Continuous Random Variables and the Normal Distribution
 Chapter 6 Continuous Random Variables and the Normal Distribution Continuous random variables are used to approximate probabilities where there are many possible outcomes or an infinite number of possible
Version A. Problem 1. Let X be the continuous random variable defined by the following pdf: 1 x/2 when 0 x 2, f(x) = 0 otherwise.
 = 0 otherwise.") Math 224 Q Exam 3A Fall 217 Tues Dec 12 Version A Problem 1. Let X be the continuous random variable defined by the following pdf: { 1 x/2 when x 2, f(x) otherwise. (a) Compute the mean µ E[X]. E[X] x
Math 224 Q Exam 3A Fall 217 Tues Dec 12 Version A Problem 1. Let X be the continuous random variable defined by the following pdf: { 1 x/2 when x 2, f(x) otherwise. (a) Compute the mean µ E[X]. E[X] x
Chapter 3 Statistical Quality Control, 7th Edition by Douglas C. Montgomery. Copyright (c) 2013 John Wiley & Sons, Inc.
 2013 John Wiley & Sons, Inc.") 1 3.1 Describing Variation Stem-and-Leaf Display Easy to find percentiles of the data; see page 69 2 Plot of Data in Time Order Marginal plot produced by MINITAB Also called a run chart 3 Histograms Useful
1 3.1 Describing Variation Stem-and-Leaf Display Easy to find percentiles of the data; see page 69 2 Plot of Data in Time Order Marginal plot produced by MINITAB Also called a run chart 3 Histograms Useful
Normal Probability Distributions
 C H A P T E R Normal Probability Distributions 5 Section 5.2 Example 3 (pg. 248) Normal Probabilities Assume triglyceride levels of the population of the United States are normally distributed with a mean
Chapter 8 Estimation
 Chapter 8 Estimation There are two important forms of statistical inference: estimation (Confidence Intervals) Hypothesis Testing Statistical Inference drawing conclusions about populations based on samples
The normal distribution is a theoretical model derived mathematically and not empirically.
 Sociology 541 The Normal Distribution Probability and An Introduction to Inferential Statistics Normal Approximation The normal distribution is a theoretical model derived mathematically and not empirically.
LESSON 7 INTERVAL ESTIMATION SAMIE L.S. LY
 LESSON 7 INTERVAL ESTIMATION SAMIE L.S. LY 1 THIS WEEK S PLAN Part I: Theory + Practice ( Interval Estimation ) Part II: Theory + Practice ( Interval Estimation ) z-based Confidence Intervals for a Population
Descriptive Statistics
 Chapter 3 Descriptive Statistics Chapter 2 presented graphical techniques for organizing and displaying data. Even though such graphical techniques allow the researcher to make some general observations
Homework: Due Wed, Nov 3 rd Chapter 8, # 48a, 55c and 56 (count as 1), 67a
, 67a") Homework: Due Wed, Nov 3 rd Chapter 8, # 48a, 55c and 56 (count as 1), 67a Announcements: There are some office hour changes for Nov 5, 8, 9 on website Week 5 quiz begins after class today and ends at
Homework: Due Wed, Nov 3 rd Chapter 8, # 48a, 55c and 56 (count as 1), 67a Announcements: There are some office hour changes for Nov 5, 8, 9 on website Week 5 quiz begins after class today and ends at
Lecture Slides. Elementary Statistics Tenth Edition. by Mario F. Triola. and the Triola Statistics Series. Slide 1
 Lecture Slides Elementary Statistics Tenth Edition and the Triola Statistics Series by Mario F. Triola Slide 1 Chapter 6 Normal Probability Distributions 6-1 Overview 6-2 The Standard Normal Distribution
Statistics 511 Additional Materials
 Discrete Random Variables In this section, we introduce the concept of a random variable or RV. A random variable is a model to help us describe the state of the world around us. Roughly, a RV can be thought
Confidence Intervals for the Difference Between Two Means with Tolerance Probability
 Chapter 47 Confidence Intervals for the Difference Between Two Means with Tolerance Probability Introduction This procedure calculates the sample size necessary to achieve a specified distance from the
Lecture 12. Some Useful Continuous Distributions. The most important continuous probability distribution in entire field of statistics.
 ENM 207 Lecture 12 Some Useful Continuous Distributions Normal Distribution The most important continuous probability distribution in entire field of statistics. Its graph, called the normal curve, is
Chapter 7. Confidence Intervals and Sample Sizes. Definition. Definition. Definition. Definition. Confidence Interval : CI. Point Estimate.
 Chapter 7 Confidence Intervals and Sample Sizes 7. Estimating a Proportion p 7.3 Estimating a Mean µ (σ known) 7.4 Estimating a Mean µ (σ unknown) 7.5 Estimating a Standard Deviation σ In a recent poll,
Unit 2: Statistics Probability
 Applied Math 30 3-1: Distributions Probability Distribution: - a table or a graph that displays the theoretical probability for each outcome of an experiment. - P (any particular outcome) is between 0
The Normal Approximation to the Binomial
 Lecture 16 The Normal Approximation to the Binomial We can calculate l binomial i probabilities bbilii using The binomial formula The cumulative binomial tables When n is large, and p is not too close
Section 7.5 The Normal Distribution. Section 7.6 Application of the Normal Distribution
 Section 7.6 Application of the Normal Distribution A random variable that may take on infinitely many values is called a continuous random variable. A continuous probability distribution is defined by
Chapter ! Bell Shaped
 Chapter 6 6-1 Business Statistics: A First Course 5 th Edition Chapter 7 Continuous Probability Distributions Learning Objectives In this chapter, you learn:! To compute probabilities from the normal distribution!
One Proportion Superiority by a Margin Tests
 Chapter 512 One Proportion Superiority by a Margin Tests Introduction This procedure computes confidence limits and superiority by a margin hypothesis tests for a single proportion. For example, you might
Two-Sample T-Test for Superiority by a Margin
 Chapter 219 Two-Sample T-Test for Superiority by a Margin Introduction This procedure provides reports for making inference about the superiority of a treatment mean compared to a control mean from data
STAT Chapter 5: Continuous Distributions. Probability distributions are used a bit differently for continuous r.v. s than for discrete r.v. s.
 STAT 515 -- Chapter 5: Continuous Distributions Probability distributions are used a bit differently for continuous r.v. s than for discrete r.v. s. Continuous distributions typically are represented by
Data that can be any numerical value are called continuous. These are usually things that are measured, such as height, length, time, speed, etc.
 Chapter 8 Measures of Center Data that can be any numerical value are called continuous. These are usually things that are measured, such as height, length, time, speed, etc. Data that can only be integer
11.5: Normal Distributions
 11.5: Normal Distributions 11.5.1 Up to now, we ve dealt with discrete random variables, variables that take on only a finite (or countably infinite we didn t do these) number of values. A continuous random
Two-Sample T-Test for Non-Inferiority
 Chapter 198 Two-Sample T-Test for Non-Inferiority Introduction This procedure provides reports for making inference about the non-inferiority of a treatment mean compared to a control mean from data taken
Statistical Intervals. Chapter 7 Stat 4570/5570 Material from Devore s book (Ed 8), and Cengage
, and Cengage") 7 Statistical Intervals Chapter 7 Stat 4570/5570 Material from Devore s book (Ed 8), and Cengage Confidence Intervals The CLT tells us that as the sample size n increases, the sample mean X is close to
7 Statistical Intervals Chapter 7 Stat 4570/5570 Material from Devore s book (Ed 8), and Cengage Confidence Intervals The CLT tells us that as the sample size n increases, the sample mean X is close to
Math 227 Elementary Statistics. Bluman 5 th edition
 Math 227 Elementary Statistics Bluman 5 th edition CHAPTER 6 The Normal Distribution 2 Objectives Identify distributions as symmetrical or skewed. Identify the properties of the normal distribution. Find
The binomial distribution p314
 The binomial distribution p314 Example: A biased coin (P(H) = p = 0.6) ) is tossed 5 times. Let X be the number of H s. Fine P(X = 2). This X is a binomial r. v. The binomial setting p314 1. There are
STATISTICAL DISTRIBUTIONS AND THE CALCULATOR
 STATISTICAL DISTRIBUTIONS AND THE CALCULATOR 1. Basic data sets a. Measures of Center - Mean ( ): average of all values. Characteristic: non-resistant is affected by skew and outliers. - Median: Either
Class 16. Daniel B. Rowe, Ph.D. Department of Mathematics, Statistics, and Computer Science. Marquette University MATH 1700
 Class 16 Daniel B. Rowe, Ph.D. Department of Mathematics, Statistics, and Computer Science Copyright 013 by D.B. Rowe 1 Agenda: Recap Chapter 7. - 7.3 Lecture Chapter 8.1-8. Review Chapter 6. Problem Solving
The Central Limit Theorem. Sec. 8.2: The Random Variable. it s Distribution. it s Distribution
 The Central Limit Theorem Sec. 8.1: The Random Variable it s Distribution Sec. 8.2: The Random Variable it s Distribution X p and and How Should You Think of a Random Variable? Imagine a bag with numbers
MAS187/AEF258. University of Newcastle upon Tyne
 MAS187/AEF258 University of Newcastle upon Tyne 2005-6 Contents 1 Collecting and Presenting Data 5 1.1 Introduction...................................... 5 1.1.1 Examples...................................
Topic 6 - Continuous Distributions I. Discrete RVs. Probability Density. Continuous RVs. Background Reading. Recall the discrete distributions
 Topic 6 - Continuous Distributions I Discrete RVs Recall the discrete distributions STAT 511 Professor Bruce Craig Binomial - X= number of successes (x =, 1,...,n) Geometric - X= number of trials (x =,...)
Confidence Intervals Introduction
 Confidence Intervals Introduction A point estimate provides no information about the precision and reliability of estimation. For example, the sample mean X is a point estimate of the population mean μ
Overview. Definitions. Definitions. Graphs. Chapter 5 Probability Distributions. probability distributions
 Chapter 5 Probability Distributions 5-1 Overview 5-2 Random Variables 5-3 Binomial Probability Distributions 5-4 Mean, Variance, and Standard Deviation for the Binomial Distribution 5-5 The Poisson Distribution
Determining Sample Size. Slide 1 ˆ ˆ. p q n E = z α / 2. (solve for n by algebra) n = E 2
 n = E 2") Determining Sample Size Slide 1 E = z α / 2 ˆ ˆ p q n (solve for n by algebra) n = ( zα α / 2) 2 p ˆ qˆ E 2 Sample Size for Estimating Proportion p When an estimate of ˆp is known: Slide 2 n = ˆ ˆ ( )
Determining Sample Size Slide 1 E = z α / 2 ˆ ˆ p q n (solve for n by algebra) n = ( zα α / 2) 2 p ˆ qˆ E 2 Sample Size for Estimating Proportion p When an estimate of ˆp is known: Slide 2 n = ˆ ˆ ( )
Chapter 6. The Normal Probability Distributions
 Chapter 6 The Normal Probability Distributions 1 Chapter 6 Overview Introduction 6-1 Normal Probability Distributions 6-2 The Standard Normal Distribution 6-3 Applications of the Normal Distribution 6-5
22.2 Shape, Center, and Spread
 Name Class Date 22.2 Shape, Center, and Spread Essential Question: Which measures of center and spread are appropriate for a normal distribution, and which are appropriate for a skewed distribution? Eplore
Binomial Distribution. Normal Approximation to the Binomial
 Binomial Distribution Normal Approximation to the Binomial /29 Homework Read Sec 6-6. Discussion Question pg 337 Do Ex 6-6 -4 2 /29 Objectives Objective: Use the normal approximation to calculate 3 /29
Categorical. A general name for non-numerical data; the data is separated into categories of some kind.
 Chapter 5 Categorical A general name for non-numerical data; the data is separated into categories of some kind. Nominal data Categorical data with no implied order. Eg. Eye colours, favourite TV show,
Continuous Probability Distributions & Normal Distribution
 Mathematical Methods Units 3/4 Student Learning Plan Continuous Probability Distributions & Normal Distribution 7 lessons Notes: Students need practice in recognising whether a problem involves a discrete
Probability Distribution Unit Review
 Probability Distribution Unit Review Topics: Pascal's Triangle and Binomial Theorem Probability Distributions and Histograms Expected Values, Fair Games of chance Binomial Distributions Hypergeometric
Chapter 7. Sampling Distributions
 Chapter 7 Sampling Distributions Section 7.1 Sampling Distributions and the Central Limit Theorem Sampling Distributions Sampling distribution The probability distribution of a sample statistic. Formed
The "bell-shaped" curve, or normal curve, is a probability distribution that describes many real-life situations.
 6.1 6.2 The Standard Normal Curve The "bell-shaped" curve, or normal curve, is a probability distribution that describes many real-life situations. Basic Properties 1. The total area under the curve is.
The Normal Probability Distribution
 102 The Normal Probability Distribution C H A P T E R 7 Section 7.2 4Example 1 (pg. 71) Finding Area Under a Normal Curve In this exercise, we will calculate the area to the left of 5 inches using a normal
Handout 4 numerical descriptive measures part 2. Example 1. Variance and Standard Deviation for Grouped Data. mf N 535 = = 25
 Handout 4 numerical descriptive measures part Calculating Mean for Grouped Data mf Mean for population data: µ mf Mean for sample data: x n where m is the midpoint and f is the frequency of a class. Example
#MEIConf2018. Before the age of the Calculator
 @MEIConference Before the age of the Calculator Since the age of the Calculator New A Level Specifications To use technology such as calculators and computers effectively Session Aims: To use different
Chapter 6 Confidence Intervals Section 6-1 Confidence Intervals for the Mean (Large Samples) Estimating Population Parameters
 Estimating Population Parameters") Chapter 6 Confidence Intervals Section 6-1 Confidence Intervals for the Mean (Large Samples) Estimating Population Parameters VOCABULARY: Point Estimate a value for a parameter. The most point estimate
Chapter 6 Confidence Intervals Section 6-1 Confidence Intervals for the Mean (Large Samples) Estimating Population Parameters VOCABULARY: Point Estimate a value for a parameter. The most point estimate
SUMMARY STATISTICS EXAMPLES AND ACTIVITIES
 Session 6 SUMMARY STATISTICS EXAMPLES AD ACTIVITIES Example 1.1 Expand the following: 1. X 2. 2 6 5 X 3. X 2 4 3 4 4. X 4 2 Solution 1. 2 3 2 X X X... X 2. 6 4 X X X X 4 5 6 5 3. X 2 X 3 2 X 4 2 X 5 2
Statistics, Measures of Central Tendency I
 Statistics, Measures of Central Tendency I We are considering a random variable X with a probability distribution which has some parameters. We want to get an idea what these parameters are. We perfom
Homework: Due Wed, Feb 20 th. Chapter 8, # 60a + 62a (count together as 1), 74, 82
, 74, 82") Announcements: Week 5 quiz begins at 4pm today and ends at 3pm on Wed If you take more than 20 minutes to complete your quiz, you will only receive partial credit. (It doesn t cut you off.) Today: Sections
Announcements: Week 5 quiz begins at 4pm today and ends at 3pm on Wed If you take more than 20 minutes to complete your quiz, you will only receive partial credit. (It doesn t cut you off.) Today: Sections
Department of Quantitative Methods & Information Systems. Business Statistics. Chapter 6 Normal Probability Distribution QMIS 120. Dr.
 Department of Quantitative Methods & Information Systems Business Statistics Chapter 6 Normal Probability Distribution QMIS 120 Dr. Mohammad Zainal Chapter Goals After completing this chapter, you should
CHAPTER 8. Confidence Interval Estimation Point and Interval Estimates
 CHAPTER 8. Confidence Interval Estimation Point and Interval Estimates A point estimate is a single number, a confidence interval provides additional information about the variability of the estimate Lower
8.1 Binomial Distributions
 8.1 Binomial Distributions The Binomial Setting The 4 Conditions of a Binomial Setting: 1.Each observation falls into 1 of 2 categories ( success or fail ) 2 2.There is a fixed # n of observations. 3.All
Lecture Slides. Elementary Statistics Twelfth Edition. by Mario F. Triola. and the Triola Statistics Series. Section 7.4-1
 Lecture Slides Elementary Statistics Twelfth Edition and the Triola Statistics Series by Mario F. Triola Section 7.4-1 Chapter 7 Estimates and Sample Sizes 7-1 Review and Preview 7- Estimating a Population
Consider the following examples: ex: let X = tossing a coin three times and counting the number of heads
 Overview Both chapters and 6 deal with a similar concept probability distributions. The difference is that chapter concerns itself with discrete probability distribution while chapter 6 covers continuous
Math Tech IIII, Mar 13
 Math Tech IIII, Mar 13 The Binomial Distribution III Book Sections: 4.2 Essential Questions: What do I need to know about the binomial distribution? Standards: DA-5.6 What Makes a Binomial Experiment?
Chapter 7. Sampling Distributions and the Central Limit Theorem
 Chapter 7. Sampling Distributions and the Central Limit Theorem 1 Introduction 2 Sampling Distributions related to the normal distribution 3 The central limit theorem 4 The normal approximation to binomial
The Central Limit Theorem
 Section 6-5 The Central Limit Theorem I. Sampling Distribution of Sample Mean ( ) Eample 1: Population Distribution Table 2 4 6 8 P() 1/4 1/4 1/4 1/4 μ (a) Find the population mean and population standard
A.REPRESENTATION OF DATA
 A.REPRESENTATION OF DATA (a) GRAPHS : PART I Q: Why do we need a graph paper? Ans: You need graph paper to draw: (i) Histogram (ii) Cumulative Frequency Curve (iii) Frequency Polygon (iv) Box-and-Whisker
Chapter 6 Confidence Intervals
 Chapter 6 Confidence Intervals Section 6-1 Confidence Intervals for the Mean (Large Samples) VOCABULARY: Point Estimate A value for a parameter. The most point estimate of the population parameter is the
Two-Sample T-Tests using Effect Size
 Chapter 419 Two-Sample T-Tests using Effect Size Introduction This procedure provides sample size and power calculations for one- or two-sided two-sample t-tests when the effect size is specified rather
Chapter 4 Probability Distributions
 Slide 1 Chapter 4 Probability Distributions Slide 2 4-1 Overview 4-2 Random Variables 4-3 Binomial Probability Distributions 4-4 Mean, Variance, and Standard Deviation for the Binomial Distribution 4-5
Section 8.1 Distributions of Random Variables
 Section 8.1 Distributions of Random Variables Random Variable A random variable is a rule that assigns a number to each outcome of a chance experiment. There are three types of random variables: 1. Finite
Examples of continuous probability distributions: The normal and standard normal
 Examples of continuous probability distributions: The normal and standard normal The Normal Distribution f(x) Changing μ shifts the distribution left or right. Changing σ increases or decreases the spread.
Class 13. Daniel B. Rowe, Ph.D. Department of Mathematics, Statistics, and Computer Science. Marquette University MATH 1700
 Class 13 Daniel B. Rowe, Ph.D. Department of Mathematics, Statistics, and Computer Science Copyright 017 by D.B. Rowe 1 Agenda: Recap Chapter 6.3 6.5 Lecture Chapter 7.1 7. Review Chapter 5 for Eam 3.
A random variable (r. v.) is a variable whose value is a numerical outcome of a random phenomenon.
 is a variable whose value is a numerical outcome of a random phenomenon.") Chapter 14: random variables p394 A random variable (r. v.) is a variable whose value is a numerical outcome of a random phenomenon. Consider the experiment of tossing a coin. Define a random variable
Chapter 14: random variables p394 A random variable (r. v.) is a variable whose value is a numerical outcome of a random phenomenon. Consider the experiment of tossing a coin. Define a random variable