μ: ESTIMATES, CONFIDENCE INTERVALS, AND TESTS Business Statistics
|
|
|
- Egbert Porter
- 5 years ago
- Views:
Transcription
1 μ: ESTIMATES, CONFIDENCE INTERVALS, AND TESTS Business Statistics
2 CONTENTS Estimating parameters The sampling distribution Confidence intervals for μ Hypothesis tests for μ The t-distribution Comparison of z and t Old exam question Further study
3 ESTIMATING PARAMETERS Central task in inferential statistics Estimation estimating a parameter (population value) from a sample Example what proportion of cars in Amsterdam is electric? population value: π sample of size n = 200 cars yields 26 electric cars so, p = = 0.13 this suggests π 0.13
4 ESTIMATING PARAMETERS Terminology Parameter a characteristic descriptive of the population e.g., μ, π, σ (or σ 2 ) Estimator a statistic derived from a sample to infer the value of a population parameter e.g., തX, P, S (or S 2 ) Estimate the value of the estimator in a particular sample e.g., x, ҧ p, s (or s 2 )

5 ESTIMATING PARAMETERS
6 ESTIMATING PARAMETERS Mean Standard deviation Proportion Estimator Estimate Population parameter തX = 1 σ n i=1 n X i x ҧ = 1 σ n i=1 n x i μ S = P = X n 1 σ n n 1 i=1 X i തX 2 s = p = x n 1 σ n n 1 i=1 x i xҧ 2 σ π
7 ESTIMATING PARAMETERS Another example (Amsterdam, 2015): what is the mean price of a glass of beer? population value: μ sample of size n = 64 glasses of beer yields x ҧ = 2.06 this suggests that μ = 2.06 But suppose we had taken a different sample again with sample size n = 64 but now perhaps yielding x ҧ = 2.13 then we would estimate μ = 2.13 Obviously there is sampling variation so a distribution of x-values ҧ (the sampling distribution of തX) Solution: point estimates and confidence intervals

8 THE SAMPLING DISTRIBUTION Example Consider a discrete uniform population consisting of the integers {0, 1, 2, 3} The population parameters are: μ = 1.5 σ = 1.118


9 THE SAMPLING DISTRIBUTION Sample n = 2 values and calculate xҧ Do this for all possible sample of size n = 2 You will get a distribution of x-values: ҧ the distribution തX

10 THE SAMPLING DISTRIBUTION We will study the variance of the estimate of a population parameter from a sample statistic We will do so by studying how the sample statistic varies when you draw a different sample Example: GMAT score of MBA students N = 2637 μ = σ = 86.60
 tend to be close to the population mean (μ = 520.")
11 THE SAMPLING DISTRIBUTION Consider eight random samples, each of size n = 5 the sample means ( xҧ 1 = 504.0, xҧ 2 = 576.0,, xҧ 8 = 582) tend to be close to the population mean (μ = ) sometimes a bit lower, sometimes a bit higher


12 THE SAMPLING DISTRIBUTION The dot plots show that the sample means ( xҧ 1,, xҧ 8 ) have much less variation than the individual data points (x 1,, x 2637 )
13 THE SAMPLING DISTRIBUTION An estimator is a random variable since samples vary so we write it as a capital letter, e.g., X, തX, S, etc. The sampling distribution of an estimator is the probability distribution of all possible values the statistic may assume when a random sample of (a fixed) size n is taken so we write X~N μ, σ, etc.

14 THE SAMPLING DISTRIBUTION The sampling distribution of തX for a population with μ = μ X and σ 2 = σ X 2 If the CLT holds തX~N μ X, σ X 2 So, the statistic തX is normally distributed has mean μ X and has standard deviation σ X n Fortunately, the CLT holds pretty often n 3 things: shape, mean, dispersion
15 THE SAMPLING DISTRIBUTION The standard deviation of the distribution of sample means തX is given by σx ത = σ X n has a special name: standard error of the mean is often abbreviated as the standard error (SE) decreases with increasing sample size but only according to the law of diminishing returns (1/ n) is often calculated by software (SPSS, etc.) is the basis for confidence intervals and hypothesis tests (see later) That s a bit confusing, because we will meet more standard errors later on
16 EXERCISE 1 What is the meaning of the standard error?
17 CONFIDENCE INTERVALS FOR μ A sample mean xҧ is a point estimate of the population mean μ it is the best possible estimate of μ but it will probably not be completely right A confidence interval (CI) for the mean is a range of possible values for μ: μ lower μ μ upper To simplify notation, we will drop the X from μ X now, and write just μ such that the interval CI μ = μ lower, μ upper contains the true value (μ) with a certain probability (e.g., 95%)
18 CONFIDENCE INTERVALS FOR μ From the CLT it follows that under certain conditions: the distribution of തX is normal the best estimate of തX of μ is xҧ the standard deviation of തX is σ n This implies that: with probability 2.5%, തX < μ 1.96 σ n μ > തX σ n with probability 2.5%, തX > μ σ n μ < തX 1.96 σ n so with probability 95%, തX 1.96 σ n μ തX σ n So, if we find a sample mean x, ҧ we can construct the following 95% confidence interval for μ: CI μ,0.95 = xҧ 1.96 σ n, x ҧ σ n
19 CONFIDENCE INTERVALS FOR μ Three notations for a confidence interval for μ xҧ 1.96 σ, x ҧ σ n n xҧ 1.96 σ μ n x ҧ ± 1.96 σ n x ҧ σ n
20 CONFIDENCE INTERVALS FOR μ Example Population μ = (unknown) σ = (known) normally distributed (assumed) Sample n = 5 (chosen) x ҧ = (estimated) Calculation standard error of mean: = = CI μ,0.95 = ,
21 EXERCISE 2 Write the confidence interval , in two alternative ways.

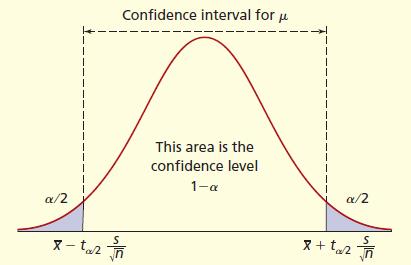
22 CONFIDENCE INTERVALS FOR μ The factor 1.96 is of course related to the 95% probability Other confidence levels: Where z α/2 is such that P Z z α/2 = α if Z is drawn from a Z-distribution General form of a 1 α 100% confidence interval of the mean: CI μ,1 α = xҧ z α/2 σn, x ҧ + z σ α/2 n

23 CONFIDENCE INTERVALS FOR μ

24 CONFIDENCE INTERVALS FOR μ Trade-off narrow CI low confidence level wide CI high confidence level Choice of confidence level depends on application more precision required for a refinery than for a dairy farm
25 CONFIDENCE INTERVALS FOR μ A confidence interval either does or does not contain μ The confidence level quantifies the risk Out of 100 confidence intervals, approximately 95% will contain μ, while approximately 5% might not contain μ
26 HYPOTHESIS TESTS FOR μ We can use the standard error to perform a hypothesis test recall that CI μ,0.95 = , Suppose we hypothesize μ = 550 The value 550 is inside the 95% confidence interval for μ therefore the sample statistic+confidence interval will not suggest that the hypothesis (μ = 550) is wrong and we will not reject the hypothesis notice that we didn t say that μ = 550; we only said that we can t reject it (at a 5% significance level)
27 HYPOTHESIS TESTS FOR μ Another example: suppose we hypothesize that μ = 600 The value 600 is outside the confidence interval for μ finding a confidence interval not containing μ happens only in 5% of the cases so we conclude that μ 600 (at a 5% significance level) therefore the sample statistic+confidence interval will suggest that the hypothesis (μ = 600) is wrong and we will reject the hypothesis Much more on hypothesis tests later on!
28 THE t-distribution A closer look at CI μ,0.95 = xҧ 1.96 σ, x ҧ σ n n Given a sample mean x, ҧ you can find a 95% confidence interval for the population mean μ Sounds great when you don t know μ but it assumes you do know σ! There are many situations in which you don t know μ and you also don t know σ So what to do?
29 THE t-distribution A simple strategy If the population standard deviation σ is unknown, we can estimate it with the sample standard deviation s Then we use ±1.96 s n instead of ±1.96 σ n But we pay a price for that The reason is that s is itself an estimate of σ, and therefore uncertain The price we pay is that the factor 1.96 must be somewhat larger
30 THE t-distribution Recall that the CLT yields that ത X μ σ/ n where Z is the standard normal distribution Likewise, it can be shown that തX μ s/ n ~t ~N 0,1 where t is the t-distribution (or Student s t-distribution) which has an even more complicated formula than the normal distribution f z = 1 2π e 1 2 z2 vs. f t; ν = Γ 1 2 ν+1 νπγ 1 2 ν 1 + t2 ν 1 2 ν+1 Arrrgh: forget quickly!
31 THE t-distribution The confidence interval for μ with unknown σ is CI μ,1 α = xҧ t α/2 sn, x ҧ + t α/2 s n Where t α/2 is such that P T t α/2 = α if T is drawn from a t-distribution What is the t-distribution? quite similar to the Z-distribution (μ = 0, continuous, symmetric, bellshaped, infinite range,...) a little bit fatter tails it has 1 parameter, usually denoted with df or ν, and called degrees of freedom
32 THE t-distribution Graph of pdf of t-distribution Z (standard normal) distribution t-distribution with df = 1000 f x t-distribution with df = 13 t-distribution with df = 5 x
33 THE t-distribution Different notations t 13 t df = 13 etc. And likewise t 13;α/2 t 13 α/2 etc. So altogether for the confidence interval CI μ,1 α = Compare to xҧ z α/2 σn, x ҧ + z α/2 xҧ t n 1;α/2 sn, x ҧ + t n 1;α/2 s n σ n
34 THE t-distribution
35 THE t-distribution How to choose the parameter df? it is a parameter based on the sample size that is used to determine the value of the t-statistic it tells how many observations are used to estimate σ, less the number of intermediate estimates used in the calculation the df for the t-distribution in the case of a confidence interval for μ when σ is unknown, is df = n 1 but in other cases, it may be different Properties of t as n increases, the t-distribution approaches the shape of the normal distribution for a given confidence level α, t is always larger than z, so a confidence interval based on t is always wider than if z were used

36 THE t-distribution Reading the table of critical t-values e.g., t t = α/2 = df = 9
37 THE t-distribution Look carefully at tables for z and t: z usually runs from left to right P X z = f x dx t usually runs from right to left P X t = t f x dx z

38 THE t-distribution Background of t developed by William Gosset in 1908 while working at Guiness Brewery, Dublin published under the pen name Student
 σ = 86.")
 s = 73.01 (estimated) Calculation standard error of mean: s n = 32.65 2.")
39 THE t-distribution Example for confidence interval Population μ = (unknown) σ = (unknown) normally distributed (assumed) Sample n = 5 (chosen) x ҧ = (estimated) s = (estimated) Calculation standard error of mean: s n = = CI μ,0.95 = , now we have a situation in which σ is not known to us df=4
40 THE t-distribution Repeat the hypothesis test for this case now CI μ,0.95 = , So we will reject the hypothesis μ = 600 while we will not reject the hypothesis μ = 550 Exactly the same reasoning as with the z-test, but with (slightly) different numbers
41 COMPARISON OF z AND t When to use which? for a confidence interval for μ if σ 2 is known: use z for a confidence interval for μ if σ 2 is unknown: use t, and estimate σ 2 by s 2 How to find? from a table with z-values: given α, look up z from a table with t-values: given α and df, look up t What is the difference? confidence intervals with t are a bit wider than with z the difference is small for n 30 and negligible for n 100
42 COMPARISON OF z AND t Example: 50 confidence intervals with z and t Samples, sample size n=10 Simulated from: N(2,9) distribution Based on 2 Based on s 2 (i) σ തX ± z α/2 n Sample Number i തX ± t α/2;n 1 S n
43 OLD EXAM QUESTION 23 March 2015, Q1l
44 FURTHER STUDY Doane & Seward 5/E , 10.4 Tutorial exercises week 2 point estimate confidence interval, z test for mean t test for mean z versus t
σ 2 : ESTIMATES, CONFIDENCE INTERVALS, AND TESTS Business Statistics
 σ : ESTIMATES, CONFIDENCE INTERVALS, AND TESTS Business Statistics CONTENTS Estimating other parameters besides μ Estimating variance Confidence intervals for σ Hypothesis tests for σ Estimating standard
TWO μs OR MEDIANS: COMPARISONS. Business Statistics
 TWO μs OR MEDIANS: COMPARISONS Business Statistics CONTENTS Comparing two samples Comparing two unrelated samples Comparing the means of two unrelated samples Comparing the medians of two unrelated samples
Chapter 6.1 Confidence Intervals. Stat 226 Introduction to Business Statistics I. Chapter 6, Section 6.1
 Stat 226 Introduction to Business Statistics I Spring 2009 Professor: Dr. Petrutza Caragea Section A Tuesdays and Thursdays 9:30-10:50 a.m. Chapter 6, Section 6.1 Confidence Intervals Confidence Intervals
Interval estimation. September 29, Outline Basic ideas Sampling variation and CLT Interval estimation using X More general problems
 Interval estimation September 29, 2017 STAT 151 Class 7 Slide 1 Outline of Topics 1 Basic ideas 2 Sampling variation and CLT 3 Interval estimation using X 4 More general problems STAT 151 Class 7 Slide
Lecture 2 INTERVAL ESTIMATION II
 Lecture 2 INTERVAL ESTIMATION II Recap Population of interest - want to say something about the population mean µ perhaps Take a random sample... Recap When our random sample follows a normal distribution,
Chapter 8 Statistical Intervals for a Single Sample
 Chapter 8 Statistical Intervals for a Single Sample Part 1: Confidence intervals (CI) for population mean µ Section 8-1: CI for µ when σ 2 known & drawing from normal distribution Section 8-1.2: Sample
Data Analysis and Statistical Methods Statistics 651
 Data Analysis and Statistical Methods Statistics 651 http://www.stat.tamu.edu/~suhasini/teaching.html Lecture 14 (MWF) The t-distribution Suhasini Subba Rao Review of previous lecture Often the precision
CHAPTER 8. Confidence Interval Estimation Point and Interval Estimates
 CHAPTER 8. Confidence Interval Estimation Point and Interval Estimates A point estimate is a single number, a confidence interval provides additional information about the variability of the estimate Lower
Hypothesis Tests: One Sample Mean Cal State Northridge Ψ320 Andrew Ainsworth PhD
 Hypothesis Tests: One Sample Mean Cal State Northridge Ψ320 Andrew Ainsworth PhD MAJOR POINTS Sampling distribution of the mean revisited Testing hypotheses: sigma known An example Testing hypotheses:
Distribution. Lecture 34 Section Fri, Oct 31, Hampden-Sydney College. Student s t Distribution. Robb T. Koether.
 Lecture 34 Section 10.2 Hampden-Sydney College Fri, Oct 31, 2008 Outline 1 2 3 4 5 6 7 8 Exercise 10.4, page 633. A psychologist is studying the distribution of IQ scores of girls at an alternative high
Statistical Intervals (One sample) (Chs )
 (Chs )") 7 Statistical Intervals (One sample) (Chs 8.1-8.3) Confidence Intervals The CLT tells us that as the sample size n increases, the sample mean X is close to normally distributed with expected value µ and
7 Statistical Intervals (One sample) (Chs 8.1-8.3) Confidence Intervals The CLT tells us that as the sample size n increases, the sample mean X is close to normally distributed with expected value µ and
Confidence Intervals. σ unknown, small samples The t-statistic /22
 Confidence Intervals σ unknown, small samples The t-statistic 1 /22 Homework Read Sec 7-3. Discussion Question pg 365 Do Ex 7-3 1-4, 6, 9, 12, 14, 15, 17 2/22 Objective find the confidence interval for
Confidence Intervals Introduction
 Confidence Intervals Introduction A point estimate provides no information about the precision and reliability of estimation. For example, the sample mean X is a point estimate of the population mean μ
Chapter 7 Sampling Distributions and Point Estimation of Parameters
 Chapter 7 Sampling Distributions and Point Estimation of Parameters Part 1: Sampling Distributions, the Central Limit Theorem, Point Estimation & Estimators Sections 7-1 to 7-2 1 / 25 Statistical Inferences
χ 2 distributions and confidence intervals for population variance
 χ 2 distributions and confidence intervals for population variance Let Z be a standard Normal random variable, i.e., Z N(0, 1). Define Y = Z 2. Y is a non-negative random variable. Its distribution is
Data Analysis and Statistical Methods Statistics 651
 Data Analysis and Statistical Methods Statistics 651 http://www.stat.tamu.edu/~suhasini/teaching.html Lecture 14 (MWF) The t-distribution Suhasini Subba Rao Review of previous lecture Often the precision
8.1 Estimation of the Mean and Proportion
 8.1 Estimation of the Mean and Proportion Statistical inference enables us to make judgments about a population on the basis of sample information. The mean, standard deviation, and proportions of a population
Determining Sample Size. Slide 1 ˆ ˆ. p q n E = z α / 2. (solve for n by algebra) n = E 2
 n = E 2") Determining Sample Size Slide 1 E = z α / 2 ˆ ˆ p q n (solve for n by algebra) n = ( zα α / 2) 2 p ˆ qˆ E 2 Sample Size for Estimating Proportion p When an estimate of ˆp is known: Slide 2 n = ˆ ˆ ( )
Determining Sample Size Slide 1 E = z α / 2 ˆ ˆ p q n (solve for n by algebra) n = ( zα α / 2) 2 p ˆ qˆ E 2 Sample Size for Estimating Proportion p When an estimate of ˆp is known: Slide 2 n = ˆ ˆ ( )
STAT Chapter 7: Confidence Intervals
 STAT 515 -- Chapter 7: Confidence Intervals With a point estimate, we used a single number to estimate a parameter. We can also use a set of numbers to serve as reasonable estimates for the parameter.
Key Objectives. Module 2: The Logic of Statistical Inference. Z-scores. SGSB Workshop: Using Statistical Data to Make Decisions
 SGSB Workshop: Using Statistical Data to Make Decisions Module 2: The Logic of Statistical Inference Dr. Tom Ilvento January 2006 Dr. Mugdim Pašić Key Objectives Understand the logic of statistical inference
1 Inferential Statistic
 1 Inferential Statistic Population versus Sample, parameter versus statistic A population is the set of all individuals the researcher intends to learn about. A sample is a subset of the population and
Chapter 7 presents the beginning of inferential statistics. The two major activities of inferential statistics are
 Chapter 7 presents the beginning of inferential statistics. Concept: Inferential Statistics The two major activities of inferential statistics are 1 to use sample data to estimate values of population
Lecture 16: Estimating Parameters (Confidence Interval Estimates of the Mean)
") Statistics 16_est_parameters.pdf Michael Hallstone, Ph.D. hallston@hawaii.edu Lecture 16: Estimating Parameters (Confidence Interval Estimates of the Mean) Some Common Sense Assumptions for Interval Estimates
Statistics 16_est_parameters.pdf Michael Hallstone, Ph.D. hallston@hawaii.edu Lecture 16: Estimating Parameters (Confidence Interval Estimates of the Mean) Some Common Sense Assumptions for Interval Estimates
Probability. An intro for calculus students P= Figure 1: A normal integral
 Probability An intro for calculus students.8.6.4.2 P=.87 2 3 4 Figure : A normal integral Suppose we flip a coin 2 times; what is the probability that we get more than 2 heads? Suppose we roll a six-sided
T.I.H.E. IT 233 Statistics and Probability: Sem. 1: 2013 ESTIMATION
 In Inferential Statistic, ESTIMATION (i) (ii) is called the True Population Mean and is called the True Population Proportion. You must also remember that are not the only population parameters. There
Chapter 14 : Statistical Inference 1. Note : Here the 4-th and 5-th editions of the text have different chapters, but the material is the same.
 Chapter 14 : Statistical Inference 1 Chapter 14 : Introduction to Statistical Inference Note : Here the 4-th and 5-th editions of the text have different chapters, but the material is the same. Data x
Statistics vs. statistics
 Statistics vs. statistics Question: What is Statistics (with a capital S)? Definition: Statistics is the science of collecting, organizing, summarizing and interpreting data. Note: There are 2 main ways
Lecture 6: Confidence Intervals
 Lecture 6: Confidence Intervals Taeyong Park Washington University in St. Louis February 22, 2017 Park (Wash U.) U25 PS323 Intro to Quantitative Methods February 22, 2017 1 / 29 Today... Review of sampling
Chapter 11: Inference for Distributions Inference for Means of a Population 11.2 Comparing Two Means
 Chapter 11: Inference for Distributions 11.1 Inference for Means of a Population 11.2 Comparing Two Means 1 Population Standard Deviation In the previous chapter, we computed confidence intervals and performed
Chapter 9: Sampling Distributions
 Chapter 9: Sampling Distributions 9. Introduction This chapter connects the material in Chapters 4 through 8 (numerical descriptive statistics, sampling, and probability distributions, in particular) with
Chapter 7. Inferences about Population Variances
 Chapter 7. Inferences about Population Variances Introduction () The variability of a population s values is as important as the population mean. Hypothetical distribution of E. coli concentrations from
STAT Chapter 5: Continuous Distributions. Probability distributions are used a bit differently for continuous r.v. s than for discrete r.v. s.
 STAT 515 -- Chapter 5: Continuous Distributions Probability distributions are used a bit differently for continuous r.v. s than for discrete r.v. s. Continuous distributions typically are represented by
Statistical Intervals. Chapter 7 Stat 4570/5570 Material from Devore s book (Ed 8), and Cengage
, and Cengage") 7 Statistical Intervals Chapter 7 Stat 4570/5570 Material from Devore s book (Ed 8), and Cengage Confidence Intervals The CLT tells us that as the sample size n increases, the sample mean X is close to
7 Statistical Intervals Chapter 7 Stat 4570/5570 Material from Devore s book (Ed 8), and Cengage Confidence Intervals The CLT tells us that as the sample size n increases, the sample mean X is close to
Statistics for Managers Using Microsoft Excel 7 th Edition
 Statistics for Managers Using Microsoft Excel 7 th Edition Chapter 7 Sampling Distributions Statistics for Managers Using Microsoft Excel 7e Copyright 2014 Pearson Education, Inc. Chap 7-1 Learning Objectives
Chapter 8 Estimation
 Chapter 8 Estimation There are two important forms of statistical inference: estimation (Confidence Intervals) Hypothesis Testing Statistical Inference drawing conclusions about populations based on samples
Week 2 Quantitative Analysis of Financial Markets Hypothesis Testing and Confidence Intervals
 Week 2 Quantitative Analysis of Financial Markets Hypothesis Testing and Confidence Intervals Christopher Ting http://www.mysmu.edu/faculty/christophert/ Christopher Ting : christopherting@smu.edu.sg :
The Two-Sample Independent Sample t Test
 Department of Psychology and Human Development Vanderbilt University 1 Introduction 2 3 The General Formula The Equal-n Formula 4 5 6 Independence Normality Homogeneity of Variances 7 Non-Normality Unequal
Statistics for Business and Economics
 Statistics for Business and Economics Chapter 7 Estimation: Single Population Copyright 010 Pearson Education, Inc. Publishing as Prentice Hall Ch. 7-1 Confidence Intervals Contents of this chapter: Confidence
Review: Population, sample, and sampling distributions
 Review: Population, sample, and sampling distributions A population with mean µ and standard deviation σ For instance, µ = 0, σ = 1 0 1 Sample 1, N=30 Sample 2, N=30 Sample 100000000000 InterquartileRange
Using the Central Limit Theorem It is important for you to understand when to use the CLT. If you are being asked to find the probability of the
 Using the Central Limit Theorem It is important for you to understand when to use the CLT. If you are being asked to find the probability of the mean, use the CLT for the mean. If you are being asked to
STAT Chapter 6: Sampling Distributions
 STAT 515 -- Chapter 6: Sampling Distributions Definition: Parameter = a number that characterizes a population (example: population mean ) it s typically unknown. Statistic = a number that characterizes
The topics in this section are related and necessary topics for both course objectives.
 2.5 Probability Distributions The topics in this section are related and necessary topics for both course objectives. A probability distribution indicates how the probabilities are distributed for outcomes
Version A. Problem 1. Let X be the continuous random variable defined by the following pdf: 1 x/2 when 0 x 2, f(x) = 0 otherwise.
 = 0 otherwise.") Math 224 Q Exam 3A Fall 217 Tues Dec 12 Version A Problem 1. Let X be the continuous random variable defined by the following pdf: { 1 x/2 when x 2, f(x) otherwise. (a) Compute the mean µ E[X]. E[X] x
Math 224 Q Exam 3A Fall 217 Tues Dec 12 Version A Problem 1. Let X be the continuous random variable defined by the following pdf: { 1 x/2 when x 2, f(x) otherwise. (a) Compute the mean µ E[X]. E[X] x
Chapter 7. Confidence Intervals and Sample Sizes. Definition. Definition. Definition. Definition. Confidence Interval : CI. Point Estimate.
 Chapter 7 Confidence Intervals and Sample Sizes 7. Estimating a Proportion p 7.3 Estimating a Mean µ (σ known) 7.4 Estimating a Mean µ (σ unknown) 7.5 Estimating a Standard Deviation σ In a recent poll,
Lecture 2. Probability Distributions Theophanis Tsandilas
 Lecture 2 Probability Distributions Theophanis Tsandilas Comment on measures of dispersion Why do common measures of dispersion (variance and standard deviation) use sums of squares: nx (x i ˆµ) 2 i=1
The normal distribution is a theoretical model derived mathematically and not empirically.
 Sociology 541 The Normal Distribution Probability and An Introduction to Inferential Statistics Normal Approximation The normal distribution is a theoretical model derived mathematically and not empirically.
As you draw random samples of size n, as n increases, the sample means tend to be normally distributed.
 The Central Limit Theorem The central limit theorem (clt for short) is one of the most powerful and useful ideas in all of statistics. The clt says that if we collect samples of size n with a "large enough
. 13. The maximum error (margin of error) of the estimate for μ (based on known σ) is:
 of the estimate for μ (based on known σ) is:") Statistics Sample Exam 3 Solution Chapters 6 & 7: Normal Probability Distributions & Estimates 1. What percent of normally distributed data value lie within 2 standard deviations to either side of the
Statistics Sample Exam 3 Solution Chapters 6 & 7: Normal Probability Distributions & Estimates 1. What percent of normally distributed data value lie within 2 standard deviations to either side of the
Statistics Class 15 3/21/2012
 Statistics Class 15 3/21/2012 Quiz 1. Cans of regular Pepsi are labeled to indicate that they contain 12 oz. Data Set 17 in Appendix B lists measured amounts for a sample of Pepsi cans. The same statistics
Chapter 7 Study Guide: The Central Limit Theorem
 Chapter 7 Study Guide: The Central Limit Theorem Introduction Why are we so concerned with means? Two reasons are that they give us a middle ground for comparison and they are easy to calculate. In this
IOP 201-Q (Industrial Psychological Research) Tutorial 5
 Tutorial 5") IOP 201-Q (Industrial Psychological Research) Tutorial 5 TRUE/FALSE [1 point each] Indicate whether the sentence or statement is true or false. 1. To establish a cause-and-effect relation between two variables,
IOP 201-Q (Industrial Psychological Research) Tutorial 5 TRUE/FALSE [1 point each] Indicate whether the sentence or statement is true or false. 1. To establish a cause-and-effect relation between two variables,
Chapter 5. Sampling Distributions
 Lecture notes, Lang Wu, UBC 1 Chapter 5. Sampling Distributions 5.1. Introduction In statistical inference, we attempt to estimate an unknown population characteristic, such as the population mean, µ,
Learning Objectives for Ch. 7
 Chapter 7: Point and Interval Estimation Hildebrand, Ott and Gray Basic Statistical Ideas for Managers Second Edition 1 Learning Objectives for Ch. 7 Obtaining a point estimate of a population parameter
One sample z-test and t-test
 One sample z-test and t-test January 30, 2017 psych10.stanford.edu Announcements / Action Items Install ISI package (instructions in Getting Started with R) Assessment Problem Set #3 due Tu 1/31 at 7 PM
Chapter 4: Estimation
 Slide 4.1 Chapter 4: Estimation Estimation is the process of using sample data to draw inferences about the population Sample information x, s Inferences Population parameters µ,σ Slide 4. Point and interval
Chapter 7: SAMPLING DISTRIBUTIONS & POINT ESTIMATION OF PARAMETERS
 Chapter 7: SAMPLING DISTRIBUTIONS & POINT ESTIMATION OF PARAMETERS Part 1: Introduction Sampling Distributions & the Central Limit Theorem Point Estimation & Estimators Sections 7-1 to 7-2 Sample data
19. CONFIDENCE INTERVALS FOR THE MEAN; KNOWN VARIANCE
 19. CONFIDENCE INTERVALS FOR THE MEAN; KNOWN VARIANCE We assume here that the population variance σ 2 is known. This is an unrealistic assumption, but it allows us to give a simplified presentation which
Unit 5: Sampling Distributions of Statistics
 Unit 5: Sampling Distributions of Statistics Statistics 571: Statistical Methods Ramón V. León 6/12/2004 Unit 5 - Stat 571 - Ramon V. Leon 1 Definitions and Key Concepts A sample statistic used to estimate
Unit 5: Sampling Distributions of Statistics
 Unit 5: Sampling Distributions of Statistics Statistics 571: Statistical Methods Ramón V. León 6/12/2004 Unit 5 - Stat 571 - Ramon V. Leon 1 Definitions and Key Concepts A sample statistic used to estimate
CIVL Confidence Intervals
 CIVL 3103 Confidence Intervals Learning Objectives - Confidence Intervals Define confidence intervals, and explain their significance to point estimates. Identify and apply the appropriate confidence interval
Statistics 431 Spring 2007 P. Shaman. Preliminaries
 Statistics 4 Spring 007 P. Shaman The Binomial Distribution Preliminaries A binomial experiment is defined by the following conditions: A sequence of n trials is conducted, with each trial having two possible
Homework: (Due Wed) Chapter 10: #5, 22, 42
 Chapter 10: #5, 22, 42") Announcements: Discussion today is review for midterm, no credit. You may attend more than one discussion section. Bring 2 sheets of notes and calculator to midterm. We will provide Scantron form. Homework:
Announcements: Discussion today is review for midterm, no credit. You may attend more than one discussion section. Bring 2 sheets of notes and calculator to midterm. We will provide Scantron form. Homework:
Statistics for Business and Economics: Random Variables:Continuous
 Statistics for Business and Economics: Random Variables:Continuous STT 315: Section 107 Acknowledgement: I d like to thank Dr. Ashoke Sinha for allowing me to use and edit the slides. Murray Bourne (interactive
5.3 Statistics and Their Distributions
 Chapter 5 Joint Probability Distributions and Random Samples Instructor: Lingsong Zhang 1 Statistics and Their Distributions 5.3 Statistics and Their Distributions Statistics and Their Distributions Consider
Chapter 4 Continuous Random Variables and Probability Distributions
 Chapter 4 Continuous Random Variables and Probability Distributions Part 2: More on Continuous Random Variables Section 4.5 Continuous Uniform Distribution Section 4.6 Normal Distribution 1 / 27 Continuous
Experimental Design and Statistics - AGA47A
 Experimental Design and Statistics - AGA47A Czech University of Life Sciences in Prague Department of Genetics and Breeding Fall/Winter 2014/2015 Matúš Maciak (@ A 211) Office Hours: M 14:00 15:30 W 15:30
Elementary Statistics
 Chapter 7 Estimation Goal: To become familiar with how to use Excel 2010 for Estimation of Means. There is one Stat Tool in Excel that is used with estimation of means, T.INV.2T. Open Excel and click on
Exam 2 Spring 2015 Statistics for Applications 4/9/2015
 18.443 Exam 2 Spring 2015 Statistics for Applications 4/9/2015 1. True or False (and state why). (a). The significance level of a statistical test is not equal to the probability that the null hypothesis
Simple Random Sampling. Sampling Distribution
 STAT 503 Sampling Distribution and Statistical Estimation 1 Simple Random Sampling Simple random sampling selects with equal chance from (available) members of population. The resulting sample is a simple
Point Estimation. Stat 4570/5570 Material from Devore s book (Ed 8), and Cengage
, and Cengage") 6 Point Estimation Stat 4570/5570 Material from Devore s book (Ed 8), and Cengage Point Estimation Statistical inference: directed toward conclusions about one or more parameters. We will use the generic
6 Point Estimation Stat 4570/5570 Material from Devore s book (Ed 8), and Cengage Point Estimation Statistical inference: directed toward conclusions about one or more parameters. We will use the generic
Dr. Allen Back. Oct. 28, 2016
 Dr. Allen Back Oct. 28, 2016 A coffee vending machine dispenses coffee into a paper cup. You re supposed to get 10 ounces of coffee., but the amount varies slightly from cup to cup. The amounts measured
Descriptive Statistics (Devore Chapter One)
") Descriptive Statistics (Devore Chapter One) 1016-345-01 Probability and Statistics for Engineers Winter 2010-2011 Contents 0 Perspective 1 1 Pictorial and Tabular Descriptions of Data 2 1.1 Stem-and-Leaf
Descriptive Statistics (Devore Chapter One) 1016-345-01 Probability and Statistics for Engineers Winter 2010-2011 Contents 0 Perspective 1 1 Pictorial and Tabular Descriptions of Data 2 1.1 Stem-and-Leaf
6.1, 7.1 Estimating with confidence (CIS: Chapter 10)
") Objectives 6.1, 7.1 Estimating with confidence (CIS: Chapter 10) Statistical confidence (CIS gives a good explanation of a 95% CI) Confidence intervals Choosing the sample size t distributions One-sample
Objectives 6.1, 7.1 Estimating with confidence (CIS: Chapter 10) Statistical confidence (CIS gives a good explanation of a 95% CI) Confidence intervals Choosing the sample size t distributions One-sample
7.1 Comparing Two Population Means: Independent Sampling
 University of California, Davis Department of Statistics Summer Session II Statistics 13 September 4, 01 Lecture 7: Comparing Population Means Date of latest update: August 9 7.1 Comparing Two Population
ECO220Y Estimation: Confidence Interval Estimator for Sample Proportions Readings: Chapter 11 (skip 11.5)
") ECO220Y Estimation: Confidence Interval Estimator for Sample Proportions Readings: Chapter 11 (skip 11.5) Fall 2011 Lecture 10 (Fall 2011) Estimation Lecture 10 1 / 23 Review: Sampling Distributions Sample
ECO220Y Estimation: Confidence Interval Estimator for Sample Proportions Readings: Chapter 11 (skip 11.5) Fall 2011 Lecture 10 (Fall 2011) Estimation Lecture 10 1 / 23 Review: Sampling Distributions Sample
Confidence Intervals and Sample Size
 Confidence Intervals and Sample Size Chapter 6 shows us how we can use the Central Limit Theorem (CLT) to 1. estimate a population parameter (such as the mean or proportion) using a sample, and. determine
Statistics & Statistical Tests: Assumptions & Conclusions
 Degrees of Freedom Statistics & Statistical Tests: Assumptions & Conclusions Kinds of degrees of freedom Kinds of Distributions Kinds of Statistics & assumptions required to perform each Normal Distributions
1. Variability in estimates and CLT
 Unit3: Foundationsforinference 1. Variability in estimates and CLT Sta 101 - Fall 2015 Duke University, Department of Statistical Science Dr. Çetinkaya-Rundel Slides posted at http://bit.ly/sta101_f15
Data Analysis. BCF106 Fundamentals of Cost Analysis
 Data Analysis BCF106 Fundamentals of Cost Analysis June 009 Chapter 5 Data Analysis 5.0 Introduction... 3 5.1 Terminology... 3 5. Measures of Central Tendency... 5 5.3 Measures of Dispersion... 7 5.4 Frequency
Introduction to Business Statistics QM 120 Chapter 6
 DEPARTMENT OF QUANTITATIVE METHODS & INFORMATION SYSTEMS Introduction to Business Statistics QM 120 Chapter 6 Spring 2008 Chapter 6: Continuous Probability Distribution 2 When a RV x is discrete, we can
FEEG6017 lecture: The normal distribution, estimation, confidence intervals. Markus Brede,
 FEEG6017 lecture: The normal distribution, estimation, confidence intervals. Markus Brede, mb8@ecs.soton.ac.uk The normal distribution The normal distribution is the classic "bell curve". We've seen that
STAT Chapter 5: Continuous Distributions. Probability distributions are used a bit differently for continuous r.v. s than for discrete r.v. s.
 STAT 515 -- Chapter 5: Continuous Distributions Probability distributions are used a bit differently for continuous r.v. s than for discrete r.v. s. Continuous distributions typically are represented by
continuous rv Note for a legitimate pdf, we have f (x) 0 and f (x)dx = 1. For a continuous rv, P(X = c) = c f (x)dx = 0, hence
 0 and f (x)dx = 1. For a continuous rv, P(X = c) = c f (x)dx = 0, hence") continuous rv Let X be a continuous rv. Then a probability distribution or probability density function (pdf) of X is a function f(x) such that for any two numbers a and b with a b, P(a X b) = b a f (x)dx.
continuous rv Let X be a continuous rv. Then a probability distribution or probability density function (pdf) of X is a function f(x) such that for any two numbers a and b with a b, P(a X b) = b a f (x)dx.
Statistics 13 Elementary Statistics
 Statistics 13 Elementary Statistics Summer Session I 2012 Lecture Notes 5: Estimation with Confidence intervals 1 Our goal is to estimate the value of an unknown population parameter, such as a population
Sampling & Confidence Intervals
 Sampling & Confidence Intervals Mark Lunt Arthritis Research UK Epidemiology Unit University of Manchester 24/10/2017 Principles of Sampling Often, it is not practical to measure every subject in a population.
STA258H5. Al Nosedal and Alison Weir. Winter Al Nosedal and Alison Weir STA258H5 Winter / 42
 STA258H5 Al Nosedal and Alison Weir Winter 2017 Al Nosedal and Alison Weir STA258H5 Winter 2017 1 / 42 CONFIDENCE INTERVALS FOR σ 2 Al Nosedal and Alison Weir STA258H5 Winter 2017 2 / 42 Background We
Lecture 8: Single Sample t test
 Lecture 8: Single Sample t test Review: single sample z-test Compares the sample (after treatment) to the population (before treatment) You HAVE to know the populational mean & standard deviation to use
Module 4: Probability
 Module 4: Probability 1 / 22 Probability concepts in statistical inference Probability is a way of quantifying uncertainty associated with random events and is the basis for statistical inference. Inference
2011 Pearson Education, Inc
 Statistics for Business and Economics Chapter 4 Random Variables & Probability Distributions Content 1. Two Types of Random Variables 2. Probability Distributions for Discrete Random Variables 3. The Binomial
Confidence Intervals for the Difference Between Two Means with Tolerance Probability
 Chapter 47 Confidence Intervals for the Difference Between Two Means with Tolerance Probability Introduction This procedure calculates the sample size necessary to achieve a specified distance from the
4.2 Probability Distributions
 4.2 Probability Distributions Definition. A random variable is a variable whose value is a numerical outcome of a random phenomenon. The probability distribution of a random variable tells us what the
The "bell-shaped" curve, or normal curve, is a probability distribution that describes many real-life situations.
 6.1 6.2 The Standard Normal Curve The "bell-shaped" curve, or normal curve, is a probability distribution that describes many real-life situations. Basic Properties 1. The total area under the curve is.
Statistics 6 th Edition
 Statistics 6 th Edition Chapter 5 Discrete Probability Distributions Chap 5-1 Definitions Random Variables Random Variables Discrete Random Variable Continuous Random Variable Ch. 5 Ch. 6 Chap 5-2 Discrete
LESSON 7 INTERVAL ESTIMATION SAMIE L.S. LY
 LESSON 7 INTERVAL ESTIMATION SAMIE L.S. LY 1 THIS WEEK S PLAN Part I: Theory + Practice ( Interval Estimation ) Part II: Theory + Practice ( Interval Estimation ) z-based Confidence Intervals for a Population
5.7 Probability Distributions and Variance
 160 CHAPTER 5. PROBABILITY 5.7 Probability Distributions and Variance 5.7.1 Distributions of random variables We have given meaning to the phrase expected value. For example, if we flip a coin 100 times,
Lecture 10 - Confidence Intervals for Sample Means
 Lecture 10 - Confidence Intervals for Sample Means Sta102/BME102 October 5, 2015 Colin Rundel Confidence Intervals in the Real World A small problem Lets assume we are collecting a large sample (n=200)
Data Analysis and Statistical Methods Statistics 651
 Data Analysis and Statistical Methods Statistics 651 http://www.stat.tamu.edu/~suhasini/teaching.html Lecture 13 (MWF) Designing the experiment: Margin of Error Suhasini Subba Rao Terminology: The population
Data Analysis and Statistical Methods Statistics 651
 Review of previous lecture: Why confidence intervals? Data Analysis and Statistical Methods Statistics 651 http://www.stat.tamu.edu/~suhasini/teaching.html Suhasini Subba Rao Suppose you want to know the
1 Introduction 1. 3 Confidence interval for proportion p 6
 Math 321 Chapter 5 Confidence Intervals (draft version 2019/04/15-13:41:02) Contents 1 Introduction 1 2 Confidence interval for mean µ 2 2.1 Known variance................................. 3 2.2 Unknown
Statistics and Probability
 Statistics and Probability Continuous RVs (Normal); Confidence Intervals Outline Continuous random variables Normal distribution CLT Point estimation Confidence intervals http://www.isrec.isb-sib.ch/~darlene/geneve/