Data Analysis and Statistical Methods Statistics 651
|
|
|
- Alberta Blake
- 6 years ago
- Views:
Transcription
1 Data Analysis and Statistical Methods Statistics Lecture 14 (MWF) The t-distribution Suhasini Subba Rao
2 Review of previous lecture Often the precision of an estimator is stated in terms of it s margin of error. For example, the proportion of Americans that are happy is 40% with a margin of error 2.5%. We now know that margin of error corresponds to the plus/minus part in a confidence interval [ X E, X + E] = [ X σ , }{{ n X } Margin of Error σ 2 n ]. The margin of error does not mean that the proportion of Americans that 1
3 are happy is definitely in the interval [37.5, 42.5]% (this is the difference between knowing for certain and a confidence interval). Technically, the margin of error means that for every 100 sample mean drawn about 95% of them will lie inside the interval [ X E, X + E]. We can use the margin of error to determine the ideal sample size using the formula n = ( z α/2 σ) 2 E To calculate the margin of error we had to assume the standard deviation is known. If it is not known we need to come up with an intelligent guess for an upper bound. 2
4 How estimating the standard deviation effects our results Underlying the work so far, we have assumed that the standard deviation σ is known. This is sometimes a plausible assumption. For example if we want to compare the distances travelled last year with those of this year. Last year the mean distance travelled by a person was 2000 km and the standard deviation was 500 km. This year based on a sample of 50 people, the sample mean distance travelled was 2100 km. It would be reasonable to assume that the variance has not changed, only the mean may or may not have changed. However in general we will not have apriori knowledge of σ. σ will be unknown 3
5 Given a data set X 1,..., X n (say the 9 data values, 0.025,0.025,0.057,0.064,0.054,0.035,0.047,0.059,0.045, used in the lecture 13) we can estimate it. Recall we can estimate the variance using the sample variance s 2 = 1 n 1 n i=1 (X i X) 2. Constructing confidence intervals It seems reasonable that we then replace σ with s, to make z-transform or a 95% CI: z-transform 95% CI X µ σ 2 n X µ s 2 n [ X ± 1.96 σ n ] [ X ± 1.96 s n ] 4
6 Is this valid? Lecture 14 (MWF) The t-distribution Go to the applet dist/index.html and draw a sample from the normal distribution. How well does the sample standard deviation estimate the true standard deviation for small samples? 5
7 The effect of estimating the standard deviation Recall s is random it varies from sample to sample. If the sample size is relatively small it can often under estimate the true standard deviation. This can cause substantial problems when we evaluate the z-transform. Recall, the z-transform is the number of standard deviations between the mean and the sample mean. If the standard deviation has been underestimated, then the z-transform will be artifically larger than what it is suppose to be z = X µ σ X µ s n }{{ n } smaller. 6
8 In other words this estimated z-transform, which we call the t-transform t = X µ s n will have tend to have more extreme values than the standard normal (it has thicker tails). Equivalently, if we use the estimated standard deviation to construct the confidence interval, an underestimated standard deviation will result in a confidence interval that is too narrow. Consider the 95% confidence interval [ X 1.96 σ n, X σ n ] [ X 1.96 s n, X s n ]. 7
9 If s is smaller than σ than the interval will be too narrow for it correspond to 95% confidence. Both these arguments support the view than when we use the estimated standard deviation we need to correct for the fact that s tends to underestimate the true standard deviation σ. Indeed, it is very simple to make the correction. All we need to do is change the distribution, go from a normal distribution to a t-distribution. Below we give some historical background and what this means. 8
10 Gossett s experiment Lecture 14 (MWF) The t-distribution We find that when we estimate the variance (rather than use the true variance) we need to increase the size of the confidence interval to account for the greater variation in the Z-transform. This fact was discovered by William Gossett, who was a chemist, working for Guinness the brewery (in Ireland) and had to judge the quality of several brews. He was working with a small sample size X 1,..., X 10 (sample size is 10), and estimated the standard deviation from this s 2 = i=1 (X i X) 2. From previous experiments he knew that the true mean was µ = 4. He wanted to construct 95% CIs for the mean. But, rather than use the true variance σ 2, he replaced it with the sample variance 9
11 s 2 = 1 n n 1 i=1 (X i X) 2. For each sample of size 10 is constructed the CI he constructed the 95% CI: [ ] [ s 2 X , X s = 10 X 1.96 s, X s ] He counted the number of times the true mean µ was in the size the interval. You would expect that about 5% of the time the true mean should be outside the interval (since it is a 95% CI). What William Gosset noticed was that the true mean was outside the interval more than 5% of time. Hence the true mean is inside the interval less than 95% of the time. 10
12 This suggests that the interval is not long enough, and we need to use a longer interval for the 95% CI to be accurate. 11

13 An illustration: Confidence intervals We draw a sample of size 10, from a normal distribution, and estimate both the sample mean and standard deviation and construct a 95% CI using z = Observe only 91 of the 100 confidence intervals contain the mean. We have less confidence in this interval than the stated 95% level! 12
14 Introducing the t-distribution He investigated this further, he showed that by standardizing with the X µ sample standard deviation, the transformation (s/ did not have a n) standard normal distribution. Basically because the standard deviation has to be estimated it adds more randomness (uncertainty) into the system. More uncertainty means that the z-transform X µ (s/ n) is more likely to take large values (since the sample variance s 2 is random and tends to underestimate the true variance when the sample size is small). 13
15 An illustration: sample means and standard deviation Here we draw a sample of size 10 from a normal distribution. For each sample we evaluate the sample mean and sample standard deviation. You see that the sample mean is close to normal, but the sample standard deviation also has a distribution. Often the sample standard deviation underestimate the true variance. Therefore, when constructing a confidence interval we need to take the uncertainty associated with the sample standard deviation into account. 14
16 The t-distribution Lecture 14 (MWF) The t-distribution The standardisation with the sample standard deviation has the t- distribution t = X µ s/ n t(n 1), n is the number of observations used to estimate σ 2, eg s 2 = 1 n 1 n i=1 (X i X) 2. Unlike the case where σ 2 is known and distribution the distribution of X µ s/ n X µ σ/ n has a standard normal depends on the sample size. t(n 1) is a distribution like the standard normal distribution. The main difference is for different n we have a different distribution. 15
17 We call t(n 1) the Student t-distribution with (n 1)-degrees of freedom. We use Student, in honor of William Gosset (he wrote all his papers under the pseudonym Student). 16
18 What does this means for us? We can pretty much do everything was we did before, but when we estimate the variance we need to use the t-distribution instead of the standard normal (the t-values are larger than the z-values to compensate for the underestimation of standard deviation). Replace every standard normal with the t-distribution! Rather than use the normal tables we use the t-tables which are very easy to use (easier than the normal tables) and can be found on my website. 17
19 Reading t-tables Lecture 14 (MWF) The t-distribution 18
20 Confidence intervals using the t-distribution We know when the variance σ 2 is known. The (1 α)100% CI is [ ] σ 2 X z α/2 n, X σ 2 + z α/2. n When the variance σ 2 is unknown, estimate it from the data s 2 = 1 n 1 n i=1 (X i X) 2 and use the CI [ ] s 2 X t α/2 (n 1) n, X s 2 + t α/2 (n 1). n 19
 = 2.262 (compare with z = 1.96). By using the t-distribution we have 95% confidence the interval contains the mean. 20")
21 An illustration: Confidence intervals We draw a sample of size 10, from a normal distribution, and estimate both the sample mean and standard deviation and construct a 95% CI using t (9) = (compare with z = 1.96). By using the t-distribution we have 95% confidence the interval contains the mean. 20
22 Example 1: Red Wine and polyphenols It has been suggested that drinking red wine in moderation may protect against heart attacks. This is because red wine contains polyphenols which act on blood cholesterol. To see if moderate wine consumption does increase polyphenols, a group of nine random selected males were assigned to drink half a bottle of red wine daily for two weeks. The percentage change in their blood levels are 0.7, 3.5, 4, 4.9, 5.5, 7, 7.4, 8.1, 8.4 Here s the data: red_wine_polyphenol.txt. The sample mean is x = 5.5 and sample standard deviation is Construct a 95% confidence interval and discuss what your results possibly imply. 21
23 Solution 1: in JMP Lecture 14 (MWF) The t-distribution 22
24 Solution 1: in JMP Lecture 14 (MWF) The t-distribution When the sample size is so small it is very hard to tell from the QQplot whether the data has come from a normal distribution. Instead we need to rely on our knowledge of how the data was collected. As a blood sample is a biological experiment, it seems plausible that its distribution does not have a severe skew or heavy tails. If this is the case, the distribution of the data is unlikely to deviate hugely from normality. Thus, the sample mean based on 9 is likely to be close to normal. Under this assumption we can proceed with the analysis. 23
25 Solution 1: Red Wine Lecture 14 (MWF) The t-distribution There are two problems when constructing a confidence interval for the above data: The sample size is small, therefore to construct a reliable confidence interval we need that the distribution of the blood samples is not too far from normally distributed (see the discussion on the previous page). We do not know the standard deviation and have to estimate it from the data. We demonstrated using the applet that when the sample size is small, we are likely to under estimate the standard deviation. This means that we have under estimated the margin of error in the confidence interval. In turn this means that our 95% confidence using the normal (1.96) will not be 95% and the confidence level is less than 95% (our interval is not 95% reliable). 24
26 To address the second issue we use the t distribution instead of the normal distribution. The calculation: t-tables with 8df (sample size, 9, minus one) we get a 95% CI for the mean which is [5.5 ± ] = [3.57, 7.43]. 25
27 Example 2: Red Wine II We return to the same question but in order to get a smaller margin of error we include 6 extra males in our study. edu/~suhasini/teaching651/red_wine_polyphenol.txt. Notice some of the new guys actually had a drop in their polyphenol levels! 26
28 The sample mean is 4.3 and the sample standard deviation is Solution We now use a t-distribution with 14 degrees of freedom and the 95% CI for the mean level after drinking wine (for two weeks) is [4.3 ± ] = [2.1, 6]. Observe that the factor has decreased from the given in the previous example. This is because, the sample standard deviation based on n = 15 will tend to be closer to the population standard deviation, hence we don t require such a large interval to be 95% confident the CI captures the mean. 27
29 Comparing Example 1 and 2 The difference between Example 1 and Example 2 is the sample size has grown from 9 to 15. We compare the two samples below: We see that the smaller sample size contains less extreme values (the people whose polyphenol level went down with wine consumption). The less spread in the smaller sample size means that the estimated standard deviation using the smaller sample will be smaller than the second sample (look at the output below). We see that for smaller sample sizes the 28
30 estimated standard deviation tends to underestimate the true population standard deviation. What this means, is that if we were to WRONGLY USE 1.96 (z-value at 2.5% level using normal tables) to construct a 95% confidence interval, the interval would be much narrower than the desired 95% confidence level. 29
31 We correct for this problem by using the t-distribution instead of the normal distribution. However, for large sample sizes, the estimated standard deviation is likely to be closer to the true populations standard deviation, therefore we do not need to correct so much for the underestimation of the standard deviation (this is why we use the factor (2.5% from t-tables with 14df) is used rather than (2.5% from t-tables with 8df)). 30

32 Comparing t and normal distributions Two times the area to the RIGHT of 1.96, tells is the exact confidence we have in the interval when we use 1.96 instead of the correct t-value/ 31
33 Toy example: using the wrong distribution Consider the data set 4, 5.5, 6, my estimate of the mean is x = 5.17 and the estimated standard deviation is s = 1 2 [(4 5.17)2 + ( ) 2 + (6 5.17) 2 ] = With just three points it is highly likely the true standard deviation has been substantially underestimated. Suppose we ignore the fact that the sample standard deviation has been estimated and use instead the normal factor to construct the confidence interval. Our incorrect 95% CI is [ , ]. 32
34 On two slides previous, we showed that if we use 1.96 as the critical value, then by going to the distribution with 2df, the areas to the right of 1.96 is 9.45% (not 2.5%). This means that the interval we have constructed above is not a 95% confidence interval, but a = 80.1% confidence interval. There is a lot less confidence in this interval containing the mean then we thought we had. We can see from the next slides that if we want to have 95% confidence in the interval containing the mean, we need to use the interval [ , ]. This is a lot wider than we than the previous incorrect interval. 33
. Below we give the spread of the sample standard deviation when n = 10 and n = 40, see the spread reduces as n gets larger.")
35 Sample size and the sample standard deviation As the sample size grows, not both the spread of the sample mean and the sample standard deviation decrease (less spread means they are more likely to be close to the population parameters). Below we give the spread of the sample standard deviation when n = 10 and n = 40, see the spread reduces as n gets larger. 34
36 The t-distribution at 2.5% percentile for different n As the spread of the sample variance decreases, we see that the t-values get closer to 1.96 as n grows. 35
37 Why the distribution depends on the sample size? Consider the following situation. If you were to estimate the variance using 100 observations, you would expect it to be far better than an estimator calculated using 10 observation. The idea here is exactly the same as expecting the estimator of the mean involving 100 observation to be far better than an estimator involving 10 observations. Therefore when the sample size is small, the sample variance is more likely to underestimate the true population variance than when the sample is large. Hence when the sample size is small, it is reasonable to suppose that the distribution of X 10 µ is more random than when the sample size is s
38 large X 100 µ. Therefore, the t-distribution for smaller sample sizes will s have thicker tails (more likely to obtain extreme values) than for large samples. This manifests in larger t-values at the same level. 37
39 Example: 95% Confidence intervals We know when the variance σ 2 is known. The 95% CI is [ X σ n, varx σ 2 n ]. When the variance is estimated, the 95% CI is n = 3, n 1 = 2, t (2) = The CI is [ X s , X s ]. n = 10, n 1 = 9, t (9) = The CI is [ X s , X n = 30, n 1 = 29, t (29) = The CI is [ X s , X n = 121, n 1 = 120, t (120) = The CI is [ X s , X s ]. s 2 10 ]. s 2 30 ]. 38
40 The t-distribution and sample size We know that z = For the t-distribution we have n = 3, n 1 = 2, t (2) = n = 10, n 1 = 9, t (9) = n = 30, n 1 = 29, t (29) = n = 121, n 1 = 120, t (120) = We see as n gets larger the value of t (n) gets closer to z = In fact for n > 50 we generally don t use the t-distribution, but instead approximate this by the normal distribution. 39
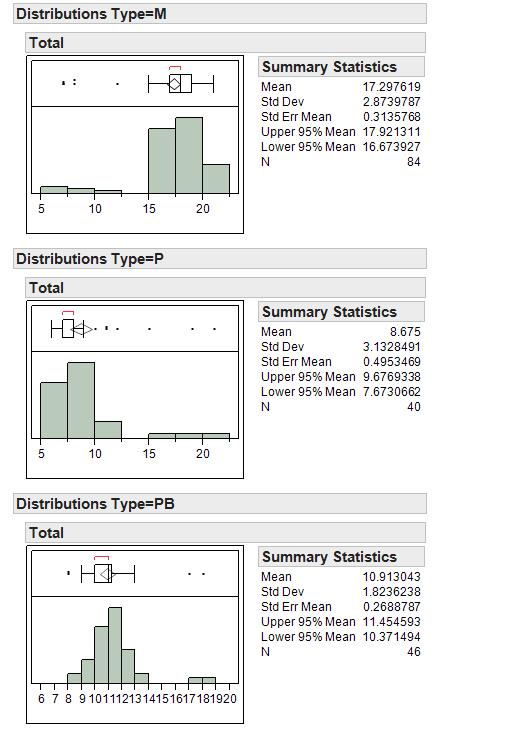
41 Example: Comparing the mean number of M&Ms in a bag We now analyse the M&M data to see whether the mean number of M&Ms in a bag vary according to the type of M&M. The data can be found here: There is a proper formal method called ANOVA, which we cover in lecture 24, where we can check to see whether all three have the same mean or not. However, a crude method is to simply check their confidence intervals. 40
42 41
43 Solution: Analysis and interpretation As the sample sizes used to construct each confidence interval are large (over 30 in each case), even though the distribution of M&Ms is not normal (they are integer valued!), it is safe to assume that the average is close to normal, therefore these 95% confidence intervals are reliably 95%. A summary of the output is given below: Plain: sample mean = 17.2, standard error = 0.31, CI = [16.67,17.92]. Peanut: sample mean = 8.6, standard error = 0.49, CI = [7.67,9.76]. Peanut butter: sample mean = 10.9, standard error = 0.26, CI = [10.37,11.45]. As none of the confidence intervals (recalling that in this interval we believe the mean for each case should like) intersect our crude analysis suggests that the means are all different. 42
44 In lecture 19 we will make the above precise (by constructing a confidence interval for the differences in the means). 43
45 IMPORTANT!!! Lecture 14 (MWF) The t-distribution A common mistake that students make is that the t-distribution is used to correct for the non-normality of sample mean (for example when the sample size is not large enough). NOOOOOOOOOOOOOOOOOOOOOOOO In order to use the t-distribution we require that the sample mean is close to normal. THE ONLY REASON WE USE THE T-DISTRIBUTION is because the true population standard deviation is unknown and us estimated from the data. The t-distribution is used to correct for the error in the estimated standard deviation. 44

46 The t-distribution cannot correct for non-normality of the data Here we draw a sample of size 10 from a right-skewed distribution and use the t-distribution to construct a confidence interval for the mean. We see that only 87% of the confidence intervals contain the mean. Using the 45
Data Analysis and Statistical Methods Statistics 651
 Data Analysis and Statistical Methods Statistics 651 http://www.stat.tamu.edu/~suhasini/teaching.html Lecture 14 (MWF) The t-distribution Suhasini Subba Rao Review of previous lecture Often the precision
6.1, 7.1 Estimating with confidence (CIS: Chapter 10)
") Objectives 6.1, 7.1 Estimating with confidence (CIS: Chapter 10) Statistical confidence (CIS gives a good explanation of a 95% CI) Confidence intervals Choosing the sample size t distributions One-sample
Objectives 6.1, 7.1 Estimating with confidence (CIS: Chapter 10) Statistical confidence (CIS gives a good explanation of a 95% CI) Confidence intervals Choosing the sample size t distributions One-sample
Data Analysis and Statistical Methods Statistics 651
 Data Analysis and Statistical Methods Statistics 651 http://www.stat.tamu.edu/~suhasini/teaching.html Lecture 13 (MWF) Designing the experiment: Margin of Error Suhasini Subba Rao Terminology: The population
Data Analysis and Statistical Methods Statistics 651
 Data Analysis and Statistical Methods Statistics 651 http://www.stat.tamu.edu/~suhasini/teaching.html Lecture 10 (MWF) Checking for normality of the data using the QQplot Suhasini Subba Rao Review of previous
Lecture 2 INTERVAL ESTIMATION II
 Lecture 2 INTERVAL ESTIMATION II Recap Population of interest - want to say something about the population mean µ perhaps Take a random sample... Recap When our random sample follows a normal distribution,
Chapter 8 Statistical Intervals for a Single Sample
 Chapter 8 Statistical Intervals for a Single Sample Part 1: Confidence intervals (CI) for population mean µ Section 8-1: CI for µ when σ 2 known & drawing from normal distribution Section 8-1.2: Sample
Interval estimation. September 29, Outline Basic ideas Sampling variation and CLT Interval estimation using X More general problems
 Interval estimation September 29, 2017 STAT 151 Class 7 Slide 1 Outline of Topics 1 Basic ideas 2 Sampling variation and CLT 3 Interval estimation using X 4 More general problems STAT 151 Class 7 Slide
Data Analysis and Statistical Methods Statistics 651
 Data Analysis and Statistical Methods Statistics 651 http://www.stat.tamu.edu/~suhasini/teaching.html Lecture 10 (MWF) Checking for normality of the data using the QQplot Suhasini Subba Rao Checking for
Data Analysis and Statistical Methods Statistics 651
 Data Analysis and Statistical Methods Statistics 651 http://wwwstattamuedu/~suhasini/teachinghtml Suhasini Subba Rao Review of previous lecture The main idea in the previous lecture is that the sample
STAT Chapter 7: Confidence Intervals
 STAT 515 -- Chapter 7: Confidence Intervals With a point estimate, we used a single number to estimate a parameter. We can also use a set of numbers to serve as reasonable estimates for the parameter.
μ: ESTIMATES, CONFIDENCE INTERVALS, AND TESTS Business Statistics
 μ: ESTIMATES, CONFIDENCE INTERVALS, AND TESTS Business Statistics CONTENTS Estimating parameters The sampling distribution Confidence intervals for μ Hypothesis tests for μ The t-distribution Comparison
1 Inferential Statistic
 1 Inferential Statistic Population versus Sample, parameter versus statistic A population is the set of all individuals the researcher intends to learn about. A sample is a subset of the population and
Data Analysis and Statistical Methods Statistics 651
 Review of previous lecture: Why confidence intervals? Data Analysis and Statistical Methods Statistics 651 http://www.stat.tamu.edu/~suhasini/teaching.html Suhasini Subba Rao Suppose you want to know the
Chapter 14 : Statistical Inference 1. Note : Here the 4-th and 5-th editions of the text have different chapters, but the material is the same.
 Chapter 14 : Statistical Inference 1 Chapter 14 : Introduction to Statistical Inference Note : Here the 4-th and 5-th editions of the text have different chapters, but the material is the same. Data x
Lecture 10 - Confidence Intervals for Sample Means
 Lecture 10 - Confidence Intervals for Sample Means Sta102/BME102 October 5, 2015 Colin Rundel Confidence Intervals in the Real World A small problem Lets assume we are collecting a large sample (n=200)
Data Analysis and Statistical Methods Statistics 651
 Data Analysis and Statistical Methods Statistics 651 http://www.stat.tamu.edu/~suhasini/teaching.html Suhasini Subba Rao The binomial: mean and variance Recall that the number of successes out of n, denoted
Elementary Statistics
 Chapter 7 Estimation Goal: To become familiar with how to use Excel 2010 for Estimation of Means. There is one Stat Tool in Excel that is used with estimation of means, T.INV.2T. Open Excel and click on
Confidence Intervals Introduction
 Confidence Intervals Introduction A point estimate provides no information about the precision and reliability of estimation. For example, the sample mean X is a point estimate of the population mean μ
Chapter 4: Estimation
 Slide 4.1 Chapter 4: Estimation Estimation is the process of using sample data to draw inferences about the population Sample information x, s Inferences Population parameters µ,σ Slide 4. Point and interval
χ 2 distributions and confidence intervals for population variance
 χ 2 distributions and confidence intervals for population variance Let Z be a standard Normal random variable, i.e., Z N(0, 1). Define Y = Z 2. Y is a non-negative random variable. Its distribution is
Chapter 6.1 Confidence Intervals. Stat 226 Introduction to Business Statistics I. Chapter 6, Section 6.1
 Stat 226 Introduction to Business Statistics I Spring 2009 Professor: Dr. Petrutza Caragea Section A Tuesdays and Thursdays 9:30-10:50 a.m. Chapter 6, Section 6.1 Confidence Intervals Confidence Intervals
CHAPTER 8. Confidence Interval Estimation Point and Interval Estimates
 CHAPTER 8. Confidence Interval Estimation Point and Interval Estimates A point estimate is a single number, a confidence interval provides additional information about the variability of the estimate Lower
Determining Sample Size. Slide 1 ˆ ˆ. p q n E = z α / 2. (solve for n by algebra) n = E 2
 n = E 2") Determining Sample Size Slide 1 E = z α / 2 ˆ ˆ p q n (solve for n by algebra) n = ( zα α / 2) 2 p ˆ qˆ E 2 Sample Size for Estimating Proportion p When an estimate of ˆp is known: Slide 2 n = ˆ ˆ ( )
Determining Sample Size Slide 1 E = z α / 2 ˆ ˆ p q n (solve for n by algebra) n = ( zα α / 2) 2 p ˆ qˆ E 2 Sample Size for Estimating Proportion p When an estimate of ˆp is known: Slide 2 n = ˆ ˆ ( )
Learning Objectives for Ch. 7
 Chapter 7: Point and Interval Estimation Hildebrand, Ott and Gray Basic Statistical Ideas for Managers Second Edition 1 Learning Objectives for Ch. 7 Obtaining a point estimate of a population parameter
Elementary Statistics Triola, Elementary Statistics 11/e Unit 14 The Confidence Interval for Means, σ Unknown
 Elementary Statistics We are now ready to begin our exploration of how we make estimates of the population mean. Before we get started, I want to emphasize the importance of having collected a representative
Chapter 7. Confidence Intervals and Sample Sizes. Definition. Definition. Definition. Definition. Confidence Interval : CI. Point Estimate.
 Chapter 7 Confidence Intervals and Sample Sizes 7. Estimating a Proportion p 7.3 Estimating a Mean µ (σ known) 7.4 Estimating a Mean µ (σ unknown) 7.5 Estimating a Standard Deviation σ In a recent poll,
FEEG6017 lecture: The normal distribution, estimation, confidence intervals. Markus Brede,
 FEEG6017 lecture: The normal distribution, estimation, confidence intervals. Markus Brede, mb8@ecs.soton.ac.uk The normal distribution The normal distribution is the classic "bell curve". We've seen that
The topics in this section are related and necessary topics for both course objectives.
 2.5 Probability Distributions The topics in this section are related and necessary topics for both course objectives. A probability distribution indicates how the probabilities are distributed for outcomes
Statistical Intervals. Chapter 7 Stat 4570/5570 Material from Devore s book (Ed 8), and Cengage
, and Cengage") 7 Statistical Intervals Chapter 7 Stat 4570/5570 Material from Devore s book (Ed 8), and Cengage Confidence Intervals The CLT tells us that as the sample size n increases, the sample mean X is close to
7 Statistical Intervals Chapter 7 Stat 4570/5570 Material from Devore s book (Ed 8), and Cengage Confidence Intervals The CLT tells us that as the sample size n increases, the sample mean X is close to
The Two-Sample Independent Sample t Test
 Department of Psychology and Human Development Vanderbilt University 1 Introduction 2 3 The General Formula The Equal-n Formula 4 5 6 Independence Normality Homogeneity of Variances 7 Non-Normality Unequal
Data Analysis and Statistical Methods Statistics 651
 Data Analysis and Statistical Methods Statistics 651 http://www.stat.tamu.edu/~suhasini/teaching.html Lecture 7 (MWF) Analyzing the sums of binary outcomes Suhasini Subba Rao Introduction Lecture 7 (MWF)
T.I.H.E. IT 233 Statistics and Probability: Sem. 1: 2013 ESTIMATION
 In Inferential Statistic, ESTIMATION (i) (ii) is called the True Population Mean and is called the True Population Proportion. You must also remember that are not the only population parameters. There
σ 2 : ESTIMATES, CONFIDENCE INTERVALS, AND TESTS Business Statistics
 σ : ESTIMATES, CONFIDENCE INTERVALS, AND TESTS Business Statistics CONTENTS Estimating other parameters besides μ Estimating variance Confidence intervals for σ Hypothesis tests for σ Estimating standard
8.1 Estimation of the Mean and Proportion
 8.1 Estimation of the Mean and Proportion Statistical inference enables us to make judgments about a population on the basis of sample information. The mean, standard deviation, and proportions of a population
Estimation Y 3. Confidence intervals I, Feb 11,
 Estimation Example: Cholesterol levels of heart-attack patients Data: Observational study at a Pennsylvania medical center blood cholesterol levels patients treated for heart attacks measurements 2, 4,
1. Statistical problems - a) Distribution is known. b) Distribution is unknown.
 Distribution is known. b) Distribution is unknown.") Probability February 5, 2013 Debdeep Pati Estimation 1. Statistical problems - a) Distribution is known. b) Distribution is unknown. 2. When Distribution is known, then we can have either i) Parameters
Probability February 5, 2013 Debdeep Pati Estimation 1. Statistical problems - a) Distribution is known. b) Distribution is unknown. 2. When Distribution is known, then we can have either i) Parameters
Hypothesis Tests: One Sample Mean Cal State Northridge Ψ320 Andrew Ainsworth PhD
 Hypothesis Tests: One Sample Mean Cal State Northridge Ψ320 Andrew Ainsworth PhD MAJOR POINTS Sampling distribution of the mean revisited Testing hypotheses: sigma known An example Testing hypotheses:
1. Confidence Intervals (cont.)
") Math 1125-Introductory Statistics Lecture 23 11/1/06 1. Confidence Intervals (cont.) Let s review. We re in a situation, where we don t know µ, but we have a number from a normal population, either an
Math 1125-Introductory Statistics Lecture 23 11/1/06 1. Confidence Intervals (cont.) Let s review. We re in a situation, where we don t know µ, but we have a number from a normal population, either an
Confidence Intervals. σ unknown, small samples The t-statistic /22
 Confidence Intervals σ unknown, small samples The t-statistic 1 /22 Homework Read Sec 7-3. Discussion Question pg 365 Do Ex 7-3 1-4, 6, 9, 12, 14, 15, 17 2/22 Objective find the confidence interval for
AMS 7 Sampling Distributions, Central limit theorem, Confidence Intervals Lecture 4
 AMS 7 Sampling Distributions, Central limit theorem, Confidence Intervals Lecture 4 Department of Applied Mathematics and Statistics, University of California, Santa Cruz Summer 2014 1 / 26 Sampling Distributions!!!!!!
A point estimate is a single value (statistic) used to estimate a population value (parameter).
 used to estimate a population value (parameter).") Shahzad Bashir. 1 Chapter 9 Estimation & Confidence Interval Interval Estimation for Population Mean: σ Known Interval Estimation for Population Mean: σ Unknown Determining the Sample Size 2 A point estimate
Shahzad Bashir. 1 Chapter 9 Estimation & Confidence Interval Interval Estimation for Population Mean: σ Known Interval Estimation for Population Mean: σ Unknown Determining the Sample Size 2 A point estimate
Statistical Intervals (One sample) (Chs )
 (Chs )") 7 Statistical Intervals (One sample) (Chs 8.1-8.3) Confidence Intervals The CLT tells us that as the sample size n increases, the sample mean X is close to normally distributed with expected value µ and
7 Statistical Intervals (One sample) (Chs 8.1-8.3) Confidence Intervals The CLT tells us that as the sample size n increases, the sample mean X is close to normally distributed with expected value µ and
1/12/2011. Chapter 5: z-scores: Location of Scores and Standardized Distributions. Introduction to z-scores. Introduction to z-scores cont.
 Chapter 5: z-scores: Location of Scores and Standardized Distributions Introduction to z-scores In the previous two chapters, we introduced the concepts of the mean and the standard deviation as methods
MgtOp S 215 Chapter 8 Dr. Ahn
 MgtOp S 215 Chapter 8 Dr. Ahn An estimator of a population parameter is a rule that tells us how to use the sample values,,, to estimate the parameter, and is a statistic. An estimate is the value obtained
Sampling & Confidence Intervals
 Sampling & Confidence Intervals Mark Lunt Arthritis Research UK Epidemiology Unit University of Manchester 24/10/2017 Principles of Sampling Often, it is not practical to measure every subject in a population.
Descriptive Statistics (Devore Chapter One)
") Descriptive Statistics (Devore Chapter One) 1016-345-01 Probability and Statistics for Engineers Winter 2010-2011 Contents 0 Perspective 1 1 Pictorial and Tabular Descriptions of Data 2 1.1 Stem-and-Leaf
Descriptive Statistics (Devore Chapter One) 1016-345-01 Probability and Statistics for Engineers Winter 2010-2011 Contents 0 Perspective 1 1 Pictorial and Tabular Descriptions of Data 2 1.1 Stem-and-Leaf
Unit 5: Sampling Distributions of Statistics
 Unit 5: Sampling Distributions of Statistics Statistics 571: Statistical Methods Ramón V. León 6/12/2004 Unit 5 - Stat 571 - Ramon V. Leon 1 Definitions and Key Concepts A sample statistic used to estimate
Unit 5: Sampling Distributions of Statistics
 Unit 5: Sampling Distributions of Statistics Statistics 571: Statistical Methods Ramón V. León 6/12/2004 Unit 5 - Stat 571 - Ramon V. Leon 1 Definitions and Key Concepts A sample statistic used to estimate
Statistics 13 Elementary Statistics
 Statistics 13 Elementary Statistics Summer Session I 2012 Lecture Notes 5: Estimation with Confidence intervals 1 Our goal is to estimate the value of an unknown population parameter, such as a population
Week 2 Quantitative Analysis of Financial Markets Hypothesis Testing and Confidence Intervals
 Week 2 Quantitative Analysis of Financial Markets Hypothesis Testing and Confidence Intervals Christopher Ting http://www.mysmu.edu/faculty/christophert/ Christopher Ting : christopherting@smu.edu.sg :
LESSON 7 INTERVAL ESTIMATION SAMIE L.S. LY
 LESSON 7 INTERVAL ESTIMATION SAMIE L.S. LY 1 THIS WEEK S PLAN Part I: Theory + Practice ( Interval Estimation ) Part II: Theory + Practice ( Interval Estimation ) z-based Confidence Intervals for a Population
Statistics Class 15 3/21/2012
 Statistics Class 15 3/21/2012 Quiz 1. Cans of regular Pepsi are labeled to indicate that they contain 12 oz. Data Set 17 in Appendix B lists measured amounts for a sample of Pepsi cans. The same statistics
ECON 214 Elements of Statistics for Economists 2016/2017
 ECON 214 Elements of Statistics for Economists 2016/2017 Topic The Normal Distribution Lecturer: Dr. Bernardin Senadza, Dept. of Economics bsenadza@ug.edu.gh College of Education School of Continuing and
10/1/2012. PSY 511: Advanced Statistics for Psychological and Behavioral Research 1
 PSY 511: Advanced Statistics for Psychological and Behavioral Research 1 Pivotal subject: distributions of statistics. Foundation linchpin important crucial You need sampling distributions to make inferences:
Estimation and Confidence Intervals
 Estimation and Confidence Intervals Chapter 9-1/2 McGraw-Hill/Irwin Copyright 2011 by the McGraw-Hill Companies, Inc. All rights reserved. LEARNING OBJECTIVES LO1. Define a point estimate. LO2. Define
Confidence Intervals and Sample Size
 Confidence Intervals and Sample Size Chapter 6 shows us how we can use the Central Limit Theorem (CLT) to 1. estimate a population parameter (such as the mean or proportion) using a sample, and. determine
Lecture 2. Probability Distributions Theophanis Tsandilas
 Lecture 2 Probability Distributions Theophanis Tsandilas Comment on measures of dispersion Why do common measures of dispersion (variance and standard deviation) use sums of squares: nx (x i ˆµ) 2 i=1
Lecture 16: Estimating Parameters (Confidence Interval Estimates of the Mean)
") Statistics 16_est_parameters.pdf Michael Hallstone, Ph.D. hallston@hawaii.edu Lecture 16: Estimating Parameters (Confidence Interval Estimates of the Mean) Some Common Sense Assumptions for Interval Estimates
Statistics 16_est_parameters.pdf Michael Hallstone, Ph.D. hallston@hawaii.edu Lecture 16: Estimating Parameters (Confidence Interval Estimates of the Mean) Some Common Sense Assumptions for Interval Estimates
Lecture 9 - Sampling Distributions and the CLT. Mean. Margin of error. Sta102/BME102. February 6, Sample mean ( X ): x i
: x i") Lecture 9 - Sampling Distributions and the CLT Sta102/BME102 Colin Rundel February 6, 2015 http:// pewresearch.org/ pubs/ 2191/ young-adults-workers-labor-market-pay-careers-advancement-recession Sta102/BME102
Lecture 9 - Sampling Distributions and the CLT Sta102/BME102 Colin Rundel February 6, 2015 http:// pewresearch.org/ pubs/ 2191/ young-adults-workers-labor-market-pay-careers-advancement-recession Sta102/BME102
Previously, when making inferences about the population mean, μ, we were assuming the following simple conditions:
 Chapter 17 Inference about a Population Mean Conditions for inference Previously, when making inferences about the population mean, μ, we were assuming the following simple conditions: (1) Our data (observations)
ECE 295: Lecture 03 Estimation and Confidence Interval
 ECE 295: Lecture 03 Estimation and Confidence Interval Spring 2018 Prof Stanley Chan School of Electrical and Computer Engineering Purdue University 1 / 23 Theme of this Lecture What is Estimation? You
Version A. Problem 1. Let X be the continuous random variable defined by the following pdf: 1 x/2 when 0 x 2, f(x) = 0 otherwise.
 = 0 otherwise.") Math 224 Q Exam 3A Fall 217 Tues Dec 12 Version A Problem 1. Let X be the continuous random variable defined by the following pdf: { 1 x/2 when x 2, f(x) otherwise. (a) Compute the mean µ E[X]. E[X] x
Math 224 Q Exam 3A Fall 217 Tues Dec 12 Version A Problem 1. Let X be the continuous random variable defined by the following pdf: { 1 x/2 when x 2, f(x) otherwise. (a) Compute the mean µ E[X]. E[X] x
Numerical Descriptive Measures. Measures of Center: Mean and Median
 Steve Sawin Statistics Numerical Descriptive Measures Having seen the shape of a distribution by looking at the histogram, the two most obvious questions to ask about the specific distribution is where
Lecture 9 - Sampling Distributions and the CLT
 Lecture 9 - Sampling Distributions and the CLT Sta102/BME102 Colin Rundel September 23, 2015 1 Variability of Estimates Activity Sampling distributions - via simulation Sampling distributions - via CLT
Statistics for Business and Economics
 Statistics for Business and Economics Chapter 7 Estimation: Single Population Copyright 010 Pearson Education, Inc. Publishing as Prentice Hall Ch. 7-1 Confidence Intervals Contents of this chapter: Confidence
value BE.104 Spring Biostatistics: Distribution and the Mean J. L. Sherley
 BE.104 Spring Biostatistics: Distribution and the Mean J. L. Sherley Outline: 1) Review of Variation & Error 2) Binomial Distributions 3) The Normal Distribution 4) Defining the Mean of a population Goals:
Chapter 9. Sampling Distributions. A sampling distribution is created by, as the name suggests, sampling.
 Chapter 9 Sampling Distributions 9.1 Sampling Distributions A sampling distribution is created by, as the name suggests, sampling. The method we will employ on the rules of probability and the laws of
Chapter 6. y y. Standardizing with z-scores. Standardizing with z-scores (cont.)
") Starter Ch. 6: A z-score Analysis Starter Ch. 6 Your Statistics teacher has announced that the lower of your two tests will be dropped. You got a 90 on test 1 and an 85 on test 2. You re all set to drop
Starter Ch. 6: A z-score Analysis Starter Ch. 6 Your Statistics teacher has announced that the lower of your two tests will be dropped. You got a 90 on test 1 and an 85 on test 2. You re all set to drop
ECO220Y Estimation: Confidence Interval Estimator for Sample Proportions Readings: Chapter 11 (skip 11.5)
") ECO220Y Estimation: Confidence Interval Estimator for Sample Proportions Readings: Chapter 11 (skip 11.5) Fall 2011 Lecture 10 (Fall 2011) Estimation Lecture 10 1 / 23 Review: Sampling Distributions Sample
ECO220Y Estimation: Confidence Interval Estimator for Sample Proportions Readings: Chapter 11 (skip 11.5) Fall 2011 Lecture 10 (Fall 2011) Estimation Lecture 10 1 / 23 Review: Sampling Distributions Sample
Estimating parameters 5.3 Confidence Intervals 5.4 Sample Variance
 Estimating parameters 5.3 Confidence Intervals 5.4 Sample Variance Prof. Tesler Math 186 Winter 2017 Prof. Tesler Ch. 5: Confidence Intervals, Sample Variance Math 186 / Winter 2017 1 / 29 Estimating parameters
Figure 1: 2πσ is said to have a normal distribution with mean µ and standard deviation σ. This is also denoted
 Figure 1: Math 223 Lecture Notes 4/1/04 Section 4.10 The normal distribution Recall that a continuous random variable X with probability distribution function f(x) = 1 µ)2 (x e 2σ 2πσ is said to have a
1 Small Sample CI for a Population Mean µ
 Lecture 7: Small Sample Confidence Intervals Based on a Normal Population Distribution Readings: Sections 7.4-7.5 1 Small Sample CI for a Population Mean µ The large sample CI x ± z α/2 s n was constructed
Copyright 2011 Pearson Education, Inc. Publishing as Addison-Wesley.
 Appendix: Statistics in Action Part I Financial Time Series 1. These data show the effects of stock splits. If you investigate further, you ll find that most of these splits (such as in May 1970) are 3-for-1
Distribution. Lecture 34 Section Fri, Oct 31, Hampden-Sydney College. Student s t Distribution. Robb T. Koether.
 Lecture 34 Section 10.2 Hampden-Sydney College Fri, Oct 31, 2008 Outline 1 2 3 4 5 6 7 8 Exercise 10.4, page 633. A psychologist is studying the distribution of IQ scores of girls at an alternative high
Confidence Intervals for the Difference Between Two Means with Tolerance Probability
 Chapter 47 Confidence Intervals for the Difference Between Two Means with Tolerance Probability Introduction This procedure calculates the sample size necessary to achieve a specified distance from the
Key Objectives. Module 2: The Logic of Statistical Inference. Z-scores. SGSB Workshop: Using Statistical Data to Make Decisions
 SGSB Workshop: Using Statistical Data to Make Decisions Module 2: The Logic of Statistical Inference Dr. Tom Ilvento January 2006 Dr. Mugdim Pašić Key Objectives Understand the logic of statistical inference
Homework: (Due Wed) Chapter 10: #5, 22, 42
 Chapter 10: #5, 22, 42") Announcements: Discussion today is review for midterm, no credit. You may attend more than one discussion section. Bring 2 sheets of notes and calculator to midterm. We will provide Scantron form. Homework:
Announcements: Discussion today is review for midterm, no credit. You may attend more than one discussion section. Bring 2 sheets of notes and calculator to midterm. We will provide Scantron form. Homework:
Sampling and sampling distribution
 Sampling and sampling distribution September 12, 2017 STAT 101 Class 5 Slide 1 Outline of Topics 1 Sampling 2 Sampling distribution of a mean 3 Sampling distribution of a proportion STAT 101 Class 5 Slide
Characterization of the Optimum
 ECO 317 Economics of Uncertainty Fall Term 2009 Notes for lectures 5. Portfolio Allocation with One Riskless, One Risky Asset Characterization of the Optimum Consider a risk-averse, expected-utility-maximizing
Two Populations Hypothesis Testing
 Two Populations Hypothesis Testing Two Proportions (Large Independent Samples) Two samples are said to be independent if the data from the first sample is not connected to the data from the second sample.
The Normal Distribution
 Stat 6 Introduction to Business Statistics I Spring 009 Professor: Dr. Petrutza Caragea Section A Tuesdays and Thursdays 9:300:50 a.m. Chapter, Section.3 The Normal Distribution Density Curves So far we
Chapter 8 Estimation
 Chapter 8 Estimation There are two important forms of statistical inference: estimation (Confidence Intervals) Hypothesis Testing Statistical Inference drawing conclusions about populations based on samples
Chapter 7. Sampling Distributions
 Chapter 7 Sampling Distributions Section 7.1 Sampling Distributions and the Central Limit Theorem Sampling Distributions Sampling distribution The probability distribution of a sample statistic. Formed
ECON 214 Elements of Statistics for Economists
 ECON 214 Elements of Statistics for Economists Session 7 The Normal Distribution Part 1 Lecturer: Dr. Bernardin Senadza, Dept. of Economics Contact Information: bsenadza@ug.edu.gh College of Education
Contents. 1 Introduction. Math 321 Chapter 5 Confidence Intervals. 1 Introduction 1
 Math 321 Chapter 5 Confidence Intervals (draft version 2019/04/11-11:17:37) Contents 1 Introduction 1 2 Confidence interval for mean µ 2 2.1 Known variance................................. 2 2.2 Unknown
If the distribution of a random variable x is approximately normal, then
 Confidence Intervals for the Mean (σ unknown) In many real life situations, the standard deviation is unknown. In order to construct a confidence interval for a random variable that is normally distributed
Biostatistics and Design of Experiments Prof. Mukesh Doble Department of Biotechnology Indian Institute of Technology, Madras
 Biostatistics and Design of Experiments Prof. Mukesh Doble Department of Biotechnology Indian Institute of Technology, Madras Lecture - 05 Normal Distribution So far we have looked at discrete distributions
Confidence Intervals for an Exponential Lifetime Percentile
 Chapter 407 Confidence Intervals for an Exponential Lifetime Percentile Introduction This routine calculates the number of events needed to obtain a specified width of a confidence interval for a percentile
The Binomial Distribution
 The Binomial Distribution January 31, 2019 Contents The Binomial Distribution The Normal Approximation to the Binomial The Binomial Hypothesis Test Computing Binomial Probabilities in R 30 Problems The
Discrete Random Variables
 Discrete Random Variables In this chapter, we introduce a new concept that of a random variable or RV. A random variable is a model to help us describe the state of the world around us. Roughly, a RV can
Estimation and Confidence Intervals
 Estimation and Confidence Intervals Chapter 9 McGraw-Hill/Irwin Copyright 2010 by The McGraw-Hill Companies, Inc. All rights reserved. GOALS 1. Define a point estimate. 2. Define level of confidence. 3.
One sample z-test and t-test
 One sample z-test and t-test January 30, 2017 psych10.stanford.edu Announcements / Action Items Install ISI package (instructions in Getting Started with R) Assessment Problem Set #3 due Tu 1/31 at 7 PM
Chapter 6 Confidence Intervals
 Chapter 6 Confidence Intervals Section 6-1 Confidence Intervals for the Mean (Large Samples) VOCABULARY: Point Estimate A value for a parameter. The most point estimate of the population parameter is the
A Single Population Mean using the Student t Distribution
 OpenStax-CNX module: m47001 1 A Single Population Mean using the Student t Distribution OpenStax College This work is produced by OpenStax-CNX and licensed under the Creative Commons Attribution License
Top Incorrect Problems
 What is the z-score for scores in the bottom 5%? a) -1.645 b) 1.645 c).4801 d) The score is not listed in the table. A professor grades 120 research papers and reports that the average score was an 80%.
Chapter 7 presents the beginning of inferential statistics. The two major activities of inferential statistics are
 Chapter 7 presents the beginning of inferential statistics. Concept: Inferential Statistics The two major activities of inferential statistics are 1 to use sample data to estimate values of population
Chapter 5. Statistical inference for Parametric Models
 Chapter 5. Statistical inference for Parametric Models Outline Overview Parameter estimation Method of moments How good are method of moments estimates? Interval estimation Statistical Inference for Parametric
Normal Probability Distributions
 Normal Probability Distributions Properties of Normal Distributions The most important probability distribution in statistics is the normal distribution. Normal curve A normal distribution is a continuous
Section 7-2 Estimating a Population Proportion
 Section 7- Estimating a Population Proportion 1 Key Concept In this section we present methods for using a sample proportion to estimate the value of a population proportion. The sample proportion is the
Statistics and Probability
 Statistics and Probability Continuous RVs (Normal); Confidence Intervals Outline Continuous random variables Normal distribution CLT Point estimation Confidence intervals http://www.isrec.isb-sib.ch/~darlene/geneve/