Lecture 2. Probability Distributions Theophanis Tsandilas
|
|
|
- Bethanie Snow
- 5 years ago
- Views:
Transcription

1 Lecture 2 Probability Distributions Theophanis Tsandilas
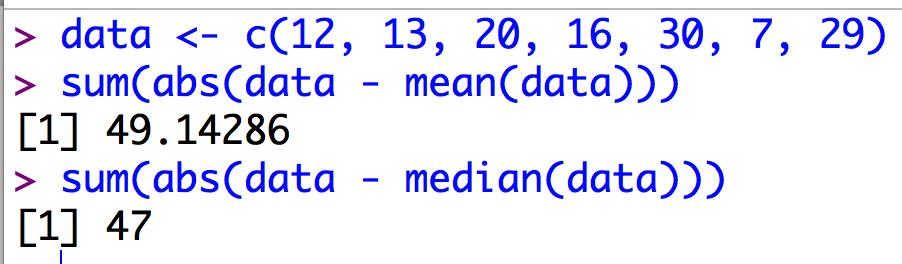
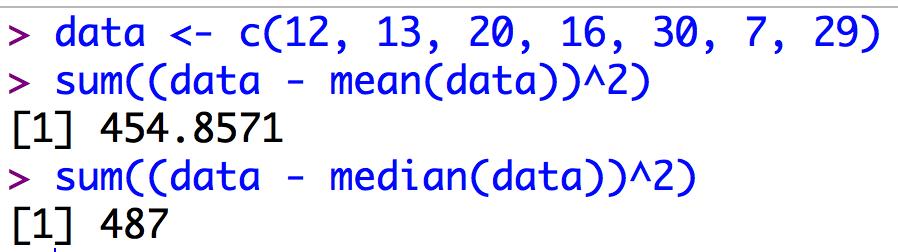
2 Comment on measures of dispersion Why do common measures of dispersion (variance and standard deviation) use sums of squares: nx (x i ˆµ) 2 i=1 instead of sums of absolute residuals: nx i=1 x i ˆµ
3 Comment on measures of dispersion Working with absolute values can be difficult, but this is not the main reason. The measure of central tendency that minimizes the sums of absolute differences is the median, not the mean. And since the mean is the prevalent measure of central tendency, we commonly use sums of squares. However, for statistical methods that rely on medians, sums of absolute differences can be more appropriate.

4 R code
5 What is a probability distribution? Consider the population of all possible outcomes when throwing two dice. How probable is each sum S of counts from the two dice? The probability distribution provides the probability of occurrence of all possible outcomes in an experiment
6 Probability distribution of a population It is generally not known. However, we may have sufficient information about this distribution to meet the goals of our research. Statistical modeling: It is possible to rely on a small set of probability distributions that capture the key characteristics of a population. We can then infer the parameters of these model probability distributions from our sample. Why? We expect that the sample contains some information about the population from which it was sampled.

7 Example distributions Height: Women vs. Men

8 Example distributions US Income distribution (older than 2013)

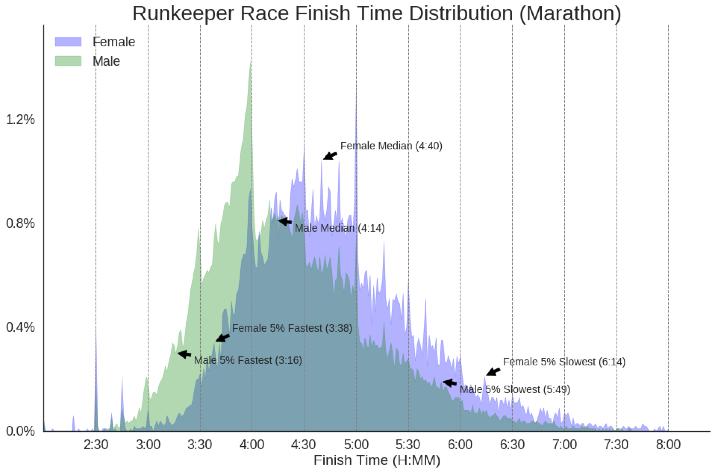
9 Example distributions Half Marathon and Marathon race finish time Source:
10 Example distributions Distribution of most frequent English words
11 Discrete probability distributions The population (and hence its samples) contain discrete values, either finite or infinite in number e.g., {-3, 1, 0, 1, 2}, { blue, brown, green }, or {1, 2, 3,...} The probability of a value x in a population can be expressed as a function: f(x) = p(x = x) (the probability of random variable X taking value x) The function f(x) is called a probability mass function (pmf)
12 Discrete probability distributions This is a discrete probability distribution
13 Discrete probability distributions Probabilities should sum to 1: X f(x) =1 x2s The expected value (or mean): E(x) = X x2s f(x)x = =7 The mode is the most frequent value: which one? The median is the middle value: which one?
14 Symmetrical probability distributions When the mean coincides with the median The above is a symmetrical, unimode distribution
15 The binomial distribution Consider a population containing two values: 1 and 0 Let s set the probability of 1 to Pr(1) =.75 and the probability of 0 to Pr(0) =.25. A single sample (n = 1) from such a population is known as a Bernoulli trial. a coin flipping trial with a fair coin is a Bernoulli trial with Pr(Head) =.5 and Pr(Tail) =.5 If we perform n independent Bernoulli trials, their outcomes will follow a binomial distribution.
16 The binomial distribution If a random variable X has a binomial distribution, we write: X B(n, P ) where n and P are the parameters of the distribution: n is the number of Bernoulli trials P is the chance (probability) of success If we know n and P, we can fully describe the distribution
17 The binomial distribution Probability Mass Function (pmf) n f(x; n, P )= P x (1 P ) n x x The probability of exactly n - x failures The probability of exactly x successes The number of possible ways that n Bernoulli trails lead to x successes
18 The binomial distribution Consider the distribution of errors for 10 trials, when for each trial, errors occur with a probability of 40%
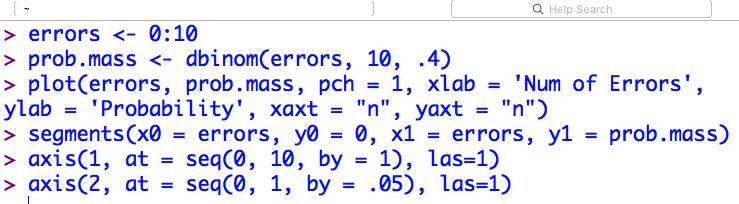
19 R code
20 The binomial distribution Cumulative Distribution Function (cdf)
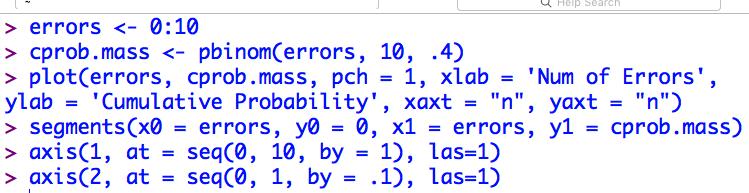
21 R code
22 Continuous distributions Not restricted to specific values. They can take any value between the lower and upper bound of a population (of course, populations can be unbounded).
 likelihood that a random variable X takes the value x. Pr( 1 apple X apple1)= Z 1 1 f(x)dx =1")
23 Continuous distributions The probability of any particular value is zero. Probabilities can only be obtained for intervals (i.e., a range of values): Z b Pr(a apple X apple b) = f(x)dx a where f(x) is the probability density function (pdf). It provides the relative (rather than absolute) likelihood that a random variable X takes the value x. Pr( 1 apple X apple1)= Z 1 1 f(x)dx =1

24 Continuous distributions Mode: value of highest peak Median: value that divides the area exactly in half Mean: µ = Z 1 1 xf(x)dx
25 The normal distribution Also known as the Gaussian distribution
26 The normal distribution Symmetrical, unimodal and continuous Can be derived as a sum of an infinite number of independent random variables Thus, it is appropriate when data arise from a process that involves adding together the contributions from a large number of independent, random events.
27 Example The human height can be considered as the outcome of many independent random genetic and environmental influences
28 Normal distribution parameters A normal distribution can be fully described by two only parameters: its mean μ and its variance σ 2 A normally distributed variable X can be written as X N(µ, 2 ) Its probability density function (pdf) is as follows: f(x; µ, 2 )= 1 p e (x µ2 )
29 Example The following normal distribution has mean μ = 100 and a standard deviation σ = 15
30 Standard normal distribution It is the normal distribution with a mean equal to 0 and a standard deviation (also variance) equal to 1: z N(0, 1) The standard normal distribution is often abbreviated to z. It is frequently used to simplify working with normal distributions.
31 Standard normal distribution
32 Reading a normal distribution
33 Sampling distribution of a statistic It is the distribution obtained by calculating the statistic (e.g. the mean) from an infinite number of independent samples of size n
34 Example An experiment measures the time it takes n = 10 people to visually locate a target on a computer screen. The same experiment is repeated a large (or infinite) number of times, where each time, we draw a new sample of size n. For each experiment, we compute the mean time: Experiment 1: M = 11.4 s Experiment 2: M = 12.6 s Experiment 3: M = 10.2 s... What s the distribution of these mean values?
35 Sampling distribution of a statistic Such distributions are interesting as they determine the probability of observing a particular value of the statistic, e.g., the mean. It is often very different than the distribution of the data used to calculate the statistic. distribution of the data sampling distribution of their means
36 Sampling distribution of the mean Its mean value is also the mean (expected value) of the original population the samples were drawn from Its standard deviation (SD) is known as the standard error of the mean (SEM)
37 The central limit theorem (CLT) States that the sampling distribution of a statistic approaches the normal distribution as n approaches infinity. It applies to statistics computed by summing or averaging quantities (means, variances) but not to standard deviations (squared root of an average)
38 The central limit theorem (CLT) States that the sampling distribution of a statistic approaches the normal distribution as n approaches infinity. It applies to statistics computed by summing or averaging quantities (means, variances) but not to standard deviations (squared root of an average) central = fundamental to probabilities and statistics limit = refers to a limit condition n!1
39 Practical importance of the CLT If the size of the sample is sufficiently large, then the sampling distribution of the statistic will be approximately normal (no matter what the distribution of the original population was) But which sample size is sufficiently large?
40 Sampling from normal distributions If the original population is normal, then the CLT will always hold, even if the sample size is as low as n = 1 The further the original population moves away from a normal distribution, the larger the sample size n should be
41 Sampling from binomial distributions Statistic of interest: Count of successes from n Bernoulli trials Frequency Frequency Frequency n = 10, P = n = 30, P = n = 100, P =.15 Frequency Frequency Frequency n = 10, P = n = 30, P = n = 100, P =.35
42 R code
43 Sampling from exponential distributions dexp(x) Distribution of source population Statistic of interest: Mean of a sample of n drawn from an exponential distribution Sampling distributions of the mean Frequency Frequency Frequency n= n= n=100
44 R code
45 What n is sufficiently large? Several textbooks claim that n = 30 is enough to assume that a sampling distribution is normal, irrespective of the shape of the source distribution. «This is untrue» [Baguley] There is no magic number to guarantee that.
46 Log-normal distribution A random variable X is log-normally distributed if the logarithm of X is normally distributed: X LogN(µ, 2 ) () ln(x) N(µ, 2 )
47 Simple math with logarithms log b (x) =a () b a = x log b (1) = 0 () b 0 =1 log b (b) =1() b 1 = b If the base of the logarithm is equal to the Euler number e = , we write: ln(x) =log e (x) Which we base to use is not important, but it is common to use e as a base. 47
48 Log-normal distribution A common choice for real-world data bounded by zero e.g., response time or task-completion time «The reasons governing frequency distributions in nature usually favor the log-normal, whereas people are in favor of the normal» «For small coefficients of variation, normal and log-normal distribution both fit well.» [ Limpert et al ]
49 Sampling from lognormal distributions dlnorm(x, meanlog = 0, sdlog = 1) Distribution of source population µ =0, = Sampling distributions of the mean Frequency Frequency Frequency n= n= n=100
50 Sampling from lognormal distributions Before... Sampling distributions of the mean Frequency Frequency Frequency n=10...and after applying a log transformation on the data n=30 n=100 Frequency Frequency Frequency n= n= n=100
51 R code
52 Skewed distributions Asymmetrical distributions are said to be skewed
53 The chi-square (χ 2 ) distribution Consider a squared observation z 2 drawn at random from the standard normal (z) distribution The distribution of z 2 will follow a χ 2 distribution with 1 degree of freedom (df)
54 The chi-square (χ 2 ) distribution Consider a squared observation z 2 drawn at random from the standard normal (z) distribution The distribution of z 2 will follow a χ 2 distribution with 1 degree of freedom (df) Probability density Probability density Z Z 2
55 The chi-square (χ 2 ) distribution A χ 2 distribution with k degrees of freedom is the distribution of a sum of squares of k independent variables that follow a standard normal distribution Q = kx Zi 2 =) Q i=1 2 (k)
56 The chi-square (χ 2 ) distribution Given the link between variances and sums of squares, the chi-square distribution is useful for modeling variances of samples from normal (or approximately normal) distributions.
57 The t distribution (Student s t) The sampling distribution of means for a normally distributed population Useful when: the sample size is small, and the population standard deviation is unknown published by William Gosset (1908) under the pseudonym «Student»
58 The t distribution (Student s t) When the population standard deviation σ is unknown and is estimated from the unbiased variance estimate: ˆ2 = np (x i ˆµ) i=1 n 1 then, the resulting standardized sample mean has a t distribution with ν = n - 1 degrees of freedom. Note: We ll further explain this later.
59 The t distribution (Student s t) A random variable X following a t distribution is denoted as: X t( ) Probability density t z Probability density t z t(1) t(29)
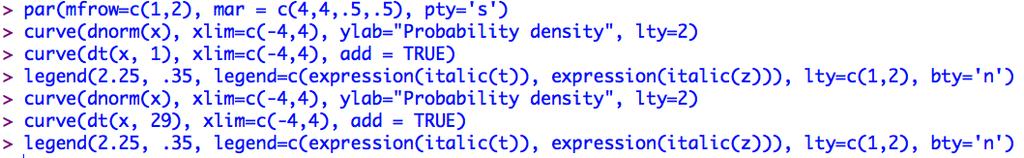
60 R code
61 R distribution functions Binomial distribution dbinom(x, n, P) Provides the probability mass function for the binomial distribution B(n,P) Examples: dbinom(4, 20,.2): It will return the probability of x = 4 successes for n = 20 Bernoulli trials with a P=.2 probability of success. dbinom(c(1,2,3,4), 10,.2): It will return a vector with the probabilities of x = {1, 2, 3, 4} successes for n =10 Bernoulli trials with a P =.2 probability of success.
62 R distribution functions Binomial distribution pbinom(x, n, P) Provides the cumulative probability mass function for the binomial distribution B(n,P) Example: pbinom(4, 20,.2): It will return the cumulative probability up to x = 4 successes for n = 20 Bernoulli trials with a P =.2 probability of success.
63 R distribution functions Binomial distribution rbinom(size, n, P) It will generate a random sample of size size from the binomial distribution B(n,P) Example: rbinom(10, 20,.2): It will return a random sample of size = 10 from the binomial distribution B(n = 20, P =.2)
64 R distribution functions Normal distribution dnorm(x, mean, sd) Provides the probability density function for the normal distribution with a mean value equal to mean and a standard deviation equal to sd. Examples: dnorm(.2, 0, 1): It will return the relative likelihood of the value x =.2, for the standard normal distribution. curve(dnorm(x, 100, 15), xlim = c(60, 140)): It will plot the probability density function from x = 60 to x = 140 for the normal distribution with mean = 100 and sd = 15.
65 R distribution functions Normal distribution pnorm(x, mean, sd) Provides the cumulative probability density function for the normal distribution with a mean value equal to mean and a standard deviation equal to sd. Example: pnorm(100, 100, 15): It will return the cumulative probability up to x = 100 for the normal distribution with mean = 100 and sd = 15. (What do you expect it to be?)
66 R distribution functions Normal distribution rnorm(size, mean, sd) It will generate a random sample of size size from the normal distribution with a mean value equal to mean and a standard deviation equal to sd. Example: rnorm(10, 0, 1): It will return a random sample of size = 10 from the standard normal distribution.
67 R distribution functions Binomial Normal Log-normal chi-squared Student Distribution function (pmf or cdf) Cumulative distr. function Random sampling dbinom(x, n, P) pbinom(x, n, P) rbinom(size, n, P) dnorm(x, mean, sd) dlnorm(x, mean, sd) pnorm(x, mean, sd) rnorm(size, mean, sd) plnorm(x, mean, sd) rlnorm(size, mean, sd) dchisq(x, k) pchisq(x, k) rchisq(size, k) dt(x, ν) pt(x, ν) rt(size, ν)
68 Intro to Confidence Intervals
69 Statistical inference The process of deducing the parameters of an underlying probability distribution from a sample Four broad types: point estimation interval estimation hypothesis testing prediction
70 Point estimates How much informative is the following graph? Mean Time (s) T1 T2 T3 Techniques
71 Point estimates A point estimate can be thought of as a «best guess» of the true population parameter Descriptive statistics such a the sample mean or the median are examples of point estimates Question: What are the point estimates of a population s variance and standard deviation?
72 Point estimates How much informative is the following graph? Mean Time (s) T1 T2 T3 Techniques A point estimate communicates no information about the uncertainty or quality of the estimate it provides
73 Interval estimate An interval estimate does not provide an exact value, but rather a range of values that the parameter might plausibly take. Most common method: constructing a confidence interval (CI)
74 Confidence interval (CI) It specify a range of values that is expected to contain the true parameter value (but it may not) true value It is associated with a confidence level, usually expressed as a percentage e.g., 95% CI or 99% CI
75 Formal interpretation of CIs Classical frequentists statistics view a probability as a statement about the frequency with which events occur in the long run. Of the many 95% CIs that might be constructed, 95% are expected to contain the true population parameter. The other 5% may completely fail!
76 Informal interpretation of CIs Formally speaking, a CI does not specify a probability range! A 95% CI does not necessarily contain the true population parameter with a 95% probability (or 95% confidence). However, it is often reasonable to treat a CI as an expression of confidence or belief that it does contain the true value. See [Baguley] and [Cumming and Finch, 2005] Attention: This view is not shared by everyone! It has received a lot of criticism by Bayesian statisticians.
77 Confidence level A 100% CI will include the whole range of possible values A 0% CI reduces to a point estimate A 95% CI is the most common choice (by tradition)
78 alpha If C is the confidence level of a CI, then: C = 100 (1 - α) where α (or alpha) represents the number of times that a C% CI is expected to fail: If C = 95, the α =.05
79 Structure of a confidence interval It is defined by two points that form its limits, i.e., its lower and upper bounds It can be symmetrical, where the point estimate lies in the center of the CI...or asymmetrical, where the point estimate is not at the center of the CI
80 Symmetrical CIs The intervals can be described by the point estimate plus or minus half of the interval, e.g., 165 ± 6 cm This half width of the interval is known as the margin of error (MOE)
81 Width of a CI Depends on the confidence level e.g., 99% CIs are wider than 95% CIs Also depends on the sampling distribution of the statistic The smaller the sample size, the wider the sampling distribution Small samples produce wide CIs
82 Example Consider the sampling distribution of the mean for a normally distributed population (M = 100, SD = 10) Frequency Frequency Frequency n= n= n=100 The sampling distribution becomes narrower as more samples are added.
83 In the following lecture, we will revisit confidence intervals and explain one can construct them. 83
Unit 5: Sampling Distributions of Statistics
 Unit 5: Sampling Distributions of Statistics Statistics 571: Statistical Methods Ramón V. León 6/12/2004 Unit 5 - Stat 571 - Ramon V. Leon 1 Definitions and Key Concepts A sample statistic used to estimate
Unit 5: Sampling Distributions of Statistics
 Unit 5: Sampling Distributions of Statistics Statistics 571: Statistical Methods Ramón V. León 6/12/2004 Unit 5 - Stat 571 - Ramon V. Leon 1 Definitions and Key Concepts A sample statistic used to estimate
Part V - Chance Variability
 Part V - Chance Variability Dr. Joseph Brennan Math 148, BU Dr. Joseph Brennan (Math 148, BU) Part V - Chance Variability 1 / 78 Law of Averages In Chapter 13 we discussed the Kerrich coin-tossing experiment.
2011 Pearson Education, Inc
 Statistics for Business and Economics Chapter 4 Random Variables & Probability Distributions Content 1. Two Types of Random Variables 2. Probability Distributions for Discrete Random Variables 3. The Binomial
Statistics and Probability
 Statistics and Probability Continuous RVs (Normal); Confidence Intervals Outline Continuous random variables Normal distribution CLT Point estimation Confidence intervals http://www.isrec.isb-sib.ch/~darlene/geneve/
MATH 3200 Exam 3 Dr. Syring
 . Suppose n eligible voters are polled (randomly sampled) from a population of size N. The poll asks voters whether they support or do not support increasing local taxes to fund public parks. Let M be
Confidence Intervals Introduction
 Confidence Intervals Introduction A point estimate provides no information about the precision and reliability of estimation. For example, the sample mean X is a point estimate of the population mean μ
Lecture Data Science
 Web Science & Technologies University of Koblenz Landau, Germany Lecture Data Science Statistics Foundations JProf. Dr. Claudia Wagner Learning Goals How to describe sample data? What is mode/median/mean?
Statistical Intervals (One sample) (Chs )
 (Chs )") 7 Statistical Intervals (One sample) (Chs 8.1-8.3) Confidence Intervals The CLT tells us that as the sample size n increases, the sample mean X is close to normally distributed with expected value µ and
7 Statistical Intervals (One sample) (Chs 8.1-8.3) Confidence Intervals The CLT tells us that as the sample size n increases, the sample mean X is close to normally distributed with expected value µ and
Week 1 Variables: Exploration, Familiarisation and Description. Descriptive Statistics.
 Week 1 Variables: Exploration, Familiarisation and Description. Descriptive Statistics. Convergent validity: the degree to which results/evidence from different tests/sources, converge on the same conclusion.
The normal distribution is a theoretical model derived mathematically and not empirically.
 Sociology 541 The Normal Distribution Probability and An Introduction to Inferential Statistics Normal Approximation The normal distribution is a theoretical model derived mathematically and not empirically.
ME3620. Theory of Engineering Experimentation. Spring Chapter III. Random Variables and Probability Distributions.
 ME3620 Theory of Engineering Experimentation Chapter III. Random Variables and Probability Distributions Chapter III 1 3.2 Random Variables In an experiment, a measurement is usually denoted by a variable
Probability. An intro for calculus students P= Figure 1: A normal integral
 Probability An intro for calculus students.8.6.4.2 P=.87 2 3 4 Figure : A normal integral Suppose we flip a coin 2 times; what is the probability that we get more than 2 heads? Suppose we roll a six-sided
Exam 2 Spring 2015 Statistics for Applications 4/9/2015
 18.443 Exam 2 Spring 2015 Statistics for Applications 4/9/2015 1. True or False (and state why). (a). The significance level of a statistical test is not equal to the probability that the null hypothesis
Business Statistics 41000: Probability 3
 Business Statistics 41000: Probability 3 Drew D. Creal University of Chicago, Booth School of Business February 7 and 8, 2014 1 Class information Drew D. Creal Email: dcreal@chicagobooth.edu Office: 404
Statistical Intervals. Chapter 7 Stat 4570/5570 Material from Devore s book (Ed 8), and Cengage
, and Cengage") 7 Statistical Intervals Chapter 7 Stat 4570/5570 Material from Devore s book (Ed 8), and Cengage Confidence Intervals The CLT tells us that as the sample size n increases, the sample mean X is close to
7 Statistical Intervals Chapter 7 Stat 4570/5570 Material from Devore s book (Ed 8), and Cengage Confidence Intervals The CLT tells us that as the sample size n increases, the sample mean X is close to
It is common in the field of mathematics, for example, geometry, to have theorems or postulates
 CHAPTER 5 POPULATION DISTRIBUTIONS It is common in the field of mathematics, for example, geometry, to have theorems or postulates that establish guiding principles for understanding analysis of data.
درس هفتم یادگیري ماشین. (Machine Learning) دانشگاه فردوسی مشهد دانشکده مهندسی رضا منصفی
 دانشگاه فردوسی مشهد دانشکده مهندسی رضا منصفی") یادگیري ماشین توزیع هاي نمونه و تخمین نقطه اي پارامترها Sampling Distributions and Point Estimation of Parameter (Machine Learning) دانشگاه فردوسی مشهد دانشکده مهندسی رضا منصفی درس هفتم 1 Outline Introduction
یادگیري ماشین توزیع هاي نمونه و تخمین نقطه اي پارامترها Sampling Distributions and Point Estimation of Parameter (Machine Learning) دانشگاه فردوسی مشهد دانشکده مهندسی رضا منصفی درس هفتم 1 Outline Introduction
Chapter 7 Sampling Distributions and Point Estimation of Parameters
 Chapter 7 Sampling Distributions and Point Estimation of Parameters Part 1: Sampling Distributions, the Central Limit Theorem, Point Estimation & Estimators Sections 7-1 to 7-2 1 / 25 Statistical Inferences
Probability and distributions
 2 Probability and distributions The concepts of randomness and probability are central to statistics. It is an empirical fact that most experiments and investigations are not perfectly reproducible. The
BIO5312 Biostatistics Lecture 5: Estimations
 BIO5312 Biostatistics Lecture 5: Estimations Yujin Chung September 27th, 2016 Fall 2016 Yujin Chung Lec5: Estimations Fall 2016 1/34 Recap Yujin Chung Lec5: Estimations Fall 2016 2/34 Today s lecture and
4. Basic distributions with R
 4. Basic distributions with R CA200 (based on the book by Prof. Jane M. Horgan) 1 Discrete distributions: Binomial distribution Def: Conditions: 1. An experiment consists of n repeated trials 2. Each trial
Random Variables Handout. Xavier Vilà
 Random Variables Handout Xavier Vilà Course 2004-2005 1 Discrete Random Variables. 1.1 Introduction 1.1.1 Definition of Random Variable A random variable X is a function that maps each possible outcome
Section 7.5 The Normal Distribution. Section 7.6 Application of the Normal Distribution
 Section 7.6 Application of the Normal Distribution A random variable that may take on infinitely many values is called a continuous random variable. A continuous probability distribution is defined by
The topics in this section are related and necessary topics for both course objectives.
 2.5 Probability Distributions The topics in this section are related and necessary topics for both course objectives. A probability distribution indicates how the probabilities are distributed for outcomes
Describing Uncertain Variables
 Describing Uncertain Variables L7 Uncertainty in Variables Uncertainty in concepts and models Uncertainty in variables Lack of precision Lack of knowledge Variability in space/time Describing Uncertainty
Hypothesis Tests: One Sample Mean Cal State Northridge Ψ320 Andrew Ainsworth PhD
 Hypothesis Tests: One Sample Mean Cal State Northridge Ψ320 Andrew Ainsworth PhD MAJOR POINTS Sampling distribution of the mean revisited Testing hypotheses: sigma known An example Testing hypotheses:
1. Covariance between two variables X and Y is denoted by Cov(X, Y) and defined by. Cov(X, Y ) = E(X E(X))(Y E(Y ))
 and defined by. Cov(X, Y ) = E(X E(X))(Y E(Y ))") Correlation & Estimation - Class 7 January 28, 2014 Debdeep Pati Association between two variables 1. Covariance between two variables X and Y is denoted by Cov(X, Y) and defined by Cov(X, Y ) = E(X E(X))(Y
Correlation & Estimation - Class 7 January 28, 2014 Debdeep Pati Association between two variables 1. Covariance between two variables X and Y is denoted by Cov(X, Y) and defined by Cov(X, Y ) = E(X E(X))(Y
Interval estimation. September 29, Outline Basic ideas Sampling variation and CLT Interval estimation using X More general problems
 Interval estimation September 29, 2017 STAT 151 Class 7 Slide 1 Outline of Topics 1 Basic ideas 2 Sampling variation and CLT 3 Interval estimation using X 4 More general problems STAT 151 Class 7 Slide
The Bernoulli distribution
 This work is licensed under a Creative Commons Attribution-NonCommercial-ShareAlike License. Your use of this material constitutes acceptance of that license and the conditions of use of materials on this
Normal distribution Approximating binomial distribution by normal 2.10 Central Limit Theorem
 1.1.2 Normal distribution 1.1.3 Approimating binomial distribution by normal 2.1 Central Limit Theorem Prof. Tesler Math 283 Fall 216 Prof. Tesler 1.1.2-3, 2.1 Normal distribution Math 283 / Fall 216 1
Business Statistics 41000: Probability 4
 Business Statistics 41000: Probability 4 Drew D. Creal University of Chicago, Booth School of Business February 14 and 15, 2014 1 Class information Drew D. Creal Email: dcreal@chicagobooth.edu Office:
Version A. Problem 1. Let X be the continuous random variable defined by the following pdf: 1 x/2 when 0 x 2, f(x) = 0 otherwise.
 = 0 otherwise.") Math 224 Q Exam 3A Fall 217 Tues Dec 12 Version A Problem 1. Let X be the continuous random variable defined by the following pdf: { 1 x/2 when x 2, f(x) otherwise. (a) Compute the mean µ E[X]. E[X] x
Math 224 Q Exam 3A Fall 217 Tues Dec 12 Version A Problem 1. Let X be the continuous random variable defined by the following pdf: { 1 x/2 when x 2, f(x) otherwise. (a) Compute the mean µ E[X]. E[X] x
Lecture 5: Fundamentals of Statistical Analysis and Distributions Derived from Normal Distributions
 Lecture 5: Fundamentals of Statistical Analysis and Distributions Derived from Normal Distributions ELE 525: Random Processes in Information Systems Hisashi Kobayashi Department of Electrical Engineering
Web Science & Technologies University of Koblenz Landau, Germany. Lecture Data Science. Statistics and Probabilities JProf. Dr.
 Web Science & Technologies University of Koblenz Landau, Germany Lecture Data Science Statistics and Probabilities JProf. Dr. Claudia Wagner Data Science Open Position @GESIS Student Assistant Job in Data
Chapter 5. Statistical inference for Parametric Models
 Chapter 5. Statistical inference for Parametric Models Outline Overview Parameter estimation Method of moments How good are method of moments estimates? Interval estimation Statistical Inference for Parametric
CS 237: Probability in Computing
 CS 237: Probability in Computing Wayne Snyder Computer Science Department Boston University Lecture 12: Continuous Distributions Uniform Distribution Normal Distribution (motivation) Discrete vs Continuous
MAS1403. Quantitative Methods for Business Management. Semester 1, Module leader: Dr. David Walshaw
 MAS1403 Quantitative Methods for Business Management Semester 1, 2018 2019 Module leader: Dr. David Walshaw Additional lecturers: Dr. James Waldren and Dr. Stuart Hall Announcements: Written assignment
continuous rv Note for a legitimate pdf, we have f (x) 0 and f (x)dx = 1. For a continuous rv, P(X = c) = c f (x)dx = 0, hence
 0 and f (x)dx = 1. For a continuous rv, P(X = c) = c f (x)dx = 0, hence") continuous rv Let X be a continuous rv. Then a probability distribution or probability density function (pdf) of X is a function f(x) such that for any two numbers a and b with a b, P(a X b) = b a f (x)dx.
continuous rv Let X be a continuous rv. Then a probability distribution or probability density function (pdf) of X is a function f(x) such that for any two numbers a and b with a b, P(a X b) = b a f (x)dx.
Binomial and Normal Distributions
 Binomial and Normal Distributions Bernoulli Trials A Bernoulli trial is a random experiment with 2 special properties: The result of a Bernoulli trial is binary. Examples: Heads vs. Tails, Healthy vs.
Theoretical Foundations
 Theoretical Foundations Probabilities Monia Ranalli monia.ranalli@uniroma2.it Ranalli M. Theoretical Foundations - Probabilities 1 / 27 Objectives understand the probability basics quantify random phenomena
4.3 Normal distribution
 43 Normal distribution Prof Tesler Math 186 Winter 216 Prof Tesler 43 Normal distribution Math 186 / Winter 216 1 / 4 Normal distribution aka Bell curve and Gaussian distribution The normal distribution
Chapter 4: Commonly Used Distributions. Statistics for Engineers and Scientists Fourth Edition William Navidi
 Chapter 4: Commonly Used Distributions Statistics for Engineers and Scientists Fourth Edition William Navidi 2014 by Education. This is proprietary material solely for authorized instructor use. Not authorized
χ 2 distributions and confidence intervals for population variance
 χ 2 distributions and confidence intervals for population variance Let Z be a standard Normal random variable, i.e., Z N(0, 1). Define Y = Z 2. Y is a non-negative random variable. Its distribution is
ECON 214 Elements of Statistics for Economists 2016/2017
 ECON 214 Elements of Statistics for Economists 2016/2017 Topic The Normal Distribution Lecturer: Dr. Bernardin Senadza, Dept. of Economics bsenadza@ug.edu.gh College of Education School of Continuing and
Statistics (This summary is for chapters 17, 28, 29 and section G of chapter 19)
") Statistics (This summary is for chapters 17, 28, 29 and section G of chapter 19) Mean, Median, Mode Mode: most common value Median: middle value (when the values are in order) Mean = total how many = x
Statistics (This summary is for chapters 17, 28, 29 and section G of chapter 19) Mean, Median, Mode Mode: most common value Median: middle value (when the values are in order) Mean = total how many = x
Review for Final Exam Spring 2014 Jeremy Orloff and Jonathan Bloom
 Review for Final Exam 18.05 Spring 2014 Jeremy Orloff and Jonathan Bloom THANK YOU!!!! JON!! PETER!! RUTHI!! ERIKA!! ALL OF YOU!!!! Probability Counting Sets Inclusion-exclusion principle Rule of product
Introduction to Probability and Inference HSSP Summer 2017, Instructor: Alexandra Ding July 19, 2017
 Introduction to Probability and Inference HSSP Summer 2017, Instructor: Alexandra Ding July 19, 2017 Please fill out the attendance sheet! Suggestions Box: Feedback and suggestions are important to the
Statistics for Business and Economics
 Statistics for Business and Economics Chapter 5 Continuous Random Variables and Probability Distributions Ch. 5-1 Probability Distributions Probability Distributions Ch. 4 Discrete Continuous Ch. 5 Probability
Commonly Used Distributions
 Chapter 4: Commonly Used Distributions 1 Introduction Statistical inference involves drawing a sample from a population and analyzing the sample data to learn about the population. We often have some knowledge
Random variables. Contents
 Random variables Contents 1 Random Variable 2 1.1 Discrete Random Variable............................ 3 1.2 Continuous Random Variable........................... 5 1.3 Measures of Location...............................
Point Estimation. Some General Concepts of Point Estimation. Example. Estimator quality
 Point Estimation Some General Concepts of Point Estimation Statistical inference = conclusions about parameters Parameters == population characteristics A point estimate of a parameter is a value (based
Simple Random Sampling. Sampling Distribution
 STAT 503 Sampling Distribution and Statistical Estimation 1 Simple Random Sampling Simple random sampling selects with equal chance from (available) members of population. The resulting sample is a simple
Chapter 6: Random Variables and Probability Distributions
 Chapter 6: Random Variables and Distributions These notes reflect material from our text, Statistics, Learning from Data, First Edition, by Roxy Pec, published by CENGAGE Learning, 2015. Random variables
Confidence Intervals. σ unknown, small samples The t-statistic /22
 Confidence Intervals σ unknown, small samples The t-statistic 1 /22 Homework Read Sec 7-3. Discussion Question pg 365 Do Ex 7-3 1-4, 6, 9, 12, 14, 15, 17 2/22 Objective find the confidence interval for
STA258H5. Al Nosedal and Alison Weir. Winter Al Nosedal and Alison Weir STA258H5 Winter / 41
 STA258H5 Al Nosedal and Alison Weir Winter 2017 Al Nosedal and Alison Weir STA258H5 Winter 2017 1 / 41 NORMAL APPROXIMATION TO THE BINOMIAL DISTRIBUTION. Al Nosedal and Alison Weir STA258H5 Winter 2017
μ: ESTIMATES, CONFIDENCE INTERVALS, AND TESTS Business Statistics
 μ: ESTIMATES, CONFIDENCE INTERVALS, AND TESTS Business Statistics CONTENTS Estimating parameters The sampling distribution Confidence intervals for μ Hypothesis tests for μ The t-distribution Comparison
Probability and Random Variables A FINANCIAL TIMES COMPANY
 Probability Basics Probability and Random Variables A FINANCIAL TIMES COMPANY 2 Probability Probability of union P[A [ B] =P[A]+P[B] P[A \ B] Conditional Probability A B P[A B] = Bayes Theorem P[A \ B]
The Binomial Distribution
 The Binomial Distribution January 31, 2018 Contents The Binomial Distribution The Normal Approximation to the Binomial The Binomial Hypothesis Test Computing Binomial Probabilities in R 30 Problems The
Probability Theory and Simulation Methods. April 9th, Lecture 20: Special distributions
 April 9th, 2018 Lecture 20: Special distributions Week 1 Chapter 1: Axioms of probability Week 2 Chapter 3: Conditional probability and independence Week 4 Chapters 4, 6: Random variables Week 9 Chapter
The Binomial Distribution
 The Binomial Distribution January 31, 2019 Contents The Binomial Distribution The Normal Approximation to the Binomial The Binomial Hypothesis Test Computing Binomial Probabilities in R 30 Problems The
Central Limit Theorem, Joint Distributions Spring 2018
 Central Limit Theorem, Joint Distributions 18.5 Spring 218.5.4.3.2.1-4 -3-2 -1 1 2 3 4 Exam next Wednesday Exam 1 on Wednesday March 7, regular room and time. Designed for 1 hour. You will have the full
4 Random Variables and Distributions
 4 Random Variables and Distributions Random variables A random variable assigns each outcome in a sample space. e.g. called a realization of that variable to Note: We ll usually denote a random variable
INF FALL NATURAL LANGUAGE PROCESSING. Jan Tore Lønning, Lecture 3, 1.9
 INF5830 015 FALL NATURAL LANGUAGE PROCESSING Jan Tore Lønning, Lecture 3, 1.9 Today: More statistics Binomial distribution Continuous random variables/distributions Normal distribution Sampling and sampling
Simulation Wrap-up, Statistics COS 323
 Simulation Wrap-up, Statistics COS 323 Today Simulation Re-cap Statistics Variance and confidence intervals for simulations Simulation wrap-up FYI: No class or office hours Thursday Simulation wrap-up
Problems from 9th edition of Probability and Statistical Inference by Hogg, Tanis and Zimmerman:
 Math 224 Fall 207 Homework 5 Drew Armstrong Problems from 9th edition of Probability and Statistical Inference by Hogg, Tanis and Zimmerman: Section 3., Exercises 3, 0. Section 3.3, Exercises 2, 3, 0,.
Lecture 23. STAT 225 Introduction to Probability Models April 4, Whitney Huang Purdue University. Normal approximation to Binomial
 Lecture 23 STAT 225 Introduction to Probability Models April 4, 2014 approximation Whitney Huang Purdue University 23.1 Agenda 1 approximation 2 approximation 23.2 Characteristics of the random variable:
AMS 7 Sampling Distributions, Central limit theorem, Confidence Intervals Lecture 4
 AMS 7 Sampling Distributions, Central limit theorem, Confidence Intervals Lecture 4 Department of Applied Mathematics and Statistics, University of California, Santa Cruz Summer 2014 1 / 26 Sampling Distributions!!!!!!
BIOSTATISTICS TOPIC 5: SAMPLING DISTRIBUTION II THE NORMAL DISTRIBUTION
 BIOSTATISTICS TOPIC 5: SAMPLING DISTRIBUTION II THE NORMAL DISTRIBUTION The normal distribution occupies the central position in statistical theory and practice. The distribution is remarkable and of great
Chapter 8: Sampling distributions of estimators Sections
 Chapter 8 continued Chapter 8: Sampling distributions of estimators Sections 8.1 Sampling distribution of a statistic 8.2 The Chi-square distributions 8.3 Joint Distribution of the sample mean and sample
Chapter 4. The Normal Distribution
 Chapter 4 The Normal Distribution 1 Chapter 4 Overview Introduction 4-1 Normal Distributions 4-2 Applications of the Normal Distribution 4-3 The Central Limit Theorem 4-4 The Normal Approximation to the
Data Analysis. BCF106 Fundamentals of Cost Analysis
 Data Analysis BCF106 Fundamentals of Cost Analysis June 009 Chapter 5 Data Analysis 5.0 Introduction... 3 5.1 Terminology... 3 5. Measures of Central Tendency... 5 5.3 Measures of Dispersion... 7 5.4 Frequency
DESCRIBING DATA: MESURES OF LOCATION
 DESCRIBING DATA: MESURES OF LOCATION A. Measures of Central Tendency Measures of Central Tendency are used to pinpoint the center or average of a data set which can then be used to represent the typical
Statistical Tables Compiled by Alan J. Terry
 Statistical Tables Compiled by Alan J. Terry School of Science and Sport University of the West of Scotland Paisley, Scotland Contents Table 1: Cumulative binomial probabilities Page 1 Table 2: Cumulative
ECON 214 Elements of Statistics for Economists
 ECON 214 Elements of Statistics for Economists Session 7 The Normal Distribution Part 1 Lecturer: Dr. Bernardin Senadza, Dept. of Economics Contact Information: bsenadza@ug.edu.gh College of Education
Week 2 Quantitative Analysis of Financial Markets Hypothesis Testing and Confidence Intervals
 Week 2 Quantitative Analysis of Financial Markets Hypothesis Testing and Confidence Intervals Christopher Ting http://www.mysmu.edu/faculty/christophert/ Christopher Ting : christopherting@smu.edu.sg :
The Binomial Probability Distribution
 The Binomial Probability Distribution MATH 130, Elements of Statistics I J. Robert Buchanan Department of Mathematics Fall 2017 Objectives After this lesson we will be able to: determine whether a probability
Chapter 8 Estimation
 Chapter 8 Estimation There are two important forms of statistical inference: estimation (Confidence Intervals) Hypothesis Testing Statistical Inference drawing conclusions about populations based on samples
UNIVERSITY OF VICTORIA Midterm June 2014 Solutions
 UNIVERSITY OF VICTORIA Midterm June 04 Solutions NAME: STUDENT NUMBER: V00 Course Name & No. Inferential Statistics Economics 46 Section(s) A0 CRN: 375 Instructor: Betty Johnson Duration: hour 50 minutes
Learning Objectives for Ch. 7
 Chapter 7: Point and Interval Estimation Hildebrand, Ott and Gray Basic Statistical Ideas for Managers Second Edition 1 Learning Objectives for Ch. 7 Obtaining a point estimate of a population parameter
4: Probability. What is probability? Random variables (RVs)
") 4: Probability b binomial µ expected value [parameter] n number of trials [parameter] N normal p probability of success [parameter] pdf probability density function pmf probability mass function RV random
4: Probability b binomial µ expected value [parameter] n number of trials [parameter] N normal p probability of success [parameter] pdf probability density function pmf probability mass function RV random
INF FALL NATURAL LANGUAGE PROCESSING. Jan Tore Lønning, Lecture 3, 1.9
 1 INF5830 2015 FALL NATURAL LANGUAGE PROCESSING Jan Tore Lønning, Lecture 3, 1.9 Today: More statistics 2 Recap Probability distributions Categorical distributions Bernoulli trial Binomial distribution
Statistical Methods in Practice STAT/MATH 3379
 Statistical Methods in Practice STAT/MATH 3379 Dr. A. B. W. Manage Associate Professor of Mathematics & Statistics Department of Mathematics & Statistics Sam Houston State University Overview 6.1 Discrete
Chapter 5. Sampling Distributions
 Lecture notes, Lang Wu, UBC 1 Chapter 5. Sampling Distributions 5.1. Introduction In statistical inference, we attempt to estimate an unknown population characteristic, such as the population mean, µ,
Quantitative Methods for Economics, Finance and Management (A86050 F86050)
") Quantitative Methods for Economics, Finance and Management (A86050 F86050) Matteo Manera matteo.manera@unimib.it Marzio Galeotti marzio.galeotti@unimi.it 1 This material is taken and adapted from Guy Judge
Quantitative Methods for Economics, Finance and Management (A86050 F86050) Matteo Manera matteo.manera@unimib.it Marzio Galeotti marzio.galeotti@unimi.it 1 This material is taken and adapted from Guy Judge
STAT Chapter 7: Confidence Intervals
 STAT 515 -- Chapter 7: Confidence Intervals With a point estimate, we used a single number to estimate a parameter. We can also use a set of numbers to serve as reasonable estimates for the parameter.
. (i) What is the probability that X is at most 8.75? =.875
 What is the probability that X is at most 8.75? =.875") Worksheet 1 Prep-Work (Distributions) 1)Let X be the random variable whose c.d.f. is given below. F X 0 0.3 ( x) 0.5 0.8 1.0 if if if if if x 5 5 x 10 10 x 15 15 x 0 0 x Compute the mean, X. (Hint: First
Worksheet 1 Prep-Work (Distributions) 1)Let X be the random variable whose c.d.f. is given below. F X 0 0.3 ( x) 0.5 0.8 1.0 if if if if if x 5 5 x 10 10 x 15 15 x 0 0 x Compute the mean, X. (Hint: First
Normal Probability Distributions
 Normal Probability Distributions Properties of Normal Distributions The most important probability distribution in statistics is the normal distribution. Normal curve A normal distribution is a continuous
PROBABILITY DISTRIBUTIONS
 CHAPTER 3 PROBABILITY DISTRIBUTIONS Page Contents 3.1 Introduction to Probability Distributions 51 3.2 The Normal Distribution 56 3.3 The Binomial Distribution 60 3.4 The Poisson Distribution 64 Exercise
A random variable (r. v.) is a variable whose value is a numerical outcome of a random phenomenon.
 is a variable whose value is a numerical outcome of a random phenomenon.") Chapter 14: random variables p394 A random variable (r. v.) is a variable whose value is a numerical outcome of a random phenomenon. Consider the experiment of tossing a coin. Define a random variable
Chapter 14: random variables p394 A random variable (r. v.) is a variable whose value is a numerical outcome of a random phenomenon. Consider the experiment of tossing a coin. Define a random variable
Lecture III. 1. common parametric models 2. model fitting 2a. moment matching 2b. maximum likelihood 3. hypothesis testing 3a. p-values 3b.
 Lecture III 1. common parametric models 2. model fitting 2a. moment matching 2b. maximum likelihood 3. hypothesis testing 3a. p-values 3b. simulation Parameters Parameters are knobs that control the amount
Statistics for Business and Economics: Random Variables:Continuous
 Statistics for Business and Economics: Random Variables:Continuous STT 315: Section 107 Acknowledgement: I d like to thank Dr. Ashoke Sinha for allowing me to use and edit the slides. Murray Bourne (interactive
Lecture 9 - Sampling Distributions and the CLT
 Lecture 9 - Sampling Distributions and the CLT Sta102/BME102 Colin Rundel September 23, 2015 1 Variability of Estimates Activity Sampling distributions - via simulation Sampling distributions - via CLT
INDIAN INSTITUTE OF SCIENCE STOCHASTIC HYDROLOGY. Lecture -5 Course Instructor : Prof. P. P. MUJUMDAR Department of Civil Engg., IISc.
 INDIAN INSTITUTE OF SCIENCE STOCHASTIC HYDROLOGY Lecture -5 Course Instructor : Prof. P. P. MUJUMDAR Department of Civil Engg., IISc. Summary of the previous lecture Moments of a distribubon Measures of
Statistics 13 Elementary Statistics
 Statistics 13 Elementary Statistics Summer Session I 2012 Lecture Notes 5: Estimation with Confidence intervals 1 Our goal is to estimate the value of an unknown population parameter, such as a population
Introduction to Statistical Data Analysis II
 Introduction to Statistical Data Analysis II JULY 2011 Afsaneh Yazdani Preface Major branches of Statistics: - Descriptive Statistics - Inferential Statistics Preface What is Inferential Statistics? Preface
Chapter 7: SAMPLING DISTRIBUTIONS & POINT ESTIMATION OF PARAMETERS
 Chapter 7: SAMPLING DISTRIBUTIONS & POINT ESTIMATION OF PARAMETERS Part 1: Introduction Sampling Distributions & the Central Limit Theorem Point Estimation & Estimators Sections 7-1 to 7-2 Sample data
Lecture 6: Confidence Intervals
 Lecture 6: Confidence Intervals Taeyong Park Washington University in St. Louis February 22, 2017 Park (Wash U.) U25 PS323 Intro to Quantitative Methods February 22, 2017 1 / 29 Today... Review of sampling
Econ 6900: Statistical Problems. Instructor: Yogesh Uppal
 Econ 6900: Statistical Problems Instructor: Yogesh Uppal Email: yuppal@ysu.edu Lecture Slides 4 Random Variables Probability Distributions Discrete Distributions Discrete Uniform Probability Distribution
Module 3: Sampling Distributions and the CLT Statistics (OA3102)
") Module 3: Sampling Distributions and the CLT Statistics (OA3102) Professor Ron Fricker Naval Postgraduate School Monterey, California Reading assignment: WM&S chpt 7.1-7.3, 7.5 Revision: 1-12 1 Goals for
Module 3: Sampling Distributions and the CLT Statistics (OA3102) Professor Ron Fricker Naval Postgraduate School Monterey, California Reading assignment: WM&S chpt 7.1-7.3, 7.5 Revision: 1-12 1 Goals for