Statistical Tables Compiled by Alan J. Terry
|
|
|
- Edith Allen
- 5 years ago
- Views:
Transcription

1 Statistical Tables Compiled by Alan J. Terry School of Science and Sport University of the West of Scotland Paisley, Scotland
2 Contents Table 1: Cumulative binomial probabilities Page 1 Table 2: Cumulative Poisson probabilities Page 6 Table 3: Cumulative standard normal probabilities Page 12 Table 4: Inverse standard normal distribution Page 15 Table 5: Upper percentage points of the t distribution Page 17 Table 6: Control chart limits for sample mean Page 19 Table 7: Control chart limits for sample range Page 21 Table 8: Factor to estimate population standard deviation from mean of sample ranges Page 22 Table 9: Control chart limits for sample standard deviation Page 23 Table 10: Derivation of single sampling plans Page 24 Table 11: Construction of OC curves for single sampling plans Page 26 Table 12: Probability distributions Page 27 Table 13: Various formulae Page 29
 for the Binomial")
.")
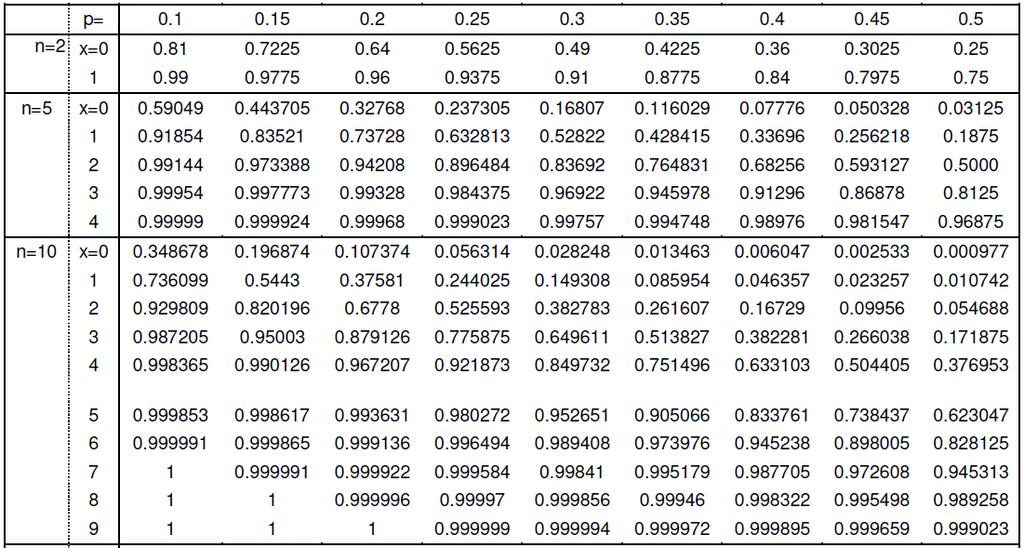
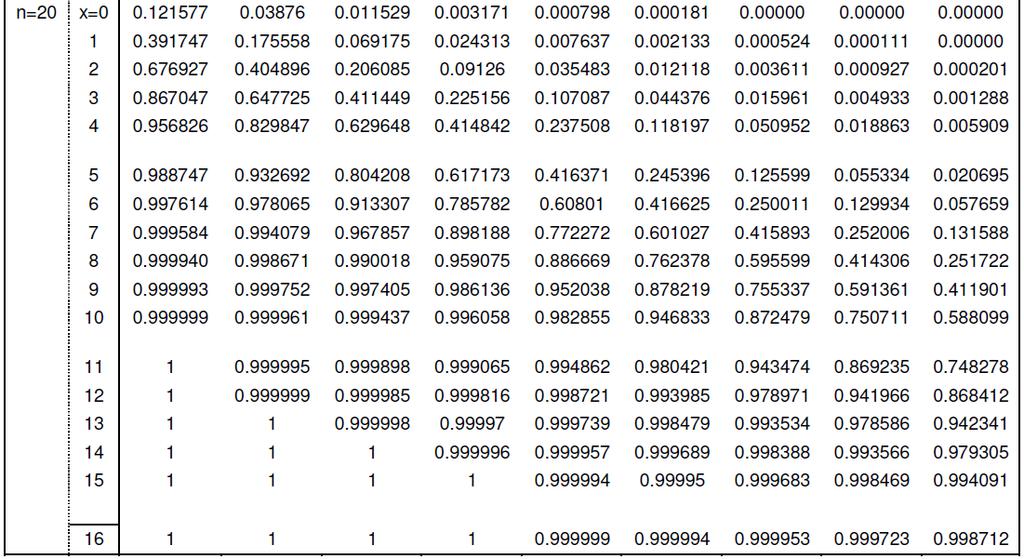
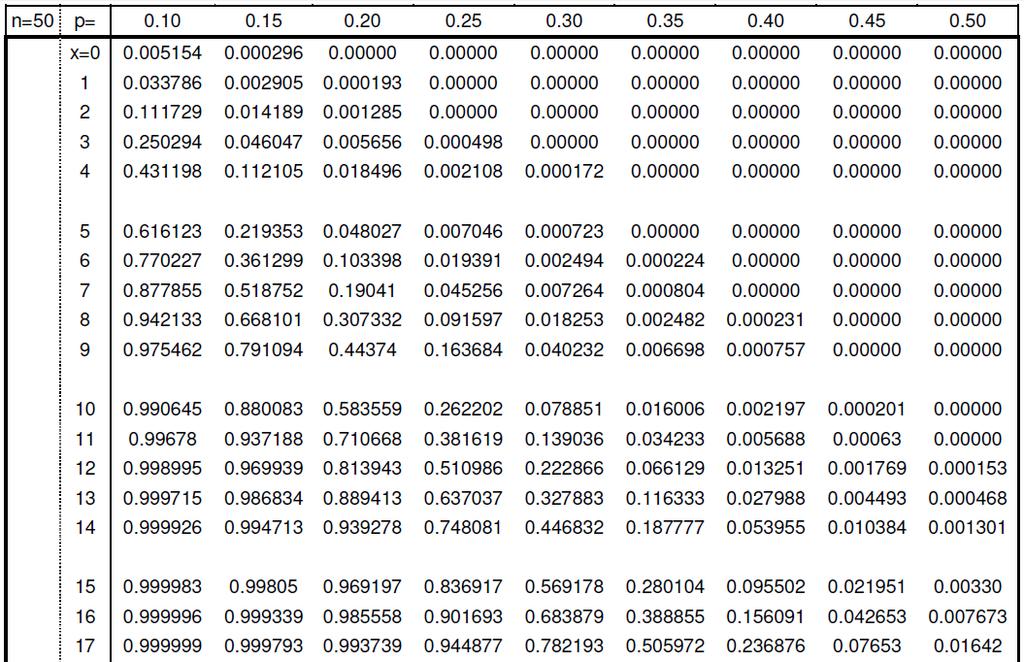
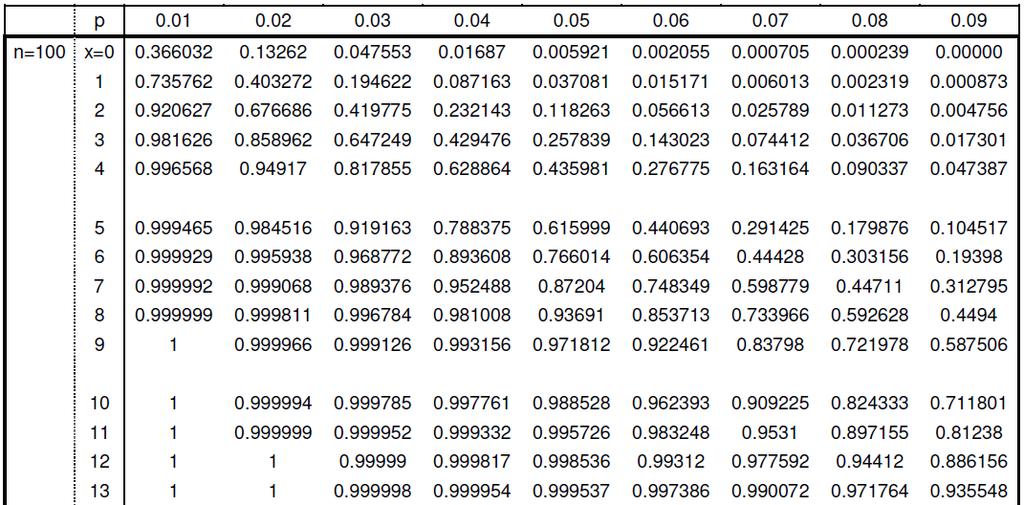
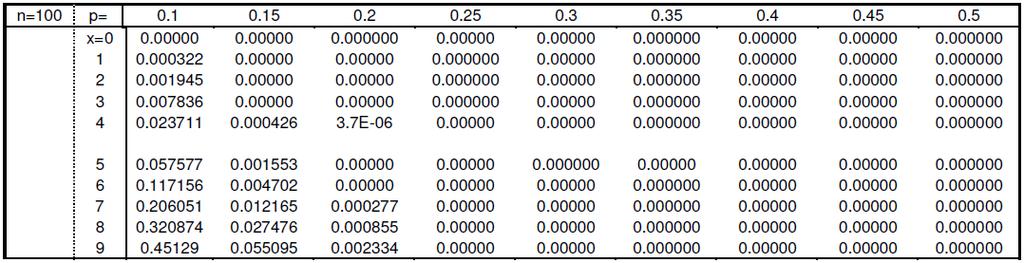
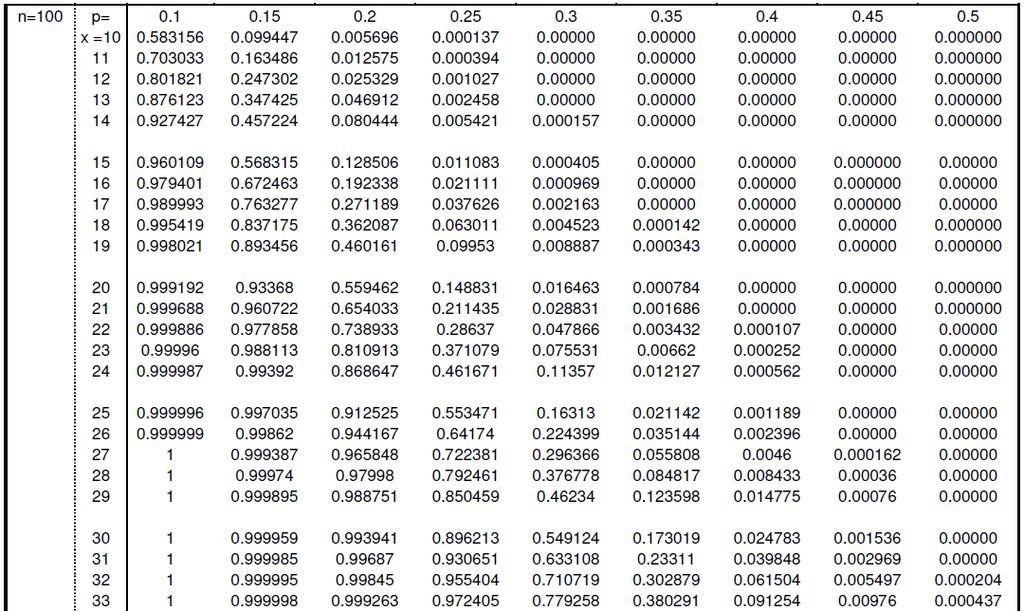
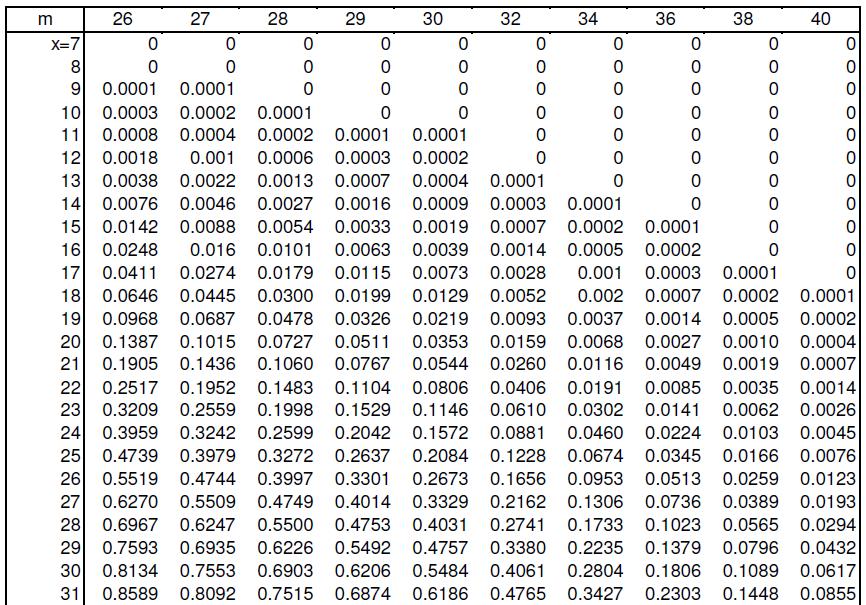
3 Table 1 Cumulative Distribution Function for the Binomial Distribution The function tabulated is the cumulative distribution function (cdf) for the Binomial distribution, for different values of n (the number of trials) and p (the probability of success on any one trial). The value is: x ( ) n F (x) = P (X x) = p r (1 p) n r r r=0 1
4 2
5 3
6 4
7 5
 for the Poisson distribution, for different values of m (the mean).")
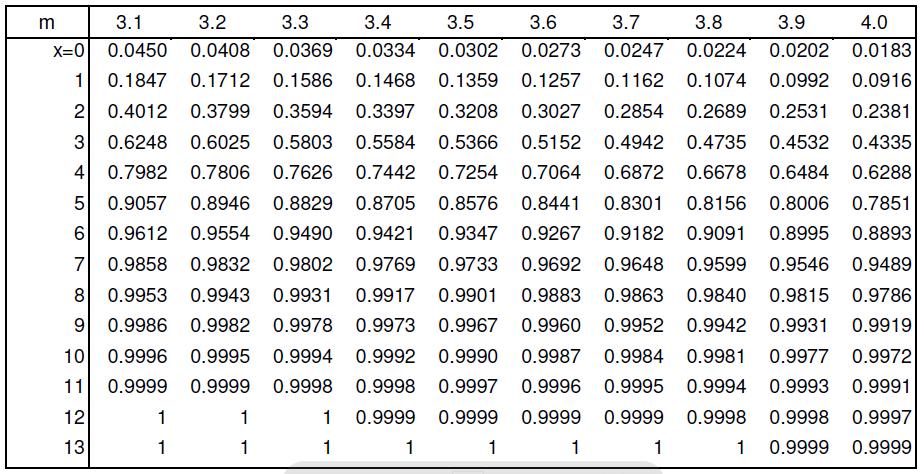
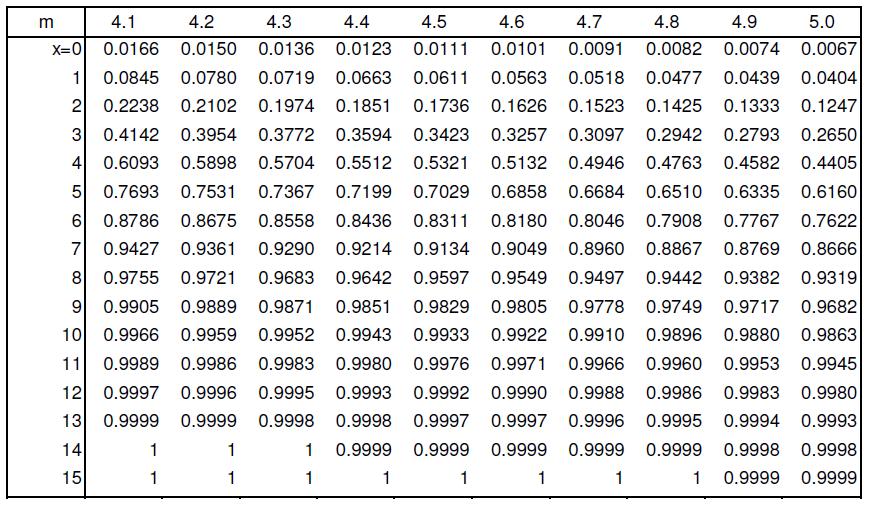
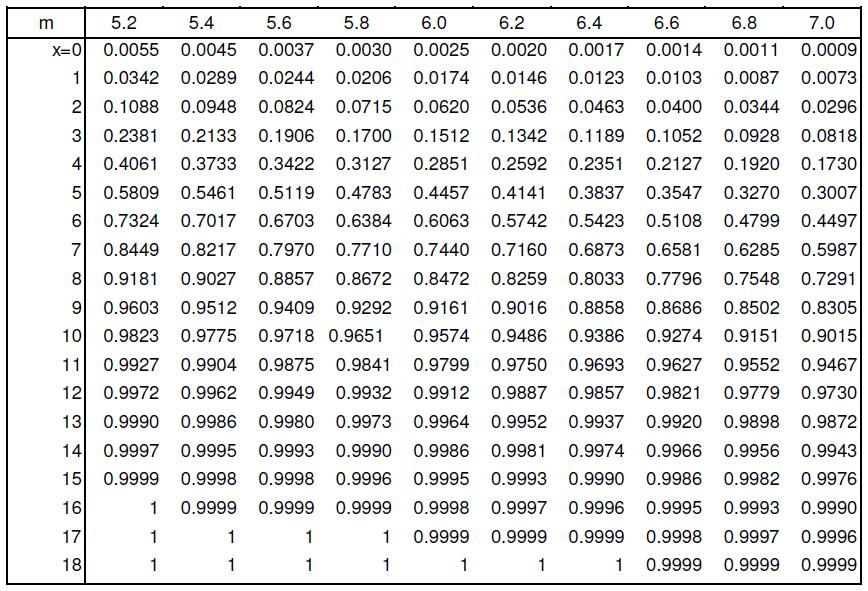
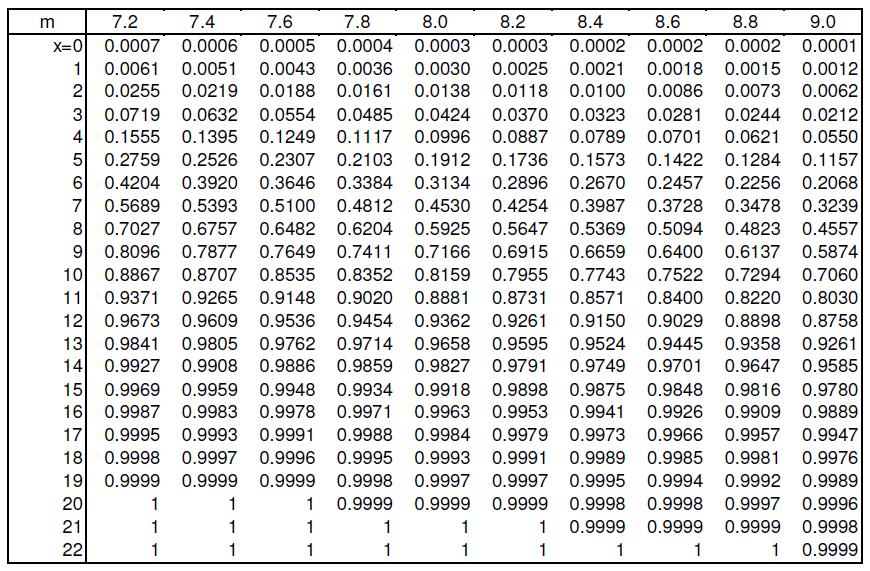
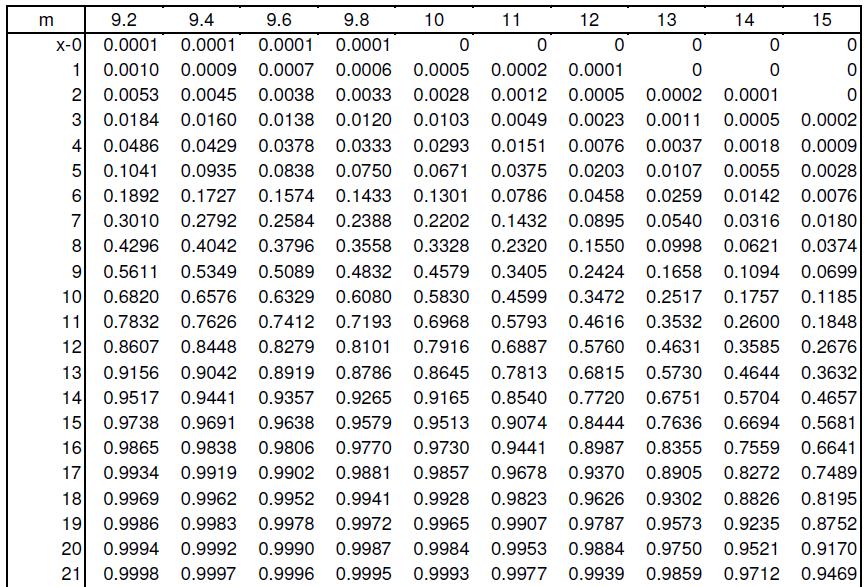
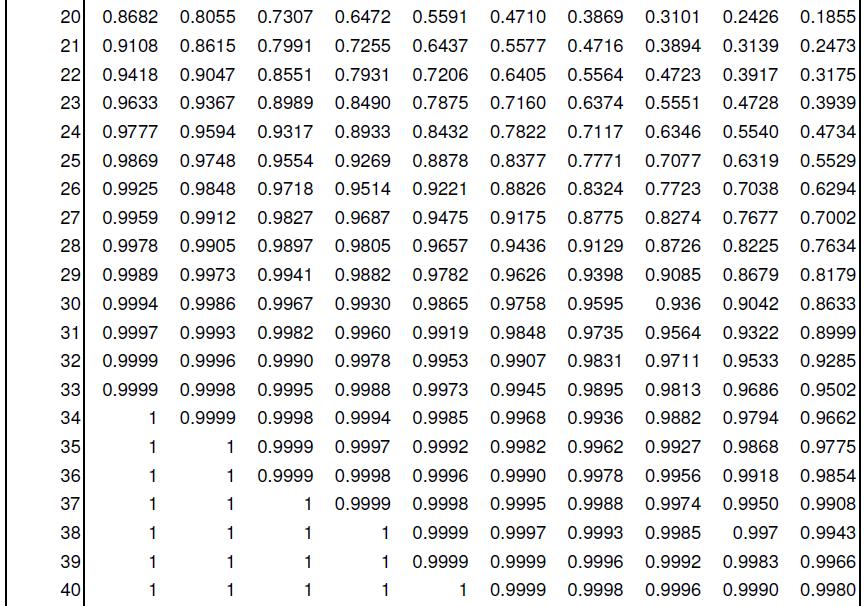
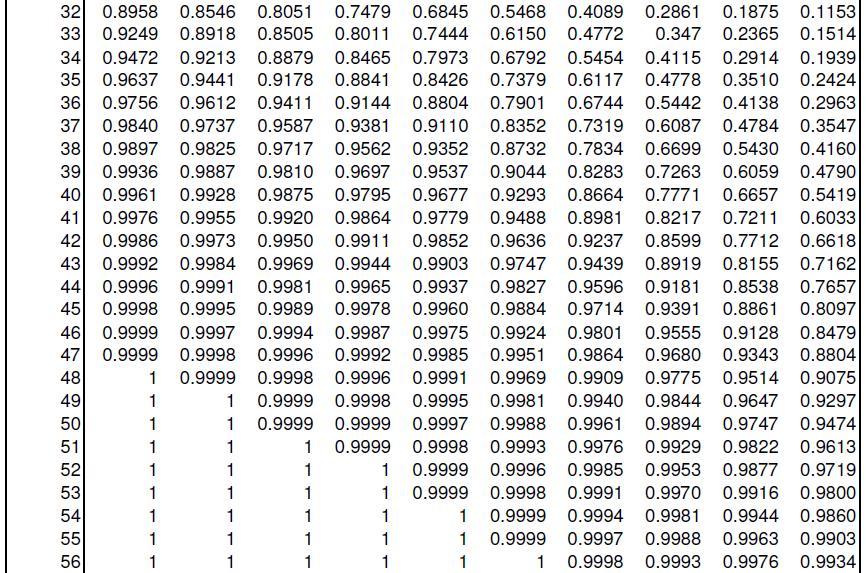
8 Table 2 Cumulative Distribution Function for the Poisson Distribution The function tabulated is the cumulative distribution function (cdf) for the Poisson distribution, for different values of m (the mean). The value is: F (x) = P (X x) = x e m m r r=0 r! 6
9 7
10 8
11 9
12 10
13 11
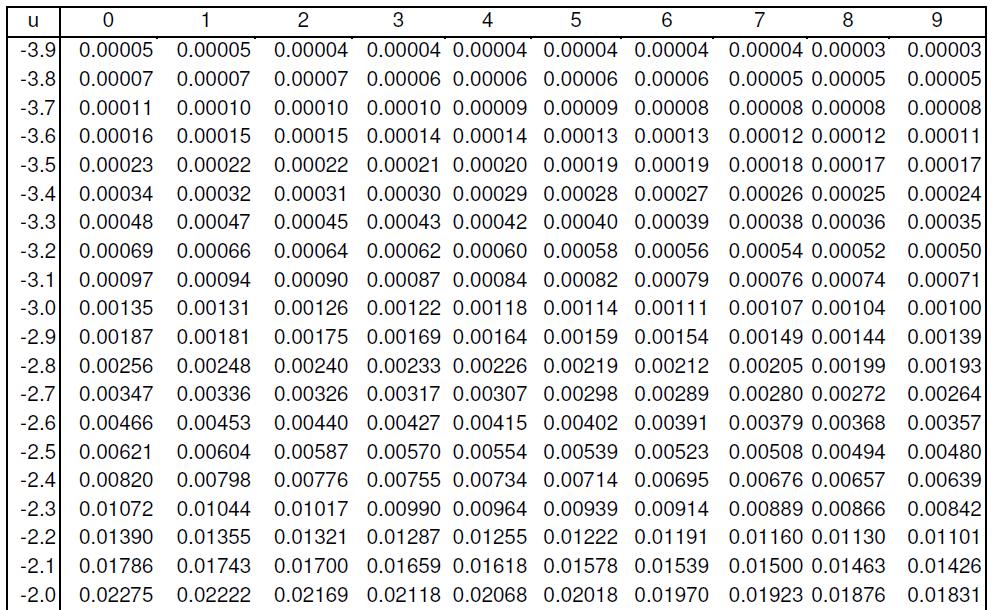
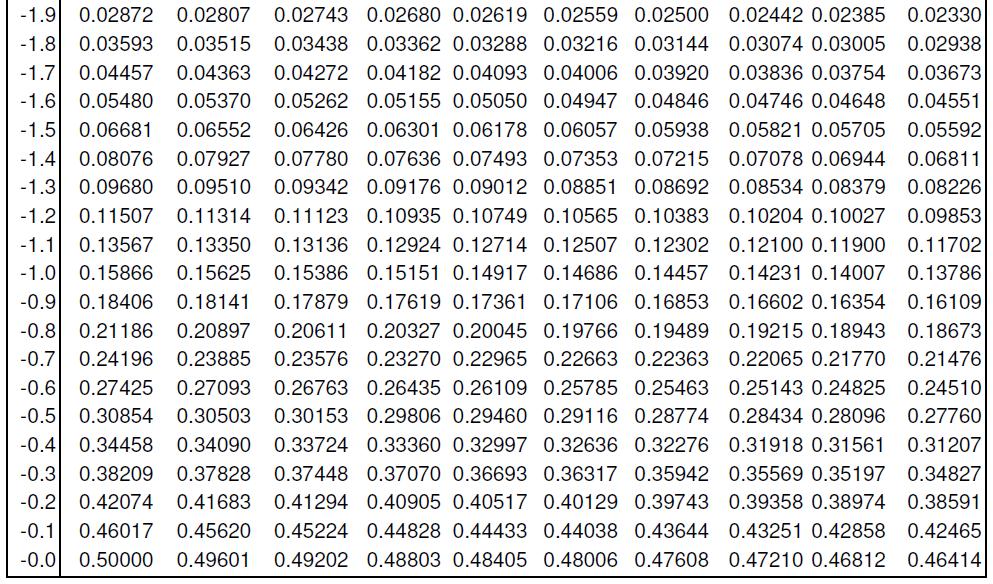
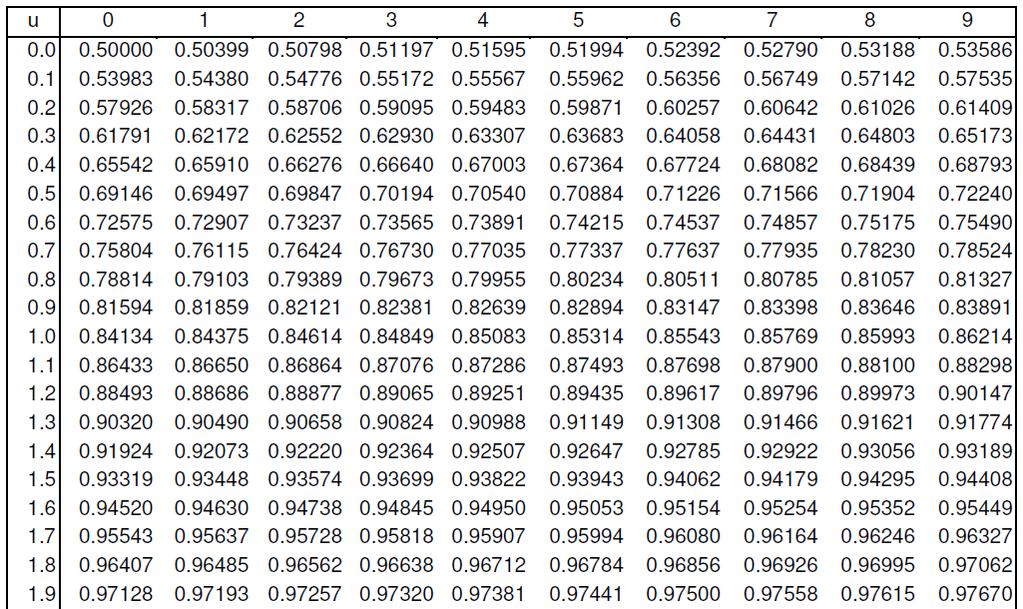
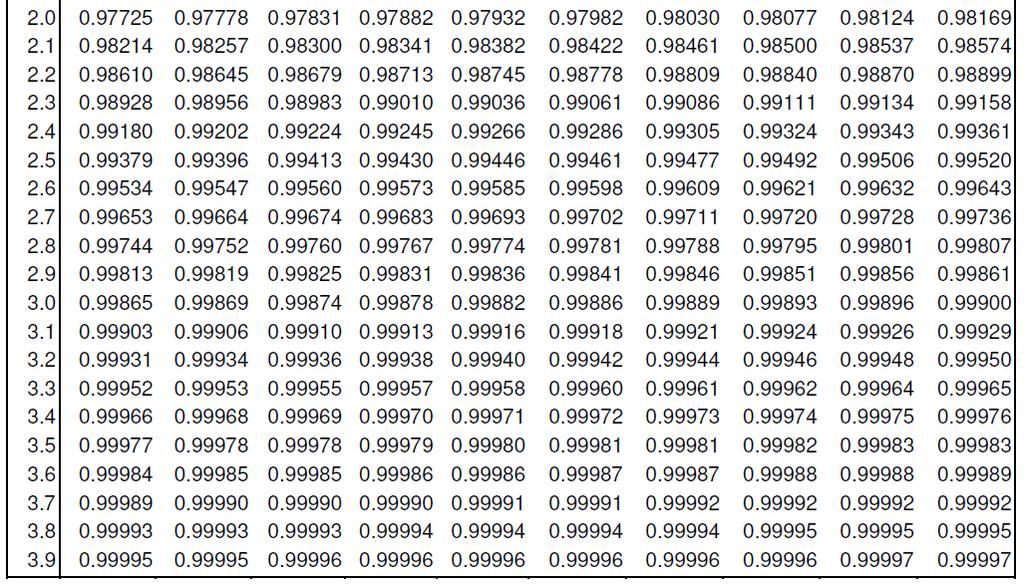
14 Table 3 Cumulative Distribution Function for the Standard Normal Distribution The function tabulated is Φ(u), which is the cumulative distribution function (cdf) for the standard normal distribution, U N(0, 1 2 ). The values are produced from the following formula: Φ(u) = P (U u) = u e t2 /2 2π dt Note that Φ(u) = P (U u) is the area under the probability density function (pdf) for U to the left of u, as illustrated in the figure below. Note also that, if X N(µ, σ 2 ), then the variable U = (X µ)/σ follows the standard normal distribution N(0, 1 2 ). The tables for the cdf of U are shown on the next two pages. 12
15 13
16 14
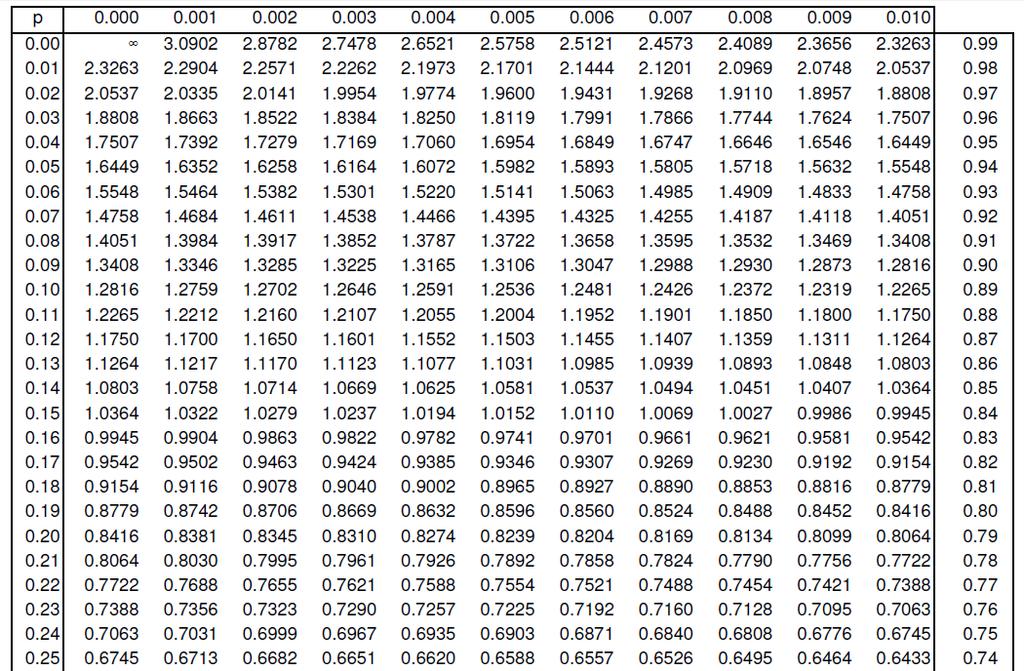
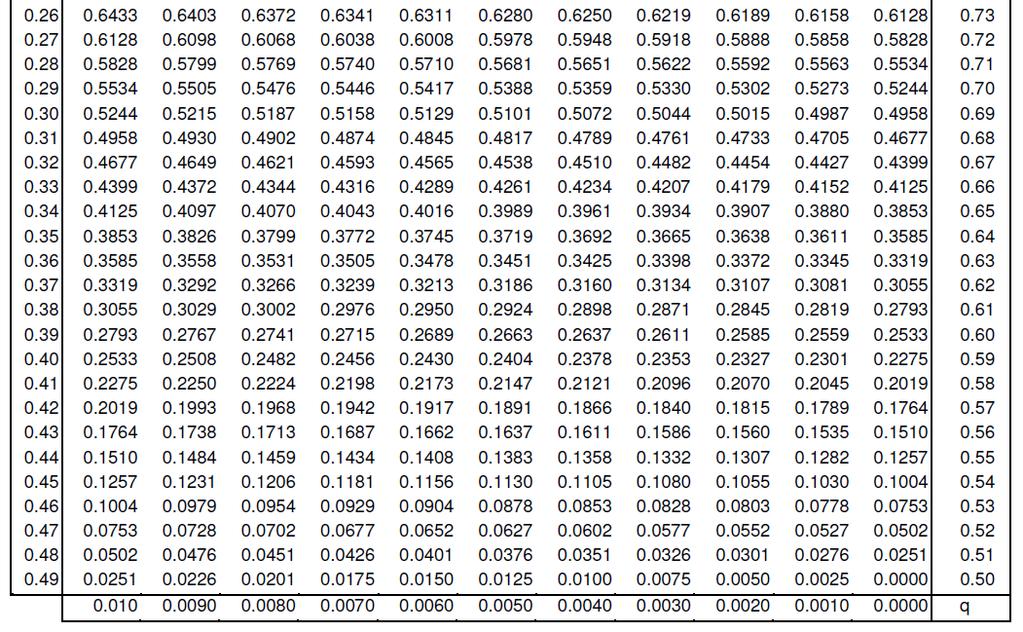
 = Φ 1 (1 p), as illustrated in the figure below.")
17 Table 4 The Inverse of the Standard Normal Distribution The function tabulated is Φ 1. Note that we have u = Φ 1 (q) = Φ 1 (1 p), as illustrated in the figure below. The table is shown on the next page. 15
18 16
19 Table 5 Upper Percentage Points of the t Distribution The table gives the values of t ν (α). There are the 100α percentage points of the t distribution with ν degrees of freedom. The value t ν (α) is the solution to: α = Γ [(ν + 1)/2] νπγ(n/2) t ν(α) ) (1 + x2 dx ν The value t ν (α) is that number such that the area under the probability density function of the t distribution with ν degrees of freedom to the right of the number is α. This is illustrated in the figure below. The table is shown on the next page. 17
20 18
21 Table 6 Control Chart Limits for Sample Mean, x The tabulated values can be used to derive warning and action limits for an X bar control chart. Let x be the mean of the sample means. If using the mean of the sample ranges, R, to create the X bar chart, then: warning limits = x ± A R action limits = x ± A R If using the mean of the sample standard deviations, s, to create the X bar chart, then: The table is shown on the next page. warning limits = x ± A s action limits = x ± A s 19
22 20
23 Table 7 Control Chart Limits for Sample Range, R The tabulated values can be used to derive warning and action limits for a Range control chart, or R chart. Let R be the mean of the sample ranges. Then: The table is shown below. lower action limit = D R lower warning limit = D R upper warning limit = D R upper action limit = D R 21
24 Table 8 Factor to estimate population standard deviation, σ, from mean of sample ranges, R An estimate of the population standard deviation, σ, may be found as follows: estimate of σ = R d 2 where R is the mean of the sample ranges, and where d 2 is a factor that depends on the sample size as in the table below. Sample size d
25 Table 9 Control Chart Limits for Sample Standard Deviation, s The tabulated values can be used to derive warning and action limits for a standard deviation control chart, or s chart. Let s be the mean of the sample standard deviations. Then: lower action limit = D s lower warning limit = D s upper warning limit = D s upper action limit = D s The table below shows values for the factors D 0.999, D 0.975, D 0.025, and D Note that the table can also be used to produce an estimate for the mean of the sample ranges, R, using the following formula: estimate of R = sd 2 23
26 Table 10 Derivation of Single Sampling Plans The table on the next page can be used to construct a single sampling plan with Operating Characteristic curve passing through (or very close to) the following two points: where (p 1, 1 α) and (p 2, β) p 1 = Acceptable Quality Level (AQL) p 2 = Limiting Quality (LQ) α = Producer s Risk β = Consumer s Risk To use the table, first identify the appropriate column, that is, the column with the specified values for α and β. In this column, select the row with value closest to (or just less than) p 2 /p 1. The acceptance number is c for that row, whilst the sample size n is found by reading off the value for np 1 for that row and dividing this by p 1. If this produces a value for n that is not a whole number, then round up to the next whole number and take this as the value for n. 24
27 25
.")

28 Table 11 Construction of OC Curves for Single Sampling Plans The table below shows values of np for which the probability of acceptance of c or fewer defectives in a sample of n is P (A). To find the proportion of defectives, p, corresponding to an acceptance probability P (A) in a single sampling plan with sample size n and acceptance number c, divide the table entry by n. 26
29 Table 12 Probability Distributions Hypergeometric distribution This is a discrete distribution. It can be used to represent the exact probability for the number of defectives in a sample taken from a single batch. If a batch has N items, of which m are defective, and a sample of size n is taken from the batch by simple random sampling, then the number of defectives in the sample, X, is a hypergeometric random variable. We represent this by writing X hyper(n, m, n). Observe that X has the following frequency function: ( m )( N m ) k n k P (X = k) = ( N, max{0, n + m N} k min{m, n} n) The mean and variance of X are as follows: mean of X is nm N, variance of X is ( nm N ) ( 1 m N ) ( ) N n N 1 Computations involving the hypergeometric distribution are very involved. Hence the hypergeometric distribution is typically approximated by other distributions when these approximations are valid. Binomial distribution This is a discrete distribution. It can be used to represent the probability for the number of defectives in a sample taken from a continuous process. If there are n independent trials, with probability p of success on each trial, then the total number of successes, X, is a binomial random variable. We represent this by writing X B(N, p). Observe that X has the following frequency function: P (X = k) = ( n k ) p k (1 p) n k, k = 0, 1, 2,..., n Here we could have that n is the size of a sample taken from a continuous process, with p equal to the probability of any particular item being defective, and with X equal to the total number of defectives in the sample. The mean and variance of X are as follows: mean of X is np, variance of X is np(1 p) The binomial distribution can be used to approximate the hypergeometric distribution. To be specific, X hyper(n, m, n) can be approximated by Y B(n, p) where p = m/n. The approximation is reasonable provided that the probability of success on each trial is not measurably altered by sampling. 27
30 Poisson distribution This is a discrete distribution. It can be used to represent the probability for the number of times an event can happen, when there is no limit to how many times the event could happen. The notation X Po(λ) is used to indicate that X is a Poisson random variable with parameter λ. Here λ is the average rate, or simply the rate. The frequency function for X is: P (X = k) = λk k! e λ, k = 0, 1, 2,... The mean and variance of X are as follows: mean of X is λ, variance of X is λ The Poisson distribution can be used to approximate the binomial distribution. To be specific, X B(n, p) can be approximated by Y Po(λ) where λ = np. The approximation is reasonable provided that n is large and p is small. A rule of thumb is that the approximation is good if p 0.1 and np < 5. Normal distribution This is a continuous distribution. It can be used to represent the probability that a measurement, on a continous scale, lies within a certain interval of values. It arises as a model for sample means due to the central limit theorem. The notation X N(µ, σ 2 ) is used to indicate that X is a normal random variable with mean µ and variance σ 2. The density function for X is: ( ) 1 f(x) = σ e (x µ)2 /(2σ 2 ) 2π The normal distribution can be used to approximate the binomial distribution. To be specific, X B(n, p) can be approximated by Y N(µ, σ 2 ) where µ = np and σ 2 = np(1 p). The approximation is reasonable provided that n is large and p is not very small. A rule of thumb is that the approximation is good if p 0.1 and np > 5. In using the approximation, a continuity correction should be applied. 28
31 Table 13 Various formulae Sample mean If x 1, x 2,..., x n are the values in a sample of size n, then: ( ) n 1 sample mean = x = x i n i=1 Sample variance and sample standard deviation If x 1, x 2,..., x n are the values in a sample of size n, then: sample variance = s 2 = ( ) 1 n 1 n x 2 i i=1 ( ) ( 1 n n i=1 ) 2 x i The sample standard deviation, s, is the (non-negative) square root of the sample variance, s 2. C p index and C pk index For a process with standard deviation σ, and for which USL and LSL refer to the Upper Specification Limit and Lower Specification Limit, respectively, then the C p index is: USL LSL C p = 6σ Moreover, the C pk index is: { USL µ C pk = min, 3σ where µ is the process mean. } µ LSL 3σ Confidence intervals If x 1, x 2,..., x n are the values in a sample of size n, and if the values are independent realisations from the same normal population, then a 100(1 α)% confidence interval for the population mean µ is x ± (s/ n) t n 1 (α/2), where x is the sample mean, s is the sample standard deviation, and t n 1 (α/2) is the upper percentage point of the t distribution with n 1 degrees of freedom that corresponds to an upper tail probability of α/2. 29
Version A. Problem 1. Let X be the continuous random variable defined by the following pdf: 1 x/2 when 0 x 2, f(x) = 0 otherwise.
 = 0 otherwise.") Math 224 Q Exam 3A Fall 217 Tues Dec 12 Version A Problem 1. Let X be the continuous random variable defined by the following pdf: { 1 x/2 when x 2, f(x) otherwise. (a) Compute the mean µ E[X]. E[X] x
Math 224 Q Exam 3A Fall 217 Tues Dec 12 Version A Problem 1. Let X be the continuous random variable defined by the following pdf: { 1 x/2 when x 2, f(x) otherwise. (a) Compute the mean µ E[X]. E[X] x
continuous rv Note for a legitimate pdf, we have f (x) 0 and f (x)dx = 1. For a continuous rv, P(X = c) = c f (x)dx = 0, hence
 0 and f (x)dx = 1. For a continuous rv, P(X = c) = c f (x)dx = 0, hence") continuous rv Let X be a continuous rv. Then a probability distribution or probability density function (pdf) of X is a function f(x) such that for any two numbers a and b with a b, P(a X b) = b a f (x)dx.
continuous rv Let X be a continuous rv. Then a probability distribution or probability density function (pdf) of X is a function f(x) such that for any two numbers a and b with a b, P(a X b) = b a f (x)dx.
2011 Pearson Education, Inc
 Statistics for Business and Economics Chapter 4 Random Variables & Probability Distributions Content 1. Two Types of Random Variables 2. Probability Distributions for Discrete Random Variables 3. The Binomial
ME3620. Theory of Engineering Experimentation. Spring Chapter III. Random Variables and Probability Distributions.
 ME3620 Theory of Engineering Experimentation Chapter III. Random Variables and Probability Distributions Chapter III 1 3.2 Random Variables In an experiment, a measurement is usually denoted by a variable
Tutorial 11: Limit Theorems. Baoxiang Wang & Yihan Zhang bxwang, April 10, 2017
 Tutorial 11: Limit Theorems Baoxiang Wang & Yihan Zhang bxwang, yhzhang@cse.cuhk.edu.hk April 10, 2017 1 Outline The Central Limit Theorem (CLT) Normal Approximation Based on CLT De Moivre-Laplace Approximation
Sampling Distribution
 MAT 2379 (Spring 2012) Sampling Distribution Definition : Let X 1,..., X n be a collection of random variables. We say that they are identically distributed if they have a common distribution. Definition
The Normal Distribution. (Ch 4.3)
") 5 The Normal Distribution (Ch 4.3) The Normal Distribution The normal distribution is probably the most important distribution in all of probability and statistics. Many populations have distributions
5 The Normal Distribution (Ch 4.3) The Normal Distribution The normal distribution is probably the most important distribution in all of probability and statistics. Many populations have distributions
Chapter 4 Continuous Random Variables and Probability Distributions
 Chapter 4 Continuous Random Variables and Probability Distributions Part 2: More on Continuous Random Variables Section 4.5 Continuous Uniform Distribution Section 4.6 Normal Distribution 1 / 28 One more
Random variables. Contents
 Random variables Contents 1 Random Variable 2 1.1 Discrete Random Variable............................ 3 1.2 Continuous Random Variable........................... 5 1.3 Measures of Location...............................
Lecture 23. STAT 225 Introduction to Probability Models April 4, Whitney Huang Purdue University. Normal approximation to Binomial
 Lecture 23 STAT 225 Introduction to Probability Models April 4, 2014 approximation Whitney Huang Purdue University 23.1 Agenda 1 approximation 2 approximation 23.2 Characteristics of the random variable:
Chapter 4 Continuous Random Variables and Probability Distributions
 Chapter 4 Continuous Random Variables and Probability Distributions Part 2: More on Continuous Random Variables Section 4.5 Continuous Uniform Distribution Section 4.6 Normal Distribution 1 / 27 Continuous
Probability Theory and Simulation Methods. April 9th, Lecture 20: Special distributions
 April 9th, 2018 Lecture 20: Special distributions Week 1 Chapter 1: Axioms of probability Week 2 Chapter 3: Conditional probability and independence Week 4 Chapters 4, 6: Random variables Week 9 Chapter
ECON 214 Elements of Statistics for Economists 2016/2017
 ECON 214 Elements of Statistics for Economists 2016/2017 Topic The Normal Distribution Lecturer: Dr. Bernardin Senadza, Dept. of Economics bsenadza@ug.edu.gh College of Education School of Continuing and
Commonly Used Distributions
 Chapter 4: Commonly Used Distributions 1 Introduction Statistical inference involves drawing a sample from a population and analyzing the sample data to learn about the population. We often have some knowledge
Random Variable: Definition
 Random Variables Random Variable: Definition A Random Variable is a numerical description of the outcome of an experiment Experiment Roll a die 10 times Inspect a shipment of 100 parts Open a gas station
Chapter 7 1. Random Variables
 Chapter 7 1 Random Variables random variable numerical variable whose value depends on the outcome of a chance experiment - discrete if its possible values are isolated points on a number line - continuous
Engineering Statistics ECIV 2305
 Engineering Statistics ECIV 2305 Section 5.3 Approximating Distributions with the Normal Distribution Introduction A very useful property of the normal distribution is that it provides good approximations
PROBABILITY DISTRIBUTIONS
 CHAPTER 3 PROBABILITY DISTRIBUTIONS Page Contents 3.1 Introduction to Probability Distributions 51 3.2 The Normal Distribution 56 3.3 The Binomial Distribution 60 3.4 The Poisson Distribution 64 Exercise
MidTerm 1) Find the following (round off to one decimal place):
 Find the following (round off to one decimal place):") MidTerm 1) 68 49 21 55 57 61 70 42 59 50 66 99 Find the following (round off to one decimal place): Mean = 58:083, round off to 58.1 Median = 58 Range = max min = 99 21 = 78 St. Deviation = s = 8:535,
MidTerm 1) 68 49 21 55 57 61 70 42 59 50 66 99 Find the following (round off to one decimal place): Mean = 58:083, round off to 58.1 Median = 58 Range = max min = 99 21 = 78 St. Deviation = s = 8:535,
Normal Distribution. Notes. Normal Distribution. Standard Normal. Sums of Normal Random Variables. Normal. approximation of Binomial.
 Lecture 21,22, 23 Text: A Course in Probability by Weiss 8.5 STAT 225 Introduction to Probability Models March 31, 2014 Standard Sums of Whitney Huang Purdue University 21,22, 23.1 Agenda 1 2 Standard
Central Limit Theorem, Joint Distributions Spring 2018
 Central Limit Theorem, Joint Distributions 18.5 Spring 218.5.4.3.2.1-4 -3-2 -1 1 2 3 4 Exam next Wednesday Exam 1 on Wednesday March 7, regular room and time. Designed for 1 hour. You will have the full
UQ, STAT2201, 2017, Lectures 3 and 4 Unit 3 Probability Distributions.
 UQ, STAT2201, 2017, Lectures 3 and 4 Unit 3 Probability Distributions. Random Variables 2 A random variable X is a numerical (integer, real, complex, vector etc.) summary of the outcome of the random experiment.
ECO220Y Continuous Probability Distributions: Normal Readings: Chapter 9, section 9.10
 ECO220Y Continuous Probability Distributions: Normal Readings: Chapter 9, section 9.10 Fall 2011 Lecture 8 Part 2 (Fall 2011) Probability Distributions Lecture 8 Part 2 1 / 23 Normal Density Function f
Random Variables Handout. Xavier Vilà
 Random Variables Handout Xavier Vilà Course 2004-2005 1 Discrete Random Variables. 1.1 Introduction 1.1.1 Definition of Random Variable A random variable X is a function that maps each possible outcome
Chapter 8: The Binomial and Geometric Distributions
 Chapter 8: The Binomial and Geometric Distributions 8.1 Binomial Distributions 8.2 Geometric Distributions 1 Let me begin with an example My best friends from Kent School had three daughters. What is the
DATA ANALYSIS AND SOFTWARE
 DATA ANALYSIS AND SOFTWARE 3 cr, pass/fail http://datacourse.notlong.com Session 27.11.2009 (Keijo Ruohonen): QUALITY ASSURANCE WITH MATLAB 1 QUALITY ASSURANCE WHAT IS IT? Quality Design (actually part
Class 16. Daniel B. Rowe, Ph.D. Department of Mathematics, Statistics, and Computer Science. Marquette University MATH 1700
 Class 16 Daniel B. Rowe, Ph.D. Department of Mathematics, Statistics, and Computer Science Copyright 013 by D.B. Rowe 1 Agenda: Recap Chapter 7. - 7.3 Lecture Chapter 8.1-8. Review Chapter 6. Problem Solving
NORMAL APPROXIMATION. In the last chapter we discovered that, when sampling from almost any distribution, e r2 2 rdrdϕ = 2π e u du =2π.
 NOMAL APPOXIMATION Standardized Normal Distribution Standardized implies that its mean is eual to and the standard deviation is eual to. We will always use Z as a name of this V, N (, ) will be our symbolic
Statistics 6 th Edition
 Statistics 6 th Edition Chapter 5 Discrete Probability Distributions Chap 5-1 Definitions Random Variables Random Variables Discrete Random Variable Continuous Random Variable Ch. 5 Ch. 6 Chap 5-2 Discrete
MA131 Lecture 8.2. The normal distribution curve can be considered as a probability distribution curve for normally distributed variables.
 Normal distribution curve as probability distribution curve The normal distribution curve can be considered as a probability distribution curve for normally distributed variables. The area under the normal
What was in the last lecture?
 What was in the last lecture? Normal distribution A continuous rv with bell-shaped density curve The pdf is given by f(x) = 1 2πσ e (x µ)2 2σ 2, < x < If X N(µ, σ 2 ), E(X) = µ and V (X) = σ 2 Standard
. (i) What is the probability that X is at most 8.75? =.875
 What is the probability that X is at most 8.75? =.875") Worksheet 1 Prep-Work (Distributions) 1)Let X be the random variable whose c.d.f. is given below. F X 0 0.3 ( x) 0.5 0.8 1.0 if if if if if x 5 5 x 10 10 x 15 15 x 0 0 x Compute the mean, X. (Hint: First
Worksheet 1 Prep-Work (Distributions) 1)Let X be the random variable whose c.d.f. is given below. F X 0 0.3 ( x) 0.5 0.8 1.0 if if if if if x 5 5 x 10 10 x 15 15 x 0 0 x Compute the mean, X. (Hint: First
Statistics for Business and Economics
 Statistics for Business and Economics Chapter 5 Continuous Random Variables and Probability Distributions Ch. 5-1 Probability Distributions Probability Distributions Ch. 4 Discrete Continuous Ch. 5 Probability
χ 2 distributions and confidence intervals for population variance
 χ 2 distributions and confidence intervals for population variance Let Z be a standard Normal random variable, i.e., Z N(0, 1). Define Y = Z 2. Y is a non-negative random variable. Its distribution is
Lecture Stat 302 Introduction to Probability - Slides 15
 Lecture Stat 30 Introduction to Probability - Slides 15 AD March 010 AD () March 010 1 / 18 Continuous Random Variable Let X a (real-valued) continuous r.v.. It is characterized by its pdf f : R! [0, )
Central Limit Theorem (cont d) 7/28/2006
 7/28/2006") Central Limit Theorem (cont d) 7/28/2006 Central Limit Theorem for Binomial Distributions Theorem. For the binomial distribution b(n, p, j) we have lim npq b(n, p, np + x npq ) = φ(x), n where φ(x) is
Central Limit Theorem (cont d) 7/28/2006 Central Limit Theorem for Binomial Distributions Theorem. For the binomial distribution b(n, p, j) we have lim npq b(n, p, np + x npq ) = φ(x), n where φ(x) is
ECE 340 Probabilistic Methods in Engineering M/W 3-4:15. Lecture 10: Continuous RV Families. Prof. Vince Calhoun
 ECE 340 Probabilistic Methods in Engineering M/W 3-4:15 Lecture 10: Continuous RV Families Prof. Vince Calhoun 1 Reading This class: Section 4.4-4.5 Next class: Section 4.6-4.7 2 Homework 3.9, 3.49, 4.5,
Chapter 4: Commonly Used Distributions. Statistics for Engineers and Scientists Fourth Edition William Navidi
 Chapter 4: Commonly Used Distributions Statistics for Engineers and Scientists Fourth Edition William Navidi 2014 by Education. This is proprietary material solely for authorized instructor use. Not authorized
4-2 Probability Distributions and Probability Density Functions. Figure 4-2 Probability determined from the area under f(x).
.") 4-2 Probability Distributions and Probability Density Functions Figure 4-2 Probability determined from the area under f(x). 4-2 Probability Distributions and Probability Density Functions Definition 4-2
4-2 Probability Distributions and Probability Density Functions Figure 4-2 Probability determined from the area under f(x). 4-2 Probability Distributions and Probability Density Functions Definition 4-2
Homework: Due Wed, Nov 3 rd Chapter 8, # 48a, 55c and 56 (count as 1), 67a
, 67a") Homework: Due Wed, Nov 3 rd Chapter 8, # 48a, 55c and 56 (count as 1), 67a Announcements: There are some office hour changes for Nov 5, 8, 9 on website Week 5 quiz begins after class today and ends at
Homework: Due Wed, Nov 3 rd Chapter 8, # 48a, 55c and 56 (count as 1), 67a Announcements: There are some office hour changes for Nov 5, 8, 9 on website Week 5 quiz begins after class today and ends at
Two hours. To be supplied by the Examinations Office: Mathematical Formula Tables and Statistical Tables THE UNIVERSITY OF MANCHESTER
 Two hours MATH20802 To be supplied by the Examinations Office: Mathematical Formula Tables and Statistical Tables THE UNIVERSITY OF MANCHESTER STATISTICAL METHODS Answer any FOUR of the SIX questions.
LESSON 7 INTERVAL ESTIMATION SAMIE L.S. LY
 LESSON 7 INTERVAL ESTIMATION SAMIE L.S. LY 1 THIS WEEK S PLAN Part I: Theory + Practice ( Interval Estimation ) Part II: Theory + Practice ( Interval Estimation ) z-based Confidence Intervals for a Population
INDIAN INSTITUTE OF SCIENCE STOCHASTIC HYDROLOGY. Lecture -5 Course Instructor : Prof. P. P. MUJUMDAR Department of Civil Engg., IISc.
 INDIAN INSTITUTE OF SCIENCE STOCHASTIC HYDROLOGY Lecture -5 Course Instructor : Prof. P. P. MUJUMDAR Department of Civil Engg., IISc. Summary of the previous lecture Moments of a distribubon Measures of
The Normal Distribution
 The Normal Distribution The normal distribution plays a central role in probability theory and in statistics. It is often used as a model for the distribution of continuous random variables. Like all models,
Chapter 5 Normal Probability Distributions
 Chapter 5 Normal Probability Distributions Section 5-1 Introduction to Normal Distributions and the Standard Normal Distribution A The normal distribution is the most important of the continuous probability
Statistical Intervals (One sample) (Chs )
 (Chs )") 7 Statistical Intervals (One sample) (Chs 8.1-8.3) Confidence Intervals The CLT tells us that as the sample size n increases, the sample mean X is close to normally distributed with expected value µ and
7 Statistical Intervals (One sample) (Chs 8.1-8.3) Confidence Intervals The CLT tells us that as the sample size n increases, the sample mean X is close to normally distributed with expected value µ and
AP Statistics Ch 8 The Binomial and Geometric Distributions
 Ch 8.1 The Binomial Distributions The Binomial Setting A situation where these four conditions are satisfied is called a binomial setting. 1. Each observation falls into one of just two categories, which
. 13. The maximum error (margin of error) of the estimate for μ (based on known σ) is:
 of the estimate for μ (based on known σ) is:") Statistics Sample Exam 3 Solution Chapters 6 & 7: Normal Probability Distributions & Estimates 1. What percent of normally distributed data value lie within 2 standard deviations to either side of the
Statistics Sample Exam 3 Solution Chapters 6 & 7: Normal Probability Distributions & Estimates 1. What percent of normally distributed data value lie within 2 standard deviations to either side of the
Homework: Due Wed, Feb 20 th. Chapter 8, # 60a + 62a (count together as 1), 74, 82
, 74, 82") Announcements: Week 5 quiz begins at 4pm today and ends at 3pm on Wed If you take more than 20 minutes to complete your quiz, you will only receive partial credit. (It doesn t cut you off.) Today: Sections
Announcements: Week 5 quiz begins at 4pm today and ends at 3pm on Wed If you take more than 20 minutes to complete your quiz, you will only receive partial credit. (It doesn t cut you off.) Today: Sections
4-1. Chapter 4. Commonly Used Distributions by The McGraw-Hill Companies, Inc. All rights reserved.
 4-1 Chapter 4 Commonly Used Distributions 2014 by The Companies, Inc. All rights reserved. Section 4.1: The Bernoulli Distribution 4-2 We use the Bernoulli distribution when we have an experiment which
Discrete Probability Distribution
 1 Discrete Probability Distribution Key Definitions Discrete Random Variable: Has a countable number of values. This means that each data point is distinct and separate. Continuous Random Variable: Has
4.3 Normal distribution
 43 Normal distribution Prof Tesler Math 186 Winter 216 Prof Tesler 43 Normal distribution Math 186 / Winter 216 1 / 4 Normal distribution aka Bell curve and Gaussian distribution The normal distribution
Lecture 12. Some Useful Continuous Distributions. The most important continuous probability distribution in entire field of statistics.
 ENM 207 Lecture 12 Some Useful Continuous Distributions Normal Distribution The most important continuous probability distribution in entire field of statistics. Its graph, called the normal curve, is
Chapter 3 Discrete Random Variables and Probability Distributions
 Chapter 3 Discrete Random Variables and Probability Distributions Part 4: Special Discrete Random Variable Distributions Sections 3.7 & 3.8 Geometric, Negative Binomial, Hypergeometric NOTE: The discrete
**BEGINNING OF EXAMINATION** A random sample of five observations from a population is:
 **BEGINNING OF EXAMINATION** 1. You are given: (i) A random sample of five observations from a population is: 0.2 0.7 0.9 1.1 1.3 (ii) You use the Kolmogorov-Smirnov test for testing the null hypothesis,
Chapter 5. Continuous Random Variables and Probability Distributions. 5.1 Continuous Random Variables
 Chapter 5 Continuous Random Variables and Probability Distributions 5.1 Continuous Random Variables 1 2CHAPTER 5. CONTINUOUS RANDOM VARIABLES AND PROBABILITY DISTRIBUTIONS Probability Distributions Probability
Section 7.5 The Normal Distribution. Section 7.6 Application of the Normal Distribution
 Section 7.6 Application of the Normal Distribution A random variable that may take on infinitely many values is called a continuous random variable. A continuous probability distribution is defined by
Statistical Intervals. Chapter 7 Stat 4570/5570 Material from Devore s book (Ed 8), and Cengage
, and Cengage") 7 Statistical Intervals Chapter 7 Stat 4570/5570 Material from Devore s book (Ed 8), and Cengage Confidence Intervals The CLT tells us that as the sample size n increases, the sample mean X is close to
7 Statistical Intervals Chapter 7 Stat 4570/5570 Material from Devore s book (Ed 8), and Cengage Confidence Intervals The CLT tells us that as the sample size n increases, the sample mean X is close to
CHAPTER-1 BASIC CONCEPTS OF PROCESS CAPABILITY ANALYSIS
 CHAPTER-1 BASIC CONCEPTS OF PROCESS CAPABILITY ANALYSIS Manufacturing industries across the globe today face several challenges to meet international standards which are highly competitive. They also strive
Data Science Essentials
 Data Science Essentials Probability and Random Variables As data scientists, we re often concerned with understanding the qualities and relationships of a set of data points. For example, you may need
Chapter 7.2: Large-Sample Confidence Intervals for a Population Mean and Proportion. Instructor: Elvan Ceyhan
 1 Chapter 7.2: Large-Sample Confidence Intervals for a Population Mean and Proportion Instructor: Elvan Ceyhan Outline of this chapter: Large-Sample Interval for µ Confidence Intervals for Population Proportion
Class 12. Daniel B. Rowe, Ph.D. Department of Mathematics, Statistics, and Computer Science. Marquette University MATH 1700
 Class 12 Daniel B. Rowe, Ph.D. Department of Mathematics, Statistics, and Computer Science Copyright 2017 by D.B. Rowe 1 Agenda: Recap Chapter 6.1-6.2 Lecture Chapter 6.3-6.5 Problem Solving Session. 2
Favorite Distributions
 Favorite Distributions Binomial, Poisson and Normal Here we consider 3 favorite distributions in statistics: Binomial, discovered by James Bernoulli in 1700 Poisson, a limiting form of the Binomial, found
BIOSTATISTICS TOPIC 5: SAMPLING DISTRIBUTION II THE NORMAL DISTRIBUTION
 BIOSTATISTICS TOPIC 5: SAMPLING DISTRIBUTION II THE NORMAL DISTRIBUTION The normal distribution occupies the central position in statistical theory and practice. The distribution is remarkable and of great
Chapter 5. Discrete Probability Distributions. McGraw-Hill, Bluman, 7 th ed, Chapter 5 1
 Chapter 5 Discrete Probability Distributions McGraw-Hill, Bluman, 7 th ed, Chapter 5 1 Chapter 5 Overview Introduction 5-1 Probability Distributions 5-2 Mean, Variance, Standard Deviation, and Expectation
4 Random Variables and Distributions
 4 Random Variables and Distributions Random variables A random variable assigns each outcome in a sample space. e.g. called a realization of that variable to Note: We ll usually denote a random variable
2 of PU_2015_375 Which of the following measures is more flexible when compared to other measures?
 PU M Sc Statistics 1 of 100 194 PU_2015_375 The population census period in India is for every:- quarterly Quinqennial year biannual Decennial year 2 of 100 105 PU_2015_375 Which of the following measures
Normal distribution Approximating binomial distribution by normal 2.10 Central Limit Theorem
 1.1.2 Normal distribution 1.1.3 Approimating binomial distribution by normal 2.1 Central Limit Theorem Prof. Tesler Math 283 Fall 216 Prof. Tesler 1.1.2-3, 2.1 Normal distribution Math 283 / Fall 216 1
CHAPTER 8. Confidence Interval Estimation Point and Interval Estimates
 CHAPTER 8. Confidence Interval Estimation Point and Interval Estimates A point estimate is a single number, a confidence interval provides additional information about the variability of the estimate Lower
Chapter 6 Continuous Probability Distributions. Learning objectives
 Chapter 6 Continuous s Slide 1 Learning objectives 1. Understand continuous probability distributions 2. Understand Uniform distribution 3. Understand Normal distribution 3.1. Understand Standard normal
Chapter 4 Random Variables & Probability. Chapter 4.5, 6, 8 Probability Distributions for Continuous Random Variables
 Chapter 4.5, 6, 8 Probability for Continuous Random Variables Discrete vs. continuous random variables Examples of continuous distributions o Uniform o Exponential o Normal Recall: A random variable =
Chapter 3. Discrete Probability Distributions
 Chapter 3 Discrete Probability Distributions 1 Chapter 3 Overview Introduction 3-1 The Binomial Distribution 3-2 Other Types of Distributions 2 Chapter 3 Objectives Find the exact probability for X successes
Chapter 9 Theoretical Probability Models
 Making Hard Decisions Chapter 9 Theoretical Probability Models Slide 1 of 47 Theoretical Models Applied Theoretical Probability Models may be used when they describe the physical model "adequately" Examples:
IEOR 3106: Introduction to OR: Stochastic Models. Fall 2013, Professor Whitt. Class Lecture Notes: Tuesday, September 10.
 IEOR 3106: Introduction to OR: Stochastic Models Fall 2013, Professor Whitt Class Lecture Notes: Tuesday, September 10. The Central Limit Theorem and Stock Prices 1. The Central Limit Theorem (CLT See
IEOR 165 Lecture 1 Probability Review
 IEOR 165 Lecture 1 Probability Review 1 Definitions in Probability and Their Consequences 1.1 Defining Probability A probability space (Ω, F, P) consists of three elements: A sample space Ω is the set
Chapter 5 Basic Probability
 Chapter 5 Basic Probability Probability is determining the probability that a particular event will occur. Probability of occurrence = / T where = the number of ways in which a particular event occurs
Statistics (This summary is for chapters 17, 28, 29 and section G of chapter 19)
") Statistics (This summary is for chapters 17, 28, 29 and section G of chapter 19) Mean, Median, Mode Mode: most common value Median: middle value (when the values are in order) Mean = total how many = x
Statistics (This summary is for chapters 17, 28, 29 and section G of chapter 19) Mean, Median, Mode Mode: most common value Median: middle value (when the values are in order) Mean = total how many = x
MATH 264 Problem Homework I
 MATH Problem Homework I Due to December 9, 00@:0 PROBLEMS & SOLUTIONS. A student answers a multiple-choice examination question that offers four possible answers. Suppose that the probability that the
PROBABILITY AND STATISTICS
 Monday, January 12, 2015 1 PROBABILITY AND STATISTICS Zhenyu Ye January 12, 2015 Monday, January 12, 2015 2 References Ch10 of Experiments in Modern Physics by Melissinos. Particle Physics Data Group Review
Unit 5: Sampling Distributions of Statistics
 Unit 5: Sampling Distributions of Statistics Statistics 571: Statistical Methods Ramón V. León 6/12/2004 Unit 5 - Stat 571 - Ramon V. Leon 1 Definitions and Key Concepts A sample statistic used to estimate
Unit 5: Sampling Distributions of Statistics
 Unit 5: Sampling Distributions of Statistics Statistics 571: Statistical Methods Ramón V. León 6/12/2004 Unit 5 - Stat 571 - Ramon V. Leon 1 Definitions and Key Concepts A sample statistic used to estimate
Continuous random variables
 Continuous random variables probability density function (f(x)) the probability distribution function of a continuous random variable (analogous to the probability mass function for a discrete random variable),
Chapter 4 Probability Distributions
 Slide 1 Chapter 4 Probability Distributions Slide 2 4-1 Overview 4-2 Random Variables 4-3 Binomial Probability Distributions 4-4 Mean, Variance, and Standard Deviation for the Binomial Distribution 4-5
Some Discrete Distribution Families
 Some Discrete Distribution Families ST 370 Many families of discrete distributions have been studied; we shall discuss the ones that are most commonly found in applications. In each family, we need a formula
ECON 214 Elements of Statistics for Economists
 ECON 214 Elements of Statistics for Economists Session 7 The Normal Distribution Part 1 Lecturer: Dr. Bernardin Senadza, Dept. of Economics Contact Information: bsenadza@ug.edu.gh College of Education
Lecture 9. Probability Distributions. Outline. Outline
 Outline Lecture 9 Probability Distributions 6-1 Introduction 6- Probability Distributions 6-3 Mean, Variance, and Expectation 6-4 The Binomial Distribution Outline 7- Properties of the Normal Distribution
Chapter 2. Random variables. 2.3 Expectation
 Random processes - Chapter 2. Random variables 1 Random processes Chapter 2. Random variables 2.3 Expectation 2.3 Expectation Random processes - Chapter 2. Random variables 2 Among the parameters representing
A continuous random variable is one that can theoretically take on any value on some line interval. We use f ( x)
") Section 6-2 I. Continuous Probability Distributions A continuous random variable is one that can theoretically take on any value on some line interval. We use f ( x) to represent a probability density
Section 6-2 I. Continuous Probability Distributions A continuous random variable is one that can theoretically take on any value on some line interval. We use f ( x) to represent a probability density
Chapter 3 Common Families of Distributions. Definition 3.4.1: A family of pmfs or pdfs is called exponential family if it can be expressed as
 Lecture 0 on BST 63: Statistical Theory I Kui Zhang, 09/9/008 Review for the previous lecture Definition: Several continuous distributions, including uniform, gamma, normal, Beta, Cauchy, double exponential
No, because np = 100(0.02) = 2. The value of np must be greater than or equal to 5 to use the normal approximation.
 = 2. The value of np must be greater than or equal to 5 to use the normal approximation.") 1) If n 100 and p 0.02 in a binomial experiment, does this satisfy the rule for a normal approximation? Why or why not? No, because np 100(0.02) 2. The value of np must be greater than or equal to 5 to
1) If n 100 and p 0.02 in a binomial experiment, does this satisfy the rule for a normal approximation? Why or why not? No, because np 100(0.02) 2. The value of np must be greater than or equal to 5 to
MAS187/AEF258. University of Newcastle upon Tyne
 MAS187/AEF258 University of Newcastle upon Tyne 2005-6 Contents 1 Collecting and Presenting Data 5 1.1 Introduction...................................... 5 1.1.1 Examples...................................
Probability Distributions II
 Probability Distributions II Summer 2017 Summer Institutes 63 Multinomial Distribution - Motivation Suppose we modified assumption (1) of the binomial distribution to allow for more than two outcomes.
Lecture 9. Probability Distributions
 Lecture 9 Probability Distributions Outline 6-1 Introduction 6-2 Probability Distributions 6-3 Mean, Variance, and Expectation 6-4 The Binomial Distribution Outline 7-2 Properties of the Normal Distribution
MATH 3200 Exam 3 Dr. Syring
 . Suppose n eligible voters are polled (randomly sampled) from a population of size N. The poll asks voters whether they support or do not support increasing local taxes to fund public parks. Let M be
Chapter 5 Discrete Probability Distributions. Random Variables Discrete Probability Distributions Expected Value and Variance
 Chapter 5 Discrete Probability Distributions Random Variables Discrete Probability Distributions Expected Value and Variance.40.30.20.10 0 1 2 3 4 Random Variables A random variable is a numerical description
Probability. An intro for calculus students P= Figure 1: A normal integral
 Probability An intro for calculus students.8.6.4.2 P=.87 2 3 4 Figure : A normal integral Suppose we flip a coin 2 times; what is the probability that we get more than 2 heads? Suppose we roll a six-sided
The Binomial Distribution
 The Binomial Distribution Properties of a Binomial Experiment 1. It consists of a fixed number of observations called trials. 2. Each trial can result in one of only two mutually exclusive outcomes labeled
Normal distribution. We say that a random variable X follows the normal distribution if the probability density function of X is given by
 Normal distribution The normal distribution is the most important distribution. It describes well the distribution of random variables that arise in practice, such as the heights or weights of people,
Probability Theory. Mohamed I. Riffi. Islamic University of Gaza
 Probability Theory Mohamed I. Riffi Islamic University of Gaza Table of contents 1. Chapter 2 Discrete Distributions The binomial distribution 1 Chapter 2 Discrete Distributions Bernoulli trials and the
Section Introduction to Normal Distributions
 Section 6.1-6.2 Introduction to Normal Distributions 2012 Pearson Education, Inc. All rights reserved. 1 of 105 Section 6.1-6.2 Objectives Interpret graphs of normal probability distributions Find areas