AP Stats ~ Lesson 6B: Transforming and Combining Random variables
|
|
|
- Alexandra Bishop
- 5 years ago
- Views:
Transcription
1 AP Stats ~ Lesson 6B: Transforming and Combining Random variables OBJECTIVES: DESCRIBE the effects of transforming a random variable by adding or subtracting a constant and multiplying or dividing by a constant. FIND the mean and standard deviation of the sum or difference of independent random variables. FIND probabilities involving the sum or difference of independent Normal random variables.
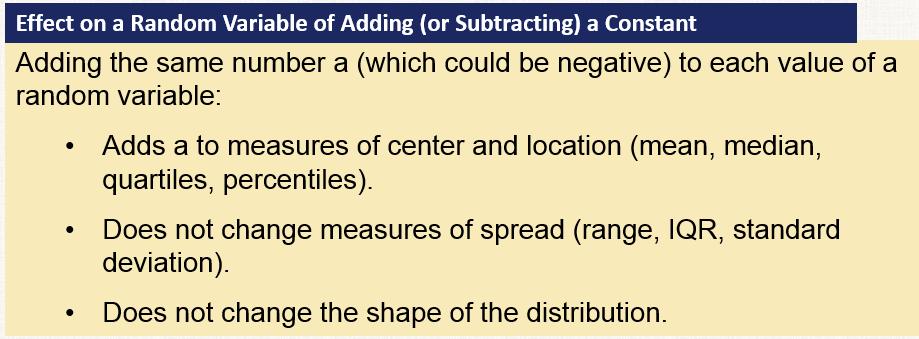
2 In Section 6.1, we learned that the mean and standard deviation give us important information about a random variable. In this section, we ll learn how the mean and standard deviation are affected by transformations on random variables. In Chapter 2, we studied the effects of linear transformations on the shape, center, and spread of a distribution of data. Recall: 1. Adding (or subtracting) a constant, a, to each observation: Adds a to measures of center and location. Does not change the shape or measures of spread. 2. Multiplying (or dividing) each observation by a constant, b: Multiplies (divides) measures of center and location by b. Multiplies (divides) measures of spread by b. Does not change the shape of the distribution.


3 Example: El Dorado Community College considers a student to be full-time if he or she is taking between 12 and 18 units. The number of units X that a randomly selected El Dorado Community College full-time student is taking in the fall semester has the following distribution. Here is a histogram of the probability distribution along with the mean and standard deviation: At El Dorado Community College, the tuition for full-time students is $50 per unit. That is, if T = tuition charge for a randomly selected full-time student, T = 50X. Here is the probability distribution for T and a histogram of the probability distribution: The mean and standard deviation of this distribution are 600(0.25) 650(0.10) (900)(0.15) $ T T 10,568 $103 What do you notice about the 2 distributions?

4 As with regular data, if we multiply a random variable by a negative constant b, our common measures of spread are multiplied by b.

5 Example: In addition to tuition charges, each full-time student at El Dorado Community College is assessed student fees of $100 per semester. If C = overall cost for a randomly selected full-time student, C = T. Here is the probability distribution for C and a histogram of the probability distribution: The mean and standard deviation of this distribution are What do you notice when you compare this to the distribution that was adjusted for tuition?
6
7 Check your understanding: A large auto dealership keeps track of sales made during each hour of the day. Let X= the number of cars sold during the first hour of business on a randomly selected Friday. Based on previous records, the probability distribution of X is as follows: Cars Sold: Probability: The random variable X has the mean 1.1 and standard deviation A) Suppose that the dealerships manager receives a $500 bonus from the company for each car sold. Let Y=the bonus received from car sales during the first hour on a randomly selected Friday. Find the mean and standard deviation of Y. B) To encourage customers to buy cars on Friday mornings, the manager spends $75 to provide coffee and doughnuts. The manager s net profit T on a randomly selected Friday is the bonus earned minus this $75 Find the mean and standard deviation of T.

8 Linear transformations have similar effects on other measures of center or location (median, quartiles, percentiles) and spread (range, IQR). Whether we re dealing with data or random variables, the effects of a linear transformation are the same. Note: These results apply to both discrete and continuous random variables.
9 Example: In a large introductory stats class, the distribution of raw scores on a test X follows a Normal distribution with a mean of 17.2 and a standard deviation of 3.8. The professor decides to scale the scores by multiplying the raw scores by 4 and adding 10. a) Define the variable Y to be the scaled score of a randomly selected student from this class. Find the mean and standard deviation of Y. b) What is the probability that a randomly selected student has a scaled test score of at least 90?


10 Many interesting statistics problems require us to examine two or more random variables and their relationship. Let s revisit El Dorado Community College. They also have a campus downtown, specializing in just a few fields of study. Full-time students at the downtown campus take only 3-unit classes. Let Y=number of units taken in the fall semester by a randomly selected full-time student at the downtown campus. Here is a probability distribution of Y and a probability histogram. The mean of this distribution in 15 units, and the standard deviation is 2.3 units. If you were to randomly select one full-time student from the main campus and one full-time student from the downtown campus and add their number of units, the expected value of the sum (S=X+Y) would be the mean of X plus the mean of Y = = 29.65
11 The only way to determine the probability for any value of T is if X and Y are independent random variables. If knowing whether any event involving X alone has occurred tells us nothing about the occurrence of any event involving Y alone, and vice versa, then X and Y are independent random variables. Probability models often assume independence when the random variables describe outcomes that appear unrelated to each other. You should always ask whether the assumption of independence seems reasonable. In our Community College example, it is reasonable to assume X and Y are independent since the campuses are in different parts of the town.

12 When we add two independent random variables, we find that their variances add. Standard deviations do not add. Remember that you can add variances only if the two random variables are independent, and that you can NEVER add standard deviations!


13 We can perform a similar investigation to determine what happens when we define a random variable as the difference of two random variables. In summary, we find the following:
14 Example: Let B=the amount spent on books in the fall semester for a randomly selected full-time student at El Dorado Community College. Suppose that the mean amount for B is 153 and the standard deviation of B is 32. Recall from earlier that C=overall cost of tuition and fees for a randomly selected full-time student at El Dorado Community College and that the mean amount was $ and the standard deviation is $103. Find the mean and standard deviation of the cost of tuition, fees, and books for a randomly selected full-time student.
15 Example: Let s return to the auto dealership. The dealership keeps track of sales and lease agreements made during each hour of the day. Let X = number of cars sold and Y = number of cars leased during the first hour of business on a randomly selected Friday. The mean of X is 1.1, and its SD is The mean of Y is 0.7, and its SD is Define D = X Y. Assume that X and Y are independent. A) Find and interpret the mean of D. B) Find and interpret the standard deviation of D. Show your work. C) The dealership s manager receives a $500 bonus for each car sold and a $300 bonus for each car leased. Find the mean and standard deviation of the difference in the manager s bonus for cars sold and leased.
16 If a random variable is Normally distributed, we can use its mean and standard deviation to compute probabilities. Any sum or difference of independent Normal random variables is also Normally distributed. What does this mean? We can use the process of normalizing the data using z-scores, and then find the area beneath the curve to determine probability.
17 Example: Suppose that a certain variety of apples have weights that follow a normal distribution with a mean of 9 ounces and a standard deviation of 1.5 ounces. If bags of apples are filled by randomly selecting 12 apples, what is the probability that the sum of the weights of the 12 apples is less than 100 ounces? Step 1: Find the new mean and standard deviation of the BAG of apples. Step 2: Using the new mean and SD, perform the calculations and find the probability that the sum of the weight of the apples is less than 100 ounces. (Don t forget to answer in the context of the problem.)
18 Example: To save time and money, many single people have decided to try speed dating. At a speed dating event, women sit in a circle and men spend about 10 minutes getting to know a woman before moving on to the next one. Suppose that the height M of male speed daters follows a Normal distribution with a mean of 69.5 inches and an SD of 4 inches, and that the height F of female speed daters follows a Normal distribution with a mean of 65 inches and an SD of 3 inches. What is the probability that a randomly selected male speed dater is taller than the randomly selected female speed dater with whom he is paired?
19 Homework: Page 382: #35-63 odds, 65, 66 Read pp
Chapter 6: Random Variables
 Chapter 6: Random Variables Section 6. The Practice of Statistics, 4 th edition For AP* STARNES, YATES, MOORE Chapter 6 Random Variables 6.1 Discrete and Continuous Random Variables 6. 6.3 Binomial and
EDCC charges $50 per credit. Let T = tuition charge for a randomly-selected fulltime student. T = 50X. Tuit. T $600 $650 $700 $750 $800 $850 $900
 Chapter 7 Random Variables n 7.1 Discrete and Continuous Random Variables n 6.2 n Example: El Dorado Community College El Dorado Community College considers a student to be full-time if he or she is taking
Section 6.2 Transforming and Combining Random Variables. Linear Transformations
 Section 6.2 Transforming and Combining Random Variables Linear Transformations In Section 6.1, we learned that the mean and standard deviation give us important information about a random variable. In
AP Statistics Chapter 6 - Random Variables
 AP Statistics Chapter 6 - Random 6.1 Discrete and Continuous Random Objective: Recognize and define discrete random variables, and construct a probability distribution table and a probability histogram
6.2.1 Linear Transformations
 6.2.1 Linear Transformations In Chapter 2, we studied the effects of transformations on the shape, center, and spread of a distribution of data. Recall what we discovered: 1. Adding (or subtracting) a
Section 7.4 Transforming and Combining Random Variables (DAY 1)
") Section 7.4 Learning Objectives (DAY 1) After this section, you should be able to DESCRIBE the effect of performing a linear transformation on a random variable (DAY 1) COMBINE random variables and CALCULATE
Section 7.4 Learning Objectives (DAY 1) After this section, you should be able to DESCRIBE the effect of performing a linear transformation on a random variable (DAY 1) COMBINE random variables and CALCULATE
Chapter 6: Random Variables
 Chapter 6: Random Variables Section 6.2 The Practice of Statistics, 4 th edition For AP* STARNES, YATES, MOORE Chapter 6 Random Variables 6.1 Discrete and Continuous Random Variables 6.2 6.3 Binomial and
Chapter 6: Random Variables
 Chapter 6: Random Variables Section 6.2 The Practice of Statistics, 4 th edition For AP* STARNES, YATES, MOORE Chapter 6 Random Variables 6.1 Discrete and Continuous Random Variables 6.2 6.3 Binomial and
CHAPTER 6 Random Variables
 CHAPTER 6 Random Variables 6.2 Transforming and Combining Random Variables The Practice of Statistics, 5th Edition Starnes, Tabor, Yates, Moore Bedford Freeman Worth Publishers 6.2 Reading Quiz (T or F)
CHAPTER 6 Random Variables
 CHAPTER 6 Random Variables 6.2 Transforming and Combining Random Variables The Practice of Statistics, 5th Edition Starnes, Tabor, Yates, Moore Bedford Freeman Worth Publishers Transforming and Combining
Honors Statistics. Daily Agenda
 Honors Statistics Daily Agenda 1. Review OTL C6#5 2. Quiz Section 6.1 A-Skip 35, 39, 40 Crickets The length in inches of a cricket chosen at random from a field is a random variable X with mean 1.2 inches
Honors Statistics. 3. Review OTL C6#3. 4. Normal Curve Quiz. Chapter 6 Section 2 Day s Notes.notebook. May 02, 2016.
 Honors Statistics Aug 23-8:26 PM 3. Review OTL C6#3 4. Normal Curve Quiz Aug 23-8:31 PM 1 May 1-9:09 PM Apr 28-10:29 AM 2 27, 28, 29, 30 Nov 21-8:16 PM Working out Choose a person aged 19 to 25 years at
Honors Statistics. Daily Agenda
 Honors Statistics Aug 23-8:26 PM Daily Agenda 1. Review OTL C6#4 Chapter 6.2 rules for means and variances Aug 23-8:31 PM 1 Nov 21-8:16 PM Working out Choose a person aged 19 to 25 years at random and
SECTION 6.2 (DAY 1) TRANSFORMING RANDOM VARIABLES NOVEMBER 16 TH, 2017
 TRANSFORMING RANDOM VARIABLES NOVEMBER 16 TH, 2017") SECTION 6.2 (DAY 1) TRANSFORMING RANDOM VARIABLES NOVEMBER 16 TH, 2017 TODAY S OBJECTIVES Describe the effects of transforming a random variable by: adding or subtracting a constant multiplying or dividing
SECTION 6.2 (DAY 1) TRANSFORMING RANDOM VARIABLES NOVEMBER 16 TH, 2017 TODAY S OBJECTIVES Describe the effects of transforming a random variable by: adding or subtracting a constant multiplying or dividing
Example - Let X be the number of boys in a 4 child family. Find the probability distribution table:
 Chapter7 Probability Distributions and Statistics Distributions of Random Variables tthe value of the result of the probability experiment is a RANDOM VARIABLE. Example - Let X be the number of boys in
STAT Chapter 6 The Standard Deviation (SD) as a Ruler and The Normal Model
 as a Ruler and The Normal Model") STAT 203 - Chapter 6 The Standard Deviation (SD) as a Ruler and The Normal Model In Chapter 5, we introduced a few measures of center and spread, and discussed how the mean and standard deviation are good
STAT 203 - Chapter 6 The Standard Deviation (SD) as a Ruler and The Normal Model In Chapter 5, we introduced a few measures of center and spread, and discussed how the mean and standard deviation are good
Example - Let X be the number of boys in a 4 child family. Find the probability distribution table:
 Chapter8 Probability Distributions and Statistics Section 8.1 Distributions of Random Variables tthe value of the result of the probability experiment is a RANDOM VARIABLE. Example - Let X be the number
STAT Chapter 6 The Standard Deviation (SD) as a Ruler and The Normal Model
 as a Ruler and The Normal Model") STAT 203 - Chapter 6 The Standard Deviation (SD) as a Ruler and The Normal Model In Chapter 5, we introduced a few measures of center and spread, and discussed how the mean and standard deviation are good
STAT 203 - Chapter 6 The Standard Deviation (SD) as a Ruler and The Normal Model In Chapter 5, we introduced a few measures of center and spread, and discussed how the mean and standard deviation are good
Example. Chapter 8 Probability Distributions and Statistics Section 8.1 Distributions of Random Variables
 Chapter 8 Probability Distributions and Statistics Section 8.1 Distributions of Random Variables You are dealt a hand of 5 cards. Find the probability distribution table for the number of hearts. Graph
Chapter 3. Lecture 3 Sections
 Chapter 3 Lecture 3 Sections 3.4 3.5 Measure of Position We would like to compare values from different data sets. We will introduce a z score or standard score. This measures how many standard deviation
Normal Model (Part 1)
") Normal Model (Part 1) Formulas New Vocabulary The Standard Deviation as a Ruler The trick in comparing very different-looking values is to use standard deviations as our rulers. The standard deviation
Normal Model (Part 1) Formulas New Vocabulary The Standard Deviation as a Ruler The trick in comparing very different-looking values is to use standard deviations as our rulers. The standard deviation
and their probabilities p
 AP Statistics Ch. 6 Notes Random Variables A variable is any characteristic of an individual (remember that individuals are the objects described by a data set and may be eole, animals, or things). Variables
22.2 Shape, Center, and Spread
 Name Class Date 22.2 Shape, Center, and Spread Essential Question: Which measures of center and spread are appropriate for a normal distribution, and which are appropriate for a skewed distribution? Eplore
Stats CH 6 Intro Activity 1
 Stats CH 6 Intro Activit 1 1. Purpose can ou tell the difference between bottled water and tap water? You will drink water from 3 samples. 1 of these is bottled water.. You must test them in the following
MULTIPLE CHOICE. Choose the one alternative that best completes the statement or answers the question.
 Exam Name The bar graph shows the number of tickets sold each week by the garden club for their annual flower show. ) During which week was the most number of tickets sold? ) A) Week B) Week C) Week 5
Honors Statistics. Daily Agenda
 Honors Statistics Aug 23-8:26 PM Daily Agenda 1. Review OTL C6#7 emphasis Normal Distributions Aug 23-8:31 PM 1 1. Multiple choice: Select the best answer for Exercises 65 and 66, which refer to the following
Some estimates of the height of the podium
 Some estimates of the height of the podium 24 36 40 40 40 41 42 44 46 48 50 53 65 98 1 5 number summary Inter quartile range (IQR) range = max min 2 1.5 IQR outlier rule 3 make a boxplot 24 36 40 40 40
7 THE CENTRAL LIMIT THEOREM
 CHAPTER 7 THE CENTRAL LIMIT THEOREM 373 7 THE CENTRAL LIMIT THEOREM Figure 7.1 If you want to figure out the distribution of the change people carry in their pockets, using the central limit theorem and
BIOL The Normal Distribution and the Central Limit Theorem
 BIOL 300 - The Normal Distribution and the Central Limit Theorem In the first week of the course, we introduced a few measures of center and spread, and discussed how the mean and standard deviation are
Chapter 7 Study Guide: The Central Limit Theorem
 Chapter 7 Study Guide: The Central Limit Theorem Introduction Why are we so concerned with means? Two reasons are that they give us a middle ground for comparison and they are easy to calculate. In this
STATISTICAL DISTRIBUTIONS AND THE CALCULATOR
 STATISTICAL DISTRIBUTIONS AND THE CALCULATOR 1. Basic data sets a. Measures of Center - Mean ( ): average of all values. Characteristic: non-resistant is affected by skew and outliers. - Median: Either
Chapter 6: Random Variables
 Chapter 6: Random Variables Section 6.1 Discrete and Continuous Random Variables The Practice of Statistics, 4 th edition For AP* STARNES, YATES, MOORE Chapter 6 Random Variables 6.1 Discrete and Continuous
CHAPTER 2 Describing Data: Numerical
 CHAPTER Multiple-Choice Questions 1. A scatter plot can illustrate all of the following except: A) the median of each of the two variables B) the range of each of the two variables C) an indication of
and µ Asian male > " men
 A.P. Statistics Sampling Distributions and the Central Limit Theorem Definitions A parameter is a number that describes the population. A parameter always exists but in practice we rarely know its value
Probability & Sampling The Practice of Statistics 4e Mostly Chpts 5 7
 Probability & Sampling The Practice of Statistics 4e Mostly Chpts 5 7 Lew Davidson (Dr.D.) Mallard Creek High School Lewis.Davidson@cms.k12.nc.us 704-786-0470 Probability & Sampling The Practice of Statistics
Honors Statistics. 3. Discuss homework C2# Discuss standard scores and percentiles. Chapter 2 Section Review day 2016s Notes.
 Honors Statistics Aug 23-8:26 PM 3. Discuss homework C2#11 4. Discuss standard scores and percentiles Aug 23-8:31 PM 1 Feb 8-7:44 AM Sep 6-2:27 PM 2 Sep 18-12:51 PM Chapter 2 Modeling Distributions of
Sampling Distributions
 AP Statistics Ch. 7 Notes Sampling Distributions A major field of statistics is statistical inference, which is using information from a sample to draw conclusions about a wider population. Parameter:
Both the quizzes and exams are closed book. However, For quizzes: Formulas will be provided with quiz papers if there is any need.
 Both the quizzes and exams are closed book. However, For quizzes: Formulas will be provided with quiz papers if there is any need. For exams (MD1, MD2, and Final): You may bring one 8.5 by 11 sheet of
AMS7: WEEK 4. CLASS 3
 AMS7: WEEK 4. CLASS 3 Sampling distributions and estimators. Central Limit Theorem Normal Approximation to the Binomial Distribution Friday April 24th, 2015 Sampling distributions and estimators REMEMBER:
NORMAL RANDOM VARIABLES (Normal or gaussian distribution)
") NORMAL RANDOM VARIABLES (Normal or gaussian distribution) Many variables, as pregnancy lengths, foot sizes etc.. exhibit a normal distribution. The shape of the distribution is a symmetric bell shape.
NORMAL RANDOM VARIABLES (Normal or gaussian distribution) Many variables, as pregnancy lengths, foot sizes etc.. exhibit a normal distribution. The shape of the distribution is a symmetric bell shape.
HUDM4122 Probability and Statistical Inference. February 23, 2015
 HUDM4122 Probability and Statistical Inference February 23, 2015 In the last class We studied Bayes Theorem and the Law of Total Probability Any questions or comments? Today Chapter 4.8 in Mendenhall,
LECTURE 6 DISTRIBUTIONS
 LECTURE 6 DISTRIBUTIONS OVERVIEW Uniform Distribution Normal Distribution Random Variables Continuous Distributions MOST OF THE SLIDES ADOPTED FROM OPENINTRO STATS BOOK. NORMAL DISTRIBUTION Unimodal and
Chapter 7: Random Variables
 Chapter 7: Random Variables 7.1 Discrete and Continuous Random Variables 7.2 Means and Variances of Random Variables 1 Introduction A random variable is a function that associates a unique numerical value
T.I.H.E. IT 233 Statistics and Probability: Sem. 1: 2013 ESTIMATION
 In Inferential Statistic, ESTIMATION (i) (ii) is called the True Population Mean and is called the True Population Proportion. You must also remember that are not the only population parameters. There
ECON 214 Elements of Statistics for Economists 2016/2017
 ECON 214 Elements of Statistics for Economists 2016/2017 Topic The Normal Distribution Lecturer: Dr. Bernardin Senadza, Dept. of Economics bsenadza@ug.edu.gh College of Education School of Continuing and
Statistics 511 Supplemental Materials
 Gaussian (or Normal) Random Variable In this section we introduce the Gaussian Random Variable, which is more commonly referred to as the Normal Random Variable. This is a random variable that has a bellshaped
Math 227 Elementary Statistics. Bluman 5 th edition
 Math 227 Elementary Statistics Bluman 5 th edition CHAPTER 6 The Normal Distribution 2 Objectives Identify distributions as symmetrical or skewed. Identify the properties of the normal distribution. Find
STAT 157 HW1 Solutions
 STAT 157 HW1 Solutions http://www.stat.ucla.edu/~dinov/courses_students.dir/10/spring/stats157.dir/ Problem 1. 1.a: (6 points) Determine the Relative Frequency and the Cumulative Relative Frequency (fill
Chapter 7: Sampling Distributions Chapter 7: Sampling Distributions
 Chapter 7: Sampling Distributions Objectives: Students will: Define a sampling distribution. Contrast bias and variability. Describe the sampling distribution of a proportion (shape, center, and spread).
Review of commonly missed questions on the online quiz. Lecture 7: Random variables] Expected value and standard deviation. Let s bet...
![Review of commonly missed questions on the online quiz. Lecture 7: Random variables] Expected value and standard deviation. Let s bet...](/thumbs/83/87696499.jpg "Review of commonly missed questions on the online quiz. Lecture 7: Random variables] Expected value and standard deviation. Let s bet...") Recap Review of commonly missed questions on the online quiz Lecture 7: ] Statistics 101 Mine Çetinkaya-Rundel OpenIntro quiz 2: questions 4 and 5 September 20, 2011 Statistics 101 (Mine Çetinkaya-Rundel)
Recap Review of commonly missed questions on the online quiz Lecture 7: ] Statistics 101 Mine Çetinkaya-Rundel OpenIntro quiz 2: questions 4 and 5 September 20, 2011 Statistics 101 (Mine Çetinkaya-Rundel)
STATISTICS - CLUTCH CH.9: SAMPLING DISTRIBUTIONS: MEAN.
 !! www.clutchprep.com SAMPLING DISTRIBUTIONS (MEANS) As of now, the normal distributions we have worked with only deal with the population of observations Example: What is the probability of randomly selecting
Math 243 Lecture Notes
 Assume the average annual rainfall for in Portland is 36 inches per year with a standard deviation of 9 inches. Also assume that the average wind speed in Chicago is 10 mph with a standard deviation of
Name: Homework Assignment Six Due Friday, Feb. 27 th
 Name: Homework Assignment Six Due Friday, Feb. 27 th Suggest Reading: Chapter 5 Section 1 3, Chapter 6 Section 1- Section 2 1. List the probability model for the below situations. (Remember to list the
Homework: Due Wed, Feb 20 th. Chapter 8, # 60a + 62a (count together as 1), 74, 82
, 74, 82") Announcements: Week 5 quiz begins at 4pm today and ends at 3pm on Wed If you take more than 20 minutes to complete your quiz, you will only receive partial credit. (It doesn t cut you off.) Today: Sections
Announcements: Week 5 quiz begins at 4pm today and ends at 3pm on Wed If you take more than 20 minutes to complete your quiz, you will only receive partial credit. (It doesn t cut you off.) Today: Sections
If the distribution of a random variable x is approximately normal, then
 Confidence Intervals for the Mean (σ unknown) In many real life situations, the standard deviation is unknown. In order to construct a confidence interval for a random variable that is normally distributed
HHH HHT HTH THH HTT THT TTH TTT
 AP Statistics Name Unit 04 Probability Period Day 05 Notes Discrete & Continuous Random Variables Random Variable: Probability Distribution: Example: A probability model describes the possible outcomes
Chapter 2. Section 2.1
 Chapter 2 Section 2.1 Check Your Understanding, page 89: 1. c 2. Her daughter weighs more than 87% of girls her age and she is taller than 67% of girls her age. 3. About 65% of calls lasted less than 30
Making Sense of Cents
 Name: Date: Making Sense of Cents Exploring the Central Limit Theorem Many of the variables that you have studied so far in this class have had a normal distribution. You have used a table of the normal
Normal distribution. We say that a random variable X follows the normal distribution if the probability density function of X is given by
 Normal distribution The normal distribution is the most important distribution. It describes well the distribution of random variables that arise in practice, such as the heights or weights of people,
Chapter 6. y y. Standardizing with z-scores. Standardizing with z-scores (cont.)
") Starter Ch. 6: A z-score Analysis Starter Ch. 6 Your Statistics teacher has announced that the lower of your two tests will be dropped. You got a 90 on test 1 and an 85 on test 2. You re all set to drop
Starter Ch. 6: A z-score Analysis Starter Ch. 6 Your Statistics teacher has announced that the lower of your two tests will be dropped. You got a 90 on test 1 and an 85 on test 2. You re all set to drop
In a binomial experiment of n trials, where p = probability of success and q = probability of failure. mean variance standard deviation
 Name In a binomial experiment of n trials, where p = probability of success and q = probability of failure mean variance standard deviation µ = n p σ = n p q σ = n p q Notation X ~ B(n, p) The probability
Homework: Due Wed, Nov 3 rd Chapter 8, # 48a, 55c and 56 (count as 1), 67a
, 67a") Homework: Due Wed, Nov 3 rd Chapter 8, # 48a, 55c and 56 (count as 1), 67a Announcements: There are some office hour changes for Nov 5, 8, 9 on website Week 5 quiz begins after class today and ends at
Homework: Due Wed, Nov 3 rd Chapter 8, # 48a, 55c and 56 (count as 1), 67a Announcements: There are some office hour changes for Nov 5, 8, 9 on website Week 5 quiz begins after class today and ends at
Review Problems for MAT141 Final Exam
 Review Problems for MAT141 Final Exam The following problems will help you prepare for the final exam. Answers to all problems are at the end of the review packet. 1. Find the area and perimeter of the
STAT:2010 Statistical Methods and Computing. Using density curves to describe the distribution of values of a quantitative
 STAT:10 Statistical Methods and Computing Normal Distributions Lecture 4 Feb. 6, 17 Kate Cowles 374 SH, 335-0727 kate-cowles@uiowa.edu 1 2 Using density curves to describe the distribution of values of
Math 140 Introductory Statistics. First midterm September
 Math 140 Introductory Statistics First midterm September 23 2010 Box Plots Graphical display of 5 number summary Q1, Q2 (median), Q3, max, min Outliers If a value is more than 1.5 times the IQR from the
Found under MATH NUM
 While you wait Edit the last line of your z-score program : Disp round(z, 2) Found under MATH NUM Bluman, Chapter 6 1 Sec 6.2 Bluman, Chapter 6 2 Bluman, Chapter 6 3 6.2 Applications of the Normal Distributions
ECON 214 Elements of Statistics for Economists
 ECON 214 Elements of Statistics for Economists Session 7 The Normal Distribution Part 1 Lecturer: Dr. Bernardin Senadza, Dept. of Economics Contact Information: bsenadza@ug.edu.gh College of Education
University of California, Los Angeles Department of Statistics. Normal distribution
 University of California, Los Angeles Department of Statistics Statistics 110A Instructor: Nicolas Christou Normal distribution The normal distribution is the most important distribution. It describes
NOTES: Chapter 4 Describing Data
 NOTES: Chapter 4 Describing Data Intro to Statistics COLYER Spring 2017 Student Name: Page 2 Section 4.1 ~ What is Average? Objective: In this section you will understand the difference between the three
Putting Things Together Part 1
 Putting Things Together Part 1 These exercise blend ideas from various graphs (histograms and boxplots), differing shapes of distributions, and values summarizing the data. Data for 1, 5, and 6 are in
Confidence Intervals for the Mean. When σ is known
 Confidence Intervals for the Mean When σ is known Objective Find the confidence interval for the mean when s is known. Intro Suppose a college president wishes to estimate the average age of students attending
Problem Set 08 Sampling Distribution of Sample Mean
 Problem Set 08 Sampling Distribution of Sample Mean MULTIPLE CHOICE. Choose the one alternative that best completes the statement or answers the question. Find the requested probability. 1) The table reports
The Central Limit Theorem: Homework
 The Central Limit Theorem: Homework EXERCISE 1 X N(60, 9). Suppose that you form random samples of 25 from this distribution. Let X be the random variable of averages. Let X be the random variable of sums.
CH 5 Normal Probability Distributions Properties of the Normal Distribution
 Properties of the Normal Distribution Example A friend that is always late. Let X represent the amount of minutes that pass from the moment you are suppose to meet your friend until the moment your friend
Using the Central Limit
 Using the Central Limit Theorem By: OpenStaxCollege It is important for you to understand when to use the central limit theorem. If you are being asked to find the probability of the mean, use the clt
Biostatistics and Design of Experiments Prof. Mukesh Doble Department of Biotechnology Indian Institute of Technology, Madras
 Biostatistics and Design of Experiments Prof. Mukesh Doble Department of Biotechnology Indian Institute of Technology, Madras Lecture - 05 Normal Distribution So far we have looked at discrete distributions
Percentiles, STATA, Box Plots, Standardizing, and Other Transformations
 Percentiles, STATA, Box Plots, Standardizing, and Other Transformations Lecture 3 Reading: Sections 5.7 54 Remember, when you finish a chapter make sure not to miss the last couple of boxes: What Can Go
VII The Normal Distribution
 MATHEMATICS 360-255-LW Quantitative Methods II Martin Huard Winter 2013 1. Find the area under the normal curve a) between z = 0 and z = 1.90 b) between z = -1.75 and z = 0 c) between z = 1.25 and z =
Introduction to Business Statistics QM 120 Chapter 6
 DEPARTMENT OF QUANTITATIVE METHODS & INFORMATION SYSTEMS Introduction to Business Statistics QM 120 Chapter 6 Spring 2008 Chapter 6: Continuous Probability Distribution 2 When a RV x is discrete, we can
Unit2: Probabilityanddistributions. 3. Normal distribution
 Announcements Unit: Probabilityanddistributions 3 Normal distribution Sta 101 - Spring 015 Duke University, Department of Statistical Science February, 015 Peer evaluation 1 by Friday 11:59pm Office hours:
Examples of continuous probability distributions: The normal and standard normal
 Examples of continuous probability distributions: The normal and standard normal The Normal Distribution f(x) Changing μ shifts the distribution left or right. Changing σ increases or decreases the spread.
STA Module 3B Discrete Random Variables
 STA 2023 Module 3B Discrete Random Variables Learning Objectives Upon completing this module, you should be able to 1. Determine the probability distribution of a discrete random variable. 2. Construct
What type of distribution is this? tml
 Warm Up Calculate the average Broncos score for the 2013 Season! 24, 27, 10, 10, 34, 37, 20, 51, 35, 31, 27, 28, 45, 33, 35, 52, 52, 37, 41, 49, 24, 26 What type of distribution is this? http://www.mathsisfun.com/data/quincunx.h
UNIVERSITY OF CAMBRIDGE INTERNATIONAL EXAMINATIONS General Certificate of Education Ordinary Level STATISTICS 4040/01
 UNIVERSITY OF CAMBRIDGE INTERNATIONAL EXAMINATIONS General Certificate of Education Ordinary Level STATISTICS 4040/01 Paper 1 Additional Materials: Answer Booklet/Paper Graph paper (2 sheets) Mathematical
Exam 1 Review. 1) Identify the population being studied. The heights of 14 out of the 31 cucumber plants at Mr. Lonardo's greenhouse.
 Identify the population being studied. The heights of 14 out of the 31 cucumber plants at Mr. Lonardo's greenhouse.") Exam 1 Review 1) Identify the population being studied. The heights of 14 out of the 31 cucumber plants at Mr. Lonardo's greenhouse. 2) Identify the population being studied and the sample chosen. The
Exam 1 Review 1) Identify the population being studied. The heights of 14 out of the 31 cucumber plants at Mr. Lonardo's greenhouse. 2) Identify the population being studied and the sample chosen. The
The Standard Deviation as a Ruler and the Normal Model. Copyright 2009 Pearson Education, Inc.
 The Standard Deviation as a Ruler and the Normal Mol Copyright 2009 Pearson Education, Inc. The trick in comparing very different-looking values is to use standard viations as our rulers. The standard
5.1 Mean, Median, & Mode
 5.1 Mean, Median, & Mode definitions Mean: Median: Mode: Example 1 The Blue Jays score these amounts of runs in their last 9 games: 4, 7, 2, 4, 10, 5, 6, 7, 7 Find the mean, median, and mode: Example 2
(j) Find the first quartile for a standard normal distribution.
 Find the first quartile for a standard normal distribution.") Examples for Chapter 5 Normal Probability Distributions Math 1040 1 Section 5.1 1. Heights of males at a certain university are approximately normal with a mean of 70.9 inches and a standard deviation
Examples for Chapter 5 Normal Probability Distributions Math 1040 1 Section 5.1 1. Heights of males at a certain university are approximately normal with a mean of 70.9 inches and a standard deviation
STA Rev. F Learning Objectives. What is a Random Variable? Module 5 Discrete Random Variables
 STA 2023 Module 5 Discrete Random Variables Learning Objectives Upon completing this module, you should be able to: 1. Determine the probability distribution of a discrete random variable. 2. Construct
work to get full credit.
 Chapter 18 Review Name Date Period Write complete answers, using complete sentences where necessary.show your work to get full credit. MULTIPLE CHOICE. Choose the one alternative that best completes the
AP Statistics Unit 1 (Chapters 1-6) Extra Practice: Part 1
 Extra Practice: Part 1") AP Statistics Unit 1 (Chapters 1-6) Extra Practice: Part 1 1. As part of survey of college students a researcher is interested in the variable class standing. She records a 1 if the student is a freshman,
AP Statistics Unit 1 (Chapters 1-6) Extra Practice: Part 1 1. As part of survey of college students a researcher is interested in the variable class standing. She records a 1 if the student is a freshman,
CHAPTER 6 Random Variables
 CHAPTER 6 Random Variables 6.1 Discrete and Continuous Random Variables The Practice of Statistics, 5th Edition Starnes, Tabor, Yates, Moore Bedford Freeman Worth Publishers Discrete and Continuous Random
Normal Distribution: Introduction
 Connexions module: m16979 1 Normal Distribution: Introduction Susan Dean Barbara Illowsky, Ph.D. This work is produced by The Connexions Project and licensed under the Creative Commons Attribution License
Chapter Six Probability Distributions
 6.1 Probability Distributions Discrete Random Variable Chapter Six Probability Distributions x P(x) 2 0.08 4 0.13 6 0.25 8 0.31 10 0.16 12 0.01 Practice. Construct a probability distribution for the number
AP * Statistics Review
 AP * Statistics Review Normal Models and Sampling Distributions Teacher Packet AP* is a trademark of the College Entrance Examination Board. The College Entrance Examination Board was not involved in the
Describing Data: One Quantitative Variable
 STAT 250 Dr. Kari Lock Morgan The Big Picture Describing Data: One Quantitative Variable Population Sampling SECTIONS 2.2, 2.3 One quantitative variable (2.2, 2.3) Statistical Inference Sample Descriptive
Lecture 6: Normal distribution
 Lecture 6: Normal distribution Statistics 101 Mine Çetinkaya-Rundel February 2, 2012 Announcements Announcements HW 1 due now. Due: OQ 2 by Monday morning 8am. Statistics 101 (Mine Çetinkaya-Rundel) L6:
Using the Central Limit Theorem It is important for you to understand when to use the CLT. If you are being asked to find the probability of the
 Using the Central Limit Theorem It is important for you to understand when to use the CLT. If you are being asked to find the probability of the mean, use the CLT for the mean. If you are being asked to
Random Variables. 6.1 Discrete and Continuous Random Variables. Probability Distribution. Discrete Random Variables. Chapter 6, Section 1
 6.1 Discrete and Continuous Random Variables Random Variables A random variable, usually written as X, is a variable whose possible values are numerical outcomes of a random phenomenon. There are two types
Name Period AP Statistics Unit 5 Review
 Name Period AP Statistics Unit 5 Review Multiple Choice 1. Jay Olshansky from the University of Chicago was quoted in Chance News as arguing that for the average life expectancy to reach 100, 18% of people