Second Quarter HH Consumption. Average. Growth of HH Consumption. Labour Force Ratio. Source: BPS (processed) Building Investment (rhs)
|
|
|
- Bonnie Hampton
- 6 years ago
- Views:
Transcription
1
2
3
4
 Building Investment")
 Source: BPS (processed) Source: Indonesia Cement")
5 HH Consumption Average Growth of HH Consumption Labour Force Ratio Quarter before fuel price hike Moments of fuel price hike Quarter after fuel price hike Source: BPS (processed) Building Investment (rhs) Moments of fuel price hike Non-Building Investment Quarter before fuel price hike Quarter after fuel price hike Domestic Sales Growth (rhs) Source: BPS (processed) Source: Indonesia Cement Association, Citiresearch

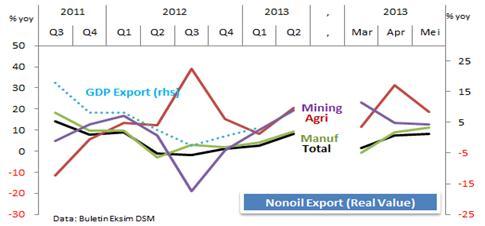
6 Exports
7
8
 %,yoy 250 Consumer Price Expectation Index (next 3 months) 20 Consumer Price Expectation Index")
9 Jan-02 May-02 Sep-02 Jan-03 May-03 Sep-03 Jan-04 May-04 Sep-04 Jan-05 May-05 Sep-05 Jan-06 May-06 Sep-06 Jan-07 May-07 Sep-07 Jan-08 May-08 Sep-08 Jan-09 May-09 Sep-09 Jan-10 May-10 Sep-10 Jan-11 May-11 Sep-11 Jan-12 May-12 Sep-12 Jan-13 May-13 Second Quarter 2013 %,yoy Consumer Price Index (CPI) %,yoy 250 Consumer Price Expectation Index (next 3 months) 20 Consumer Price Expectation Index (next 6 months) Consumer Price Expectation Index next 6 months (CMA 5) %,yoy Administered Prices Inflation Expectation (SPE 3 months), RHS Inflation Expectation (SPE 6 Months), RHS Expectation before policy is implemented Index
10
11 contracting expanding Second Quarter 2013 Index % thousands ribu ISM Manufacture ISM Services 35 Source: Bloomberg Date Jun Jan-08 Jul-08 Jan-09 Jul-09 Jan-10 Jul-10 Jan-11 Jul-11 Jan-12 Jul-12 Jan Monthly Change Nonfarm Payrolls (RHS) Unemployment Rate 5 Source Bloomberg Date May Jan-10 Jul-10 Jan-11 Jul-11 Jan-12 Jul-12 Jan

12 % yoy Unemployment (RHS) % Dept. Store Sales -8 Retail Sales Source: Bloomberg Date May 2013 Jan-11 Apr-11 Jul-11 Oct-11 Jan-12 Apr-12 Jul-12 Oct-12 Jan-13 Apr Index, level % yoy Index NBS PMI Manuf HSBC PMI Manuf 43 Source: Bloomberg Date Jun Jan-08 Jul-08 Jan-09 Jul-09 Jan-10 Jul-10 Jan-11 Jul-11 Jan-12 Jul-12 Jan Industrial Production -10 PMI Manufacturing (RHS) -15 Date May Source: Bloomberg Jan-09 Jul-09 Jan-10 Jul-10 Jan-11 Jul-11 Jan-12 Jul-12 Jan
13
14
")

15 Business Tendency Index (rhs) Income Capacity Utilization Working hour
16
17
18

19


20 1 M Premium 6 M premium 3 M premium 12 M premium


21
 Capacity Utilization in Manufacturing Sector *) global")
, oil price (WTI), gold, iron and")
22 Exchange Rate (dep (-)/apr (-), %, yoy Import Price Index (imported inflation proxy, & yoy) *) Core Tradable Inflation (% yoy, rhs) Capacity Utilization in Manufacturing Sector *) global price composit index-weighted average (based on imports percentage and weight in CPI basket) from food commodities (CPO, wheat, sugar, corn, and soybean), oil price (WTI), gold, iron and tissues

 Inflation Expectation 1")
")
23 CPI Inflation (rhs) Consumer Price Expectation Index 3 months ahead Consumer Price Expectation Index 6 months ahead Consumer Price Expectation Index 6 months ahead (CMA 5) Inflation Expectation 1 quarter ahead (Qt + 1) Inflation Expectation 2 quarter ahead (Qt + 2)

 5,35 5,39 5,39 5,42")
24 Jan-05 Jul-05 Jan-06 Jul-06 Jan-07 Jul-07 Jan-08 Jul-08 Jan-09 Jul-09 Jan-10 Jul-10 Jan-11 Jul-11 Jan-12 Jul-12 Jan Second Quarter 2013 Interest Rate (%) Quarter II-2012 Quarter III-2012 Quarter IV-2012 Quarter I-2013 Quarter II-2013 May Jun Jul Aug Sep Oct Nov Dec Jan Feb Mar Apr May Jun BI Rate 5,75 5,75 5,75 5,75 5,75 5,75 5,75 5,75 5,75 5,75 5,75 5,75 5,75 6,00 Deposit Guarantee 5,50 5,50 5,50 5,50 5,50 5,50 5,50 5,50 5,50 5,50 5,50 5,50 5,50 5,75 1-month Deposit (Weighted Average) 5,35 5,39 5,39 5,42 5,40 5,49 5,42 5,58 5,49 5,43 5,51 5,42 5,53 n.a Working Capital Credit 11,78 11,79 11,78 11,73 11,70 11,68 11,61 11,49 11,49 11,45 11,44 11,44 11,46 n.a Investment Credit 11,51 11,46 11,42 11,35 11,36 11,29 11,24 11,27 11,29 11,27 11,24 11,21 11,17 n.a Consumption Credit 14,03 13,90 13,92 13,69 13,67 13,60 13,53 13,58 13,40 13,22 13,28 13,22 13,20 n.a % Jan-13 Feb-13 Mar-13 Apr-13 Mei % Per Mei 2013 korelasi: rlps dan rdep :0.91 korelasi ; BI rate dan rdep: 0.87 % Selisih rkredit Spread - rdepo1: : 6,46% 6.46% Working Capital Investment Consumption Sb KMK Sb KI Sb KK Spread-rhs Sb Credit Kredit Interest Rate Sb 1-mo Dep Deposit 1 bln BI rate Sb LPS LPS Interest Rate Interest Rate Fund (rhs) Savings Demand Deposit Time Deposit Contribution to growth (%) Fund (rhs) Savings Demand Deposit Time Deposit As of May 2013 As of May 2013
25 Jan-11 Apr-11 Jul-11 Oct-11 Jan-12 Apr-12 Jul-12 Oct-12 Jan-13 Apr-13 Jan-08 Jun-08 Nop-08 Apr-09 Sep-09 Feb-10 Jul-10 Des-10 Mei-11 Okt-11 Mar-12 Agust-12 Jan-13 Feb-08 Apr-08 Jun-08 Agust-08 Okt-08 Des-08 Feb-09 Apr-09 Jun-09 Agust-09 Okt-09 Des-09 Feb-10 Apr-10 Jun-10 Agust-10 Okt-10 Des-10 Feb-11 Apr-11 Jun-11 Agust-11 Okt-11 Des-11 Feb-12 Apr-12 Jun-12 Agust-12 Okt-12 Des-12 Feb-13 Apr-13 Second Quarter % yoy Total Loan Kredit WC KMK IC KI KK As Per of May Mei % Contribution Kontribusi to Pertumbuhan growth Loan(rhs) Kredit (rhs) KMK WC IC KI CC KK As of May 2013 Per Mei %, yoy Agriculture Pertanian Manufacturing Industri Pengolahan Construction Konstruksi Transportation Pengangkutan Pertambangan Mining Listrik, Electricity Air dan Gas Perdagangan Trade Jasa Business Dunia Services Usaha -20
26 30 25 %, yoy % M2 M1 BI Rate (RHS) Rata-rata periode sebelum krisis Mei 2006-Sept 2008 M1: 21.5%, M2: 15,7% 0 Jan-11 Apr-11 Jul-11 Oct-11 Jan-12 Apr-12 Jul-12 Oct-12 Jan-13 Apr


27
 2.909,0 2.955,8 2.961,4 2.984,1 3.050,0 3.070,6 3.130,5 3.225,2 3.204,5 3.207,3 3.243,1 3.299,4 3.349,7 Credit * (T Rp) 2.386,1 2.452,9 2.470,1 2.510,6 2.555,9 2.585,4 2.")
 82,0 83,0 83,4 84,1 83,8 84,2 84,0 84,7 83,9 85,5 86,1 85,6 86,3 NPLs Gross* (%) 2,3 2,2 2,2 2,2 2,1 2,2 2,0 2,2 2,0 2,4 2,3 2,0 2,0 CAR (%) 17,9 17,5 17,3 17,3 17,4 17,3 17,4 17,4")
28 Main Indicators May Jun Jul Aug Sep Oct Nov Dec Jan Feb Mar Apr May Total Asset (T Rp) 3.827, , , , , , , , , , , , ,7 Third Party Fund (T Rp) 2.909, , , , , , , , , , , , ,7 Credit * (T Rp) 2.386, , , , , , , , , , , , ,1 LDR* (%) 82,0 83,0 83,4 84,1 83,8 84,2 84,0 84,7 83,9 85,5 86,1 85,6 86,3 NPLs Gross* (%) 2,3 2,2 2,2 2,2 2,1 2,2 2,0 2,2 2,0 2,4 2,3 2,0 2,0 CAR (%) 17,9 17,5 17,3 17,3 17,4 17,3 17,4 17,4 19,2 19,2 18,3 18,6 18,4 NIM (%) 5,3 5,4 5,4 5,4 5,5 5,5 5,5 5,5 5,5 5,3 5,2 5,4 5,4 ROA (%) 3,0 3,2 3,1 3,1 3,1 3,1 3,1 3,1 3,1 2,9 3,1 2,9 3,0 * without channeling
29
CONTENTS COMMENTARY CHARTS TABLES GLOSSARY. Section 1: Headline Inflation Section 2: Core Inflation
 COMMENTARY CONTENTS Section 1: Headline Inflation Section 2: Core Inflation CHARTS 1. National Rates of Inflation, January 2010 April 2013 2. Monthly Changes in the Cost-of-Living Index, January 2010 April
XML Publisher Balance Sheet Vision Operations (USA) Feb-02
 Feb-02") Page:1 Apr-01 May-01 Jun-01 Jul-01 ASSETS Current Assets Cash and Short Term Investments 15,862,304 51,998,607 9,198,226 Accounts Receivable - Net of Allowance 2,560,786
Page:1 Apr-01 May-01 Jun-01 Jul-01 ASSETS Current Assets Cash and Short Term Investments 15,862,304 51,998,607 9,198,226 Accounts Receivable - Net of Allowance 2,560,786
Revised October 17, 2016
 Revised October 17, 2016 60 ISM Manufacturing Purchasing Managers Index (September 2015 September 2016) 58 56 54 52 50 48 46 44 42 Sept-15 Oct Nov Dec Jan-16 Feb Mar Apr May Jun Jul Aug Sept Purchasing
APPENDIX: A SNAPSHOT OF INDONESIAN ECONOMIC INDICATORS
 APPENDIX: A SNAPSHOT OF INDONESIAN ECONOMIC INDICATORS Appendix Figure : Quarterly and annual GDP growth (percent growth) Appendix Figure : Contributions to GDP expenditures (quarter-on-quarter, seasonally
Economic Activity Index ( GDB-EAI ) For the month of May 2013 G O V E R N M E N T D E V E L O P M E N T B A N K F O R P U E R T O R I C O
 For the month of May 2013 G O V E R N M E N T D E V E L O P M E N T B A N K F O R P U E R T O R I C O") Economic Activity Index ( GDB-EAI ) For the month of May 2013 General Commentary May 2013 GDB-EAI for the month of May registered a 3.4% year-over-year ( YOY ) reduction May 2013 EAI was 126.7, a 3.4%
Economic Activity Index ( GDB-EAI ) For the month of May 2013 General Commentary May 2013 GDB-EAI for the month of May registered a 3.4% year-over-year ( YOY ) reduction May 2013 EAI was 126.7, a 3.4%
Chapter 1 International economy
 Chapter International economy. Main points from the OECD's Economic Outlook A broad-based recovery has taken hold Asia, the US and the UK have taken the lead. Continental Europe will follow Investment
FEDERAL RESERVE BANK OF MINNEAPOLIS BANKING AND POLICY STUDIES
 FEDERAL RESERVE BANK OF MINNEAPOLIS BANKING AND POLICY STUDIES Minneapolis Options Report December 13 th Commodity Markets Option trading rose relative to two weeks ago to a more average level last week
Business & Financial Services December 2017
 Business & Financial Services December 217 Completed Procurement Transactions by Month 2 4 175 15 125 1 75 5 2 1 Business Days to Complete 25 Jan Feb Mar Apr May Jun Jul Aug Sep Oct Nov Dec 217 Procurement
Quarterly Statistical Digest
 Quarterly Statistical Digest August Volume 27, No. 3 The Statistical Digest is a quarterly publication of the Central Bank of The Bahamas, prepared by the Research Department for issue in February, May,
1. Macroeconomic Highlights
 1. Macroeconomic Highlights ht Macroeconomic Highlights Resilient growth over the last 2 years, despite the global economic slowdown Banking industry robust with high level of CAR and low NPLN. In 2008
Indonesia Economic Outlook and Policy Challenges
 Indonesia Economic Outlook and Policy Challenges Daniel A. Citrin Asia and Pacific Department, IMF April 3, 28 Global Financial Stability Map: risks have risen; conditions have deteriorated October 27
OTHER DEPOSITS FINANCIAL INSTITUTIONS DEPOSIT BARKAT SAVING ACCOUNT
 WEIGHTAGES JAN FEB MAR APR MAY JUN JUL AUG SEPT OCT NOV DEC ANNOUNCEMENT DATE 19.Dez.14 27.Jän.15 24.Feb.15 26.Mär.15 27.Apr.15 26.Mai.15 25.Jun.15 28.Jul.15 26.Aug.15 23.Sep.15 27.Okt.15 25.Nov.15 MUDARIB
Macro Research Economic outlook
 Macro Research Economic outlook Macroeconomic Research Itaú Unibanco April 2017 Roadmap Global Economy The global outlook remains favorable Global growth positive momentum continues, with a synchronized
Fall 2017 Crop Outlook Webinar
 Fall 2017 Crop Outlook Webinar Chris Hurt, Professor & Extension Ag. Economist James Mintert, Professor & Director, Center for Commercial Agriculture Fall 2017 Crop Outlook Webinar October 13, 2017 50%
BNM Maintains OPR at 3.25%, Hawkish About Economic Outlook
 7 March 2018 ECONOMIC REVIEW March 2018 BNM MPC BNM Maintains OPR at 3.25%, Hawkish About Economic Outlook Overnight Policy Rate maintained at 3.25%. In line with our expectation, overnight policy rate,
TERMS OF REFERENCE FOR THE INVESTMENT COMMITTEE
 I. PURPOSE The purpose of the Investment Committee (the Committee ) is to recommend to the Board the investment policy, including the asset mix policy and the appropriate benchmark for both ICBC and any
ANALYST MEETING. PT Bank Tabungan Negara (Persero) Tbk. Business & Financial Performances as of December 31, Jakarta, February 26 th 2015
 Tbk. Business & Financial Performances as of December 31, Jakarta, February 26 th 2015") ANALYST MEETING PT Bank Tabungan Negara (Persero) Tbk. Business & Financial Performances as of December 31, 2014 Jakarta, February 26 th 2015 Disclaimer IMPORTANT: The following forms part of, and should
ANALYST MEETING PT Bank Tabungan Negara (Persero) Tbk. Business & Financial Performances as of December 31, 2014 Jakarta, February 26 th 2015 Disclaimer IMPORTANT: The following forms part of, and should
Monthly Labour Force Survey Statistics December 2018
 800 Monthly Labour Force Survey Statistics CALGARY CMA Table 282-0135 Labour force survey estimates (LFS), by census metropolitan area based on 2011 census boundaries, 3-month moving average, seasonally
Monthly Labour Force Survey Statistics November 2018
 800 Monthly Labour Force Survey Statistics CALGARY CMA Table 282-0135 Labour force survey estimates (LFS), by census metropolitan area based on 2011 census boundaries, 3-month moving average, seasonally
INDONESIAN BANKING CLUSTER
 University of Indonesia MICRO ECONOMIC OF COMPETITIVENESS INDONESIAN BANKING CLUSTER Rudy Siahaan - 8605210388 M. Taufiek Gunawan - 8605210272 Pantja Savitri - 8605210302 Mas Wigrantoro Roes Setiyadi -
PRELIMINARY IMPACT OF GLOBAL CRISIS IN INDONESIA
 PRELIMINARY IMPACT OF GLOBAL CRISIS IN INDONESIA 1 Preliminary Impacts Up to January 2009, some economic indicators still showed strong results while others started to reflect impact at early stage GDP
Executive Summary. July 17, 2015
 Executive Summary July 17, 2015 The Revenue Estimating Conference adopted interest rates for use in the state budgeting process. The adopted interest rates take into consideration current benchmark rates
Spheria Australian Smaller Companies Fund
 29-Jun-18 $ 2.7686 $ 2.7603 $ 2.7520 28-Jun-18 $ 2.7764 $ 2.7681 $ 2.7598 27-Jun-18 $ 2.7804 $ 2.7721 $ 2.7638 26-Jun-18 $ 2.7857 $ 2.7774 $ 2.7690 25-Jun-18 $ 2.7931 $ 2.7848 $ 2.7764 22-Jun-18 $ 2.7771
The President s Report to the Board of Directors
 The President s Report to the Board of Directors April 4, 214 Current Economic Developments - April 4, 214 Data released since your last Directors' meeting show the economy was a bit stronger in the fourth
Economic Outlook: Global and India. Ajit Ranade IEEMA T & D Conclave December 12, 2014
 Economic Outlook: Global and India Ajit Ranade IEEMA T & D Conclave December 12, 2014 Global scenario US expected to drive global growth in 2015 Difference from % YoY Growth October Actual October Projections
PT. BANK RAKYAT INDONESIA (PERSERO) Tbk. Full Year 2005 Financial Result
 Tbk. Full Year 2005 Financial Result") PT. BANK RAKYAT INDONESIA (PERSERO) Tbk. Full Year 2005 Financial Result 1 2005 Performance Indonesia s Macro Economy in 2005 Early 2005 was full of optimism on the prospects of Indonesian Economy Global
PT. BANK RAKYAT INDONESIA (PERSERO) Tbk. Full Year 2005 Financial Result 1 2005 Performance Indonesia s Macro Economy in 2005 Early 2005 was full of optimism on the prospects of Indonesian Economy Global
APPENDIX ECONOMIC INDICATORS DEVELOPED ECONOMIES
 16 QUARTERLY INVESTMENT STRATEGY APPENDIX ECONOMIC INDICATORS DEVELOPED ECONOMIES Purchasing Managers Index EMERGING ECONOMIES Purchasing Managers Index US Eurozone Japan Brazil Russia India China Industrial
ECONOMIC AND FINANCIAL HIGHLIGHTS
 ECONOMIC AND FINANCIAL HIGHLIGHTS LABOR MARKET Contributions to Change in Nonfarm Payrolls 2 Unemployment and Labor Force Participation Rate 3 MANUFACTURING ISM Manufacturing Index 4 CONSUMERS Light Vehicle
Nonfarm Payroll Employment
 PRESIDENT'S REPORT TO THE BOARD OF DIRECTORS, FEDERAL RESERVE BANK OF BOSTON Current Economic Developments - June 10, 2004 Data released since your last Directors' meeting show the economy continues to
Poland s Economic Prospects
 Poland s Economic Prospects Unicredit Conference Warsaw, June 8, 11 Mark Allen Senior IMF Resident Representative for Central and Eastern Europe Recovery is driven by domestic demand Contributions to Real
Key Commodity Themes. Maxwell Gold Director of Investment Strategy. Gradient Investments Elite Advisor Forum October 5 th, 2017
 Key Commodity Themes Maxwell Gold Director of Investment Strategy Gradient Investments Elite Advisor Forum October 5 th, 2017 2001 2002 2002 2003 2004 2005 2006 2007 2007 2008 2009 2010 2011 2012 2012
Portuguese Banking System: latest developments. 2 nd quarter 2018
 Portuguese Banking System: latest developments 2 nd quarter 218 Lisbon, 218 www.bportugal.pt Prepared with data available up to 26 th September of 218. Macroeconomic indicators and banking system data
Adaptive Responses to Rapid Economic Change
 Indonesia Economic Outlook 218 Adaptive Responses to Rapid Economic Change Hendri Saparini, Ph.D Senior Economist and Founder of CORE Indonesia Presented at KEB Hana Bank Economic Outlook 218 November
Commodity Price Outlook & Risks
 Commodity Outlook & Risks Research Department, Commodities Team 1 December 22, 20 www.imf.org/commodities commodities@imf.org This monthly report presents a price outlook and risk assessment for selected
Consolidated financial results for 2Q 2017
 Citi Handlowy Strategy and Investor Relations Department Consolidated financial results for 2Q 2017 August 22 nd, 2017 2Q 2017 summary Consistent growth of customer business: Loan volume growth in institutional
Earnings Conference Call First Quarter 2018
 Earnings Conference Call First Quarter 2018 1Q16 2Q16 3Q16 4Q16 1Q17 2Q17 3Q17 4Q17 1Q18 Mar-08 Mar-09 Mar-10 Mar-11 Mar-12 Mar-13 Mar-14 Mar-15 Mar-16 Mar-17 Mar-18 2008 2009 2010 2011 2012 2013 2014
FOR RELEASE: MONDAY, MARCH 21 AT 4 PM
 Interviews with 1,012 adult Americans conducted by telephone by Opinion Research Corporation on March 18-20, 2011. The margin of sampling error for results based on the total sample is plus or minus 3
Business Cycle Index July 2010
 Business Cycle Index July 2010 Bureau of Trade and Economic Indices, Ministry of Commerce, Tel. 0 2507 5805, Fax. 0 2507 5806, www.price.moc.go.th Thailand economic still expansion. Medium-run Leading
Managing Global Shocks: The Case of Indonesia
 Managing Global Shocks: The Case of Indonesia Dr. Hartadi A. Sarwono Deputy Governor IIF Asian Regional Economic Forum Singapore, March 5, 2009 Outline 2 1. Crisis highlights 2. Macroconomic Condition
Quarterly Statistical Digest
 Quarterly Statistical Digest February 2019 Volume 28, No. 1 The Statistical Digest is a quarterly publication of the Central Bank of The Bahamas, prepared by the Research Department for issue in February,
Inflation rate in Camarines Sur increases to 6.8 percent in September 2017
 Inflation Rate (in Percent) [ Inflation rate in Camarines Sur increases to 6.8 percent in September Date of Release: October 30, Reference No. -83 The provincial headline inflation rate in September increased
WESTWOOD LUTHERAN CHURCH Summary Financial Statement YEAR TO DATE - February 28, Over(Under) Budget WECC Fund Actual Budget
 Budget WECC Fund Actual Budget") WESTWOOD LUTHERAN CHURCH Summary Financial Statement YEAR TO DATE - February 28, 2018 General Fund Actual A B C D E F WECC Fund Actual Revenue Revenue - Faith Giving 1 $ 213 $ 234 $ (22) - Tuition $ 226
WESTWOOD LUTHERAN CHURCH Summary Financial Statement YEAR TO DATE - February 28, 2018 General Fund Actual A B C D E F WECC Fund Actual Revenue Revenue - Faith Giving 1 $ 213 $ 234 $ (22) - Tuition $ 226
Development of Economy and Financial Markets of Kazakhstan
 Development of Economy and Financial Markets of Kazakhstan National Bank of Kazakhstan Macroeconomic development GDP, real growth, % 116 112 18 14 1 113,5 11,7 216,7223,8226,5 19,8 19,8 19,3 19,619,7 199,
U.S. ECONOMIC UPDATE. MACRO February 5, 2014
 U.S. ECONOMIC UPDATE MACRO February 5, 2014 LEGAL DISCLAIMER Hedgeye Risk Management is a registered investment advisor, registered with the State of Connecticut. Hedgeye Risk Management is not a broker
BANK OF GUYANA. BANKING SYSTEM STATISTICAL ABSTRACT Website:
 BANK OF GUYANA BANKING SYSTEM STATISTICAL ABSTRACT Website: www.bankofguyana.org.gy RESEARCH DEPARTMENT November 2010 STATISTICAL ABSTRACT TABLES CONTENTS 1. MONETARY AUTHORITY 1.1 Bank of Guyana: Assets
Common stock prices 1. New York Stock Exchange indexes (Dec. 31,1965=50)2. Transportation. Utility 3. Finance
2. Transportation. Utility 3. Finance") Digitized for FRASER http://fraser.stlouisfed.org/ Federal Reserve Bank of St. Louis 000 97 98 99 I90 9 9 9 9 9 9 97 98 99 970 97 97 ""..".'..'.."... 97 97 97 97 977 978 979 980 98 98 98 98 98 98 987 988
Digitized for FRASER http://fraser.stlouisfed.org/ Federal Reserve Bank of St. Louis 000 97 98 99 I90 9 9 9 9 9 9 97 98 99 970 97 97 ""..".'..'.."... 97 97 97 97 977 978 979 980 98 98 98 98 98 98 987 988
Commodity Price Outlook & Risks
 Commodity Outlook & Risks Research Department, Commodities Team 1 September 18, 20 www.imf.org/commodities commodities@imf.org This monthly report presents a price outlook and risk assessment for selected
Industry Trends Watch
 Costing Trends - Alberta Asphalt Cement (Edmonton Rack $C/t) The Edmonton rack price for asphalt cement surged to $730 per tonne in early May. The rack price index averaged $655 per tonne in April and
Global Markets Group. Trade Performance: Depressed by the Eid holiday Author: Juniman Chief Economist. Economic Research. Trade Outlook Monthly Report
 Global Markets Group Trade Outlook Monthly Report Economic Research August 2016 Trade Performance: Depressed by the Eid holiday Author: Juniman Chief Economist Trade Highlights Exports in June 2016 rose
Historical Pricing PJM COMED, Around the Clock. Cal '15 Cal '16 Cal '17 Cal '18 Cal '19 Cal '20 Cal '21 Cal '22
 $50 Historical Pricing PJM COMED, Around the Clock $48 $46 $44 $42 $40 $38 $36 $34 $32 $30 $28 $26 Cal '15 Cal '16 Cal '17 Cal '18 Cal '19 Cal '20 Cal '21 Cal '22 The information presented above was gathered
INDONESIA. The Real Economy
 INDONESIA Macroeconomic stability is strengthening in Indonesia. The external environment is likely to be supportive for the economy. This positive trend is reflected in the recent upgrade of Indonesia
ECONOMIC & REVENUE UPDATE
 January 11, 2018 Summary summary The U.S. labor market gained 148,000 net new jobs in December. U.S. housing starts in November 2017 were 12.9% above their year-ago level. Consumer confidence declined
Zenith Monthly Economic Report October 2011
 Zenith Monthly Economic Report October 211 ECONOMIC STATISTICS SUMMARY Cash Rate Inflation Rate (%) Unemployment Rate (%) GDP Annual Growth (%) Country Latest Last Change Latest Change Latest Change Past
Indonesia Economic Quarterly June 2017 Upgraded. Hans Anand Beck Acting Lead Economist, Indonesia
 Indonesia Economic Quarterly June 2017 Upgraded Hans Anand Beck Acting Lead Economist, Indonesia June 15, 2017 Key Takeaways S&P upgrade acknowledged strong economic fundamentals and management. S&P returned
PHOENIX ENERGY MARKETING CONSULTANTS INC. HISTORICAL NATURAL GAS & CRUDE OIL PRICES UPDATED TO July, 2018
 Jan-01 $12.9112 $10.4754 $9.7870 $1.5032 $29.2595 $275.39 $43.78 $159.32 $25.33 Feb-01 $10.4670 $7.8378 $6.9397 $1.5218 $29.6447 $279.78 $44.48 $165.68 $26.34 Mar-01 $7.6303 $7.3271 $5.0903 $1.5585 $27.2714
The Long Journey to Recovery. Russia Economic Report April 2016 Edition No. 35
 The Long Journey to Recovery Russia Economic Report April 216 Edition No. 35 1 2 3 The anticipated recovery was delayed and the economy adjusted through a sharp income drop. The government s policy response
Inflation rate in Camarines Sur decreases to 5.1 percent in December 2017
 Inflation Rate (in Percent) [ Inflation rate in Camarines Sur decreases to 5.1 percent in ember Date of Release: January 11, 2018 Reference No. 2018-4 The provincial headline inflation rate in ember decreased
BANK OF GUYANA. BANKING SYSTEM STATISTICAL ABSTRACT Website:
 BANK OF GUYANA BANKING SYSTEM STATISTICAL ABSTRACT Website: www.bankofguyana.org.gy RESEARCH DEPARTMENT March 2010 STATISTICAL ABSTRACT TABLES CONTENTS 1. MONETARY AUTHORITY 1.1 Bank of Guyana: Assets
FEDERAL RESERVE BANK OF MINNEAPOLIS BANKING AND POLICY STUDIES
 FEDERAL RESERVE BANK OF MINNEAPOLIS BANKING AND POLICY STUDIES Minneapolis Options Report Feb 1 th Median inflation expectations decreased over the two week period for both inflation tenors. The probability
Snapshot of SA Economy
 Snapshot of SA Economy Kgotso Radira 1 September 29 Economic Outlook Global share indices 2 Indices 18 16 14 12 1 8 6 4 25 26 27 28 29 S&P 5 FTSE 1 DAX Nikkei 3 Global interest rates 7 % 6 5 4 3 2 1 1999
Bank Rakyat Indonesia(BBRI IJ)
") Equity Research Company Update Monday,27 August 2018 BUY Maintain Last price (IDR) 3,270 Target Price (IDR) 4,350 Upside/Downside +33.0% Previous Target Price (IDR) 4,350 Stock Statistics Sector Bloomberg
Equity Research Company Update Monday,27 August 2018 BUY Maintain Last price (IDR) 3,270 Target Price (IDR) 4,350 Upside/Downside +33.0% Previous Target Price (IDR) 4,350 Stock Statistics Sector Bloomberg
Weekly Macroeconomic Review
 20/12/2011 Weekly Macroeconomic Review Expectations derived from the capital market Our forecast Inflation in the coming months Future cumulative inflation next 12 CPIs (through November 2012 CPI) Inflation
Commodity Price Outlook & Risks
 Commodity Outlook & Risks Research Department, Commodities Team March, 2 www.imf.org/commodities commodities@imf.org This monthly report presents a price outlook and risk assessment for selected commodities
Commodity Price Outlook & Risks
 Commodity Outlook & Risks Research Department, Commodities Team 1 December 17, 20 www.imf.org/commodities commodities@imf.org This monthly report presents a price outlook and risk assessment for selected
MONETARY POLICY COMMITTEE STATEMENT FOR THIRD QUARTER Governor s Presentation to the Media. 16 th November, 2016
 1 MONETARY POLICY COMMITTEE STATEMENT FOR THIRD QUARTER 2016 Governor s Presentation to the Media 16 th November, 2016 INTRODUCTION 2 This presentation is structured as follows: 1. Decision of the Monetary
Review of Registered Charites Compliance Rates with Annual Reporting Requirements 2016
 Review of Registered Charites Compliance Rates with Annual Reporting Requirements 2016 October 2017 The Charities Regulator, in accordance with the provisions of section 14 of the Charities Act 2009, carried
TICKER Price (Rp.) Mkt. Cap (%) TARGET P/E (X) ROE (%) EPS g (%) 13-Sep-11 (Rpbn) to JCI Rec Price
 Mkt. Cap (%) TARGET P/E (X) ROE (%) EPS g (%) 13-Sep-11 (Rpbn) to JCI Rec Price") September 16, 2011 TRIM Sector Update Bank: Strong Result Amid Global Uncertainty Hanel Topada Era Tania Equity Analyst hanel.tania@trimegah.com (021) 2924-9098 Loans Growth Pull Back on Seasonality Banking
September 16, 2011 TRIM Sector Update Bank: Strong Result Amid Global Uncertainty Hanel Topada Era Tania Equity Analyst hanel.tania@trimegah.com (021) 2924-9098 Loans Growth Pull Back on Seasonality Banking
Portuguese Banking System: latest developments. 1 st quarter 2018
 Portuguese Banking System: latest developments 1 st quarter 218 Lisbon, 218 www.bportugal.pt Prepared with data available up to 27 th June of 218. Macroeconomic indicators and banking system data are quarterly
Historical Pricing PJM PSEG, Around the Clock. Cal '15 Cal '16 Cal '17 Cal '18 Cal '19 Cal '20 Cal '21 Cal '22
 $70 Historical Pricing PJM PSEG, Around the Clock $65 $60 $55 $50 $45 $40 $35 $30 $25 Cal '15 Cal '16 Cal '17 Cal '18 Cal '19 Cal '20 Cal '21 Cal '22 The information presented above was gathered and compiled
Economic Outlook Economic Intelligence Center 27 th November 2015
 Economic Outlook 2016 Economic Intelligence Center 27 th November 2015 Global outlook Domestic outlook 2 In 2016, recovery pace in most regions are expected to pick up except for China Eurozone 2.0 1.5
Single-family home sales and construction are not expected to regain 2005 peaks
 Single-family home sales and construction are not expected to regain 25 peaks Millions of units 8. 7. 6. 5. Housing starts (right axis) 4. Home sales (left axis) 3. 2. 1. 198 1985 199 1995 2 25 21 215
PT Bank Rakyat Indonesia (Persero) Tbk.
 Tbk.") PT Bank Rakyat Indonesia (Persero) Tbk. Q2-2014 Financial Update Presentation Maintaining profitability in a challenging environment Jakarta, 22 July 2014 Outline Macro Economy Q2 2014 - a maintained performance
PT Bank Rakyat Indonesia (Persero) Tbk. Q2-2014 Financial Update Presentation Maintaining profitability in a challenging environment Jakarta, 22 July 2014 Outline Macro Economy Q2 2014 - a maintained performance
Looking at a Variety of Municipal Valuation Metrics
 Looking at a Variety of Municipal Valuation Metrics Muni vs. Treasuries, Corporates YEAR MUNI - TREASURY RATIO YEAR MUNI - CORPORATE RATIO 200% 80% 175% 150% 75% 70% 65% 125% Average Ratio 0% 75% 50% 60%
The labor market has continued to strengthen and economic activity has been expanding at a moderate pace this year.
 Current Economic Climate Overview The Federal Reserve publishes a report (known as the Beige Book) eight times per year that summarizes current economic conditions throughout the twelve Federal Reserve
Banco do Brasil. 2Q10 Conference Call
 Banco do Brasil 2Q10 Conference Call 1 Disclaimer This presentation may include references and statements, planned synergies, increasing estimates, projections of results and future strategy for Banco
NMI at 60.3% Business Activity Index at 64.9% New Orders Index at 63.8% Employment Index at 59.6%
 FOR RELEASE: 10:00 A.M. ET August 5, 2015 Contact: Kristina Cahill Report On Business Analyst ISM, ROB/Research Tempe, Arizona 800/888-6276, Ext. 3015 E-mail: kcahill@instituteforsupplymanagement.org DO
Russia: Macro Outlook for 2019
 October 2018 Russia: Macro Outlook for 2019 Natalia Orlova Head of Alfa Bank Macro Insights +7 495 795 36 77 norlova@alfabank.ru Egypt Saudi Arabia Brazil S. Africa UAE Iraq China Japan US Mexico UK Russia
Factor Leave Accruals. Accruing Vacation and Sick Leave
 Factor Leave Accruals Accruing Vacation and Sick Leave Factor Leave Accruals As part of the transition of non-exempt employees to biweekly pay, the UC Office of the President also requires standardization
Camarines Sur Consumer Price Index
 Inflation Rates (in Percent) Camarines Sur Consumer Price Index SR No. - 50 JULY Inflation rate in Camarines Sur increases to 6.4 percent in April The provincial headline inflation rate in Camarines Sur
Capturing equity gains whilst protecting portfolios
 Capturing equity gains whilst protecting portfolios Edward Park Q2 2018 MSCI North America Total Return in USD (2017 Discrete Calendar Months) 4.00% 3.50% 3.00% 2.50% 2.00% 1.50% 1.00% 0% 0.00% Jan-17
Consumer Price Index, Jobless Claims, Housing Starts Each of These Reports Have Favorable Aspects to Note
 Consumer Price Index, Jobless Claims, Housing Starts Each of These Reports Have Favorable Aspects to Note January 19, Asha G. Bangalore agb3@ntrs.com The Consumer Price Index (CPI) held steady in December,
ECONOMIC AND FINANCIAL HIGHLIGHTS
 ECONOMIC AND FINANCIAL HIGHLIGHTS FEDERAL RESERVE BALANCE SHEET Assets and Liabilities 2-3 REAL ESTATE Construction Spending 4 CoreLogic Home Price Index 5 Mortgage Rates and Applications 6-7 CONSUMER
China Sourcing Update
 Fung Business Intelligence China Sourcing Update July 13, 2018 Major Price Indicators 1. CPI growth inches up in June The year-on-year growth rate of China s consumer price index (CPI) 1 increased slightly
GRAIN HEDGE POSITION REPORT
 GRAIN HEDGE POSITION REPORT CROP: Corn DATE: April 16, 2006 LONG POSITION SHORT POSITION Total Grain on Hand 753896 Grain in Transit Total Offsite Grain Total Stocks 753896 Unpriced Grain Storage 106375
February Economic Activity Index ( GDB-EAI )
") February 2015 Economic Activity Index ( GDB-EAI ) General Commentary February 2015 In February 2015, the GDB-EAI registered a 1.6% year-over-year (y-o-y) reduction, and a month-over-month (m-o-m) increase
February 2015 Economic Activity Index ( GDB-EAI ) General Commentary February 2015 In February 2015, the GDB-EAI registered a 1.6% year-over-year (y-o-y) reduction, and a month-over-month (m-o-m) increase
Economic Chartpack Astor Investment Manangement LLC
 Economic Chartpack Astor Investment Manangement LLC April 16, 2019 name last last ref mo release date bbg survey Jobless Claims 196.00 Apr Thu, Apr 18 205.90 Retail Sales -0.20 Feb Thu, Apr 18 0.90 Markit
HUD NSP-1 Reporting Apr 2010 Grantee Report - New Mexico State Program
 HUD NSP-1 Reporting Apr 2010 Grantee Report - State Program State Program NSP-1 Grant Amount is $19,600,000 $9,355,381 (47.7%) has been committed $4,010,874 (20.5%) has been expended Grant Number HUD Region
I. MONETARY POLICY STATEMENT
 I. MONETARY POLICY STATEMENT The global economic recovery is moving forward although overshadowed with uncertainty. Differences have emerged in the pace of global recovery, with growth slackening in advanced
26 Febuary Macro Overview. Landsbankinn Economic Research
 Febuary 8 Inflation Jan 8 Dec 7 Jan 7 CPI YoY..9.9 Contribution of individual components : Imp. goods excl. alcohol, tobacco and petrol -. -. -. Petrol... Housing..7.8 Domestic goods excl. agricultural
Thailand Key Economic and Financial Indicators
 - YoY 4 3 2 1-1 -2-3 -4-5 -6 TH: Price : Monthly Growth YoY 4 3 PPI 2 CPI1 Core CPI -1-2 -3-4 -5-6 THB/Litre 31 29 27 23 TH: Daily Petroleum Retail Price (Bangkok) THB/Litre 31 29 E1 27 HSD 23 Th THB 2
Eurozone Economic Watch. February 2018
 Eurozone Economic Watch February 2018 Eurozone: Strong growth continues in 1Q18, but confidence seems to peak GDP growth moderated slightly in, but there was an upward revision to previous quarters. Available
PPI Inched Up 0.1% in Jun-18 Driven By Rising Commodity Price
 31 July 2018 ECONOMIC REVIEW June 2018 Producer Price Index Inched Up 0.1% in Jun-18 Driven By Rising Commodity Price grew for the first time in 2018. Malaysia s producer prices increased by 0.1%yoy in
Introduction to Fuel Hedging. 23 rd April 2010
 Introduction to Fuel Hedging 23 rd April 2010 1 NAB Commodity Risk Management National Australia Bank & YB/CB is at the forefront of helping our global banking clients manage the impact of commodity prices
Performance Report October 2018
 Structured Investments Indicative Report October 2018 This report illustrates the indicative performance of all Structured Investment Strategies from inception to 31 October 2018 Matured Investment Strategies
Regional Economic Outlook
 Regional Economic Outlook Caucasus and Central Asia Azim Sadikov International Monetary Fund Resident Representative November 6, 2013 Outline Global Outlook CCA: Recent Developments, Outlook, and Risks
Financial & Business Highlights For the Year Ended June 30, 2017
 Financial & Business Highlights For the Year Ended June, 17 17 16 15 14 13 12 Profit and Loss Account Operating Revenue 858 590 648 415 172 174 Investment gains net 5 162 909 825 322 516 Other 262 146
GIMA Pulse Date of Report: 04/12/2017 a monthly snapshot of the UK Economy from
 GIMA Pulse Date of Report: 04/12/2017 a monthly snapshot of the UK Economy from www.barometeroftrade.com Summary Inflation has slowed after reaching a 5-year-high last month, largely due to the weak performance
Record first quarter earnings
 Record first quarter earnings DBS Group Holdings 2015 financial results April 27, 2015 Disclaimer: The information contained in this document is intended only for use during the presentation and should
KCB INVESTOR PRESENTATION Q317 GROUP FINANCIAL RESULTS NOVEMBER 2017 JOSHUA OIGARA GROUP CEO & MD LAWRENCE KIMATHI GROUP CFO
 KCB INVESTOR PRESENTATION Q317 GROUP FINANCIAL RESULTS NOVEMBER 2017 JOSHUA OIGARA GROUP CEO & MD LAWRENCE KIMATHI GROUP CFO Macro-Economic Highlights: Kenya GDP Anchored by Non-Agriculture GDP Growth
SACU INFLATION REPORT. February 2017
 SACU INFLATION REPORT February 2017 The content of this publication is intended for general information only. While precaution is taken to ensure the accuracy of information, the SACU Secretariat shall