Monthly US Lamb Market Update
|
|
|
- Arron McCarthy
- 5 years ago
- Views:
Transcription

1 August 2018 Monthly US Lamb Market Update November 2018 Issue Prepared Exclusively for Meat & Livestock Australia - Sydney November 27, 2018 USA Domes c Lamb Market - Supply/Demand Situa on High prices, higher domes c produc on, more imports and compe on from other proteins have caused lamb to back up in freezers during the last few months. The total inventory of lamb and mu on at the end of October was es mated by USDA to be 39.3 million pounds, 24.5% higher than a year ago and 19.6% higher than the five year average. This is the largest supply of lamb in cold storage for this me of year since The supply/demand table on page 9 shows es mated US disappearance of lamb and mu on for 2018 at 409 million pounds. The current supply of lamb in cold storage is higher than 10% of disappearance when we consider that the supply/demand numbers are calculated on a carcass wt. basis while the cold storage numbers are product weight. It will take some me to work down the large inventory of lamb and mu on in cold storage. We think it is unlikely that we will see a notable reduc on in the inventory during November and December considering the recent increase in lamb imports from Australia and New Zealand and domes c slaughter trends. US domes c lamb slaughter seasonally increases in Q4 in order to support higher retail holiday features. Ample supplies of lamb in cold storage and slow sales have nega vely impacted slaughter in recent weeks. As a result we expect to see more downward price pressure on domes c lamb product. In the four weeks ending November 24 lamb slaughter in the US averaged 37,300 head/wk., 0.5% lower than a year ago. There were fewer lambs on feed in Colorado in October and November, which should limit the number of lambs coming to market later in the year and in Q1 of next year. According to a private survey of feedlots in the largest lamb feeding state, total inventory on November 1 was down 8% compared to a year ago but s ll above the five year average. Retail features increase in November, ahead of Thanksgiving holiday, and they are significantly higher into Christmas. The increase coincides with religious holidays but also because parts of the popula on like to serve lamb rather than turkey during this me. Retail features for the week ending November 16 were up 14% compared to the previous year but they remained below year ago levels. The retail price of lamb racks was 4.5% higher than the previous year while the price of loin chops was up 14%. On the other hand, semi-bnls legs were promoted widely at a 16% price reduc on from the same week last year. THOUSAND POUNDS 45,000 40,000 LAMB AND MUTTON, COLD STORAGE STOCKS, THOUSAND POUNDS, END OF MONTH INVENTORIES 35,000 30,000 25,000 20,000 15,000 Weekly USA Lamb & Sheep Slaughter '000 Head/Week. Source: USDA. Compiled and Analysis by Steiner Consulting LAMB AND MUTTON, COLD STORAGE STOCKS JAN FEB MAR APR MAY JUN JUL AUG SEP OCT NOV DEC Avg Yr Jan Feb Mar Apr May Jun Jul Aug Sep Oct Nov Dec
2 Page 2 Imported Lamb Supply and Price Trends US lamb imports are now nega ve for the year. Ample freezer inventories and lower prices in the domes c market have made it more difficult to ship product into the US market. Demand from other markets has diverted more Australian and New Zealand product away from the US in recent months. Shipments from Australia con nued to trend lower in October and early November. According to USDA, imports of Australian lamb in the four weeks ending November 17 averaged 838 MT/wk, 21% lower than the same four week period a year ago. Imports of New Zealand lamb during this period averaged 334 MT per week, 3% lower than last year. Goat meat imports remain par cularly limited and they are down 26% for the year. Imports have improved modestly in recent weeks, however. In the four weeks ending November 17, US imports of Australian goat meat averaged 191 MT/week, 10% higher than a year ago. Australia so far this year accounts for over 96% of all US goat meat imports. The decline in supplies available from Australia and New Zealand, strong foodservice demand and the seasonal improvement in retail business con nues to drive prices higher. Those end users that were able to secure inventory earlier in the year now have a very strong compe ve edge as supplies in the spot market are par cularly ght. The price of Australian lamb racks has surged higher in recent weeks and fresh/chilled racks are now around US$12 per pound, 34% higher than a year ago. US YTD Lamb Imported Volume. Metric Ton Data updated through November 3, 2018 Northern Ireland Australian Lamb Racks, Fresh, Cap-off, 28 oz/up. 4-WK Moving Avg. Weekly Prices. Source: USDA 1,300 1,200 1,100 1, Total Australia New Zealand Canada Chile Iceland Uruguay Spain Mexico -2.9% -1.3% ,000 20,000 30,000 40,000 50,000 60,000 70,000 80,000 Mexico Northern New Spain Uruguay Iceland Chile Canada Ireland Zealand Australia Total ,233 48,654 71, ,888 49,283 73, Jan Feb Mar Apr May Jun Jul Aug Sep Oct Nov Dec -1.9%
3 Page 3 US Domestic Lamb Cut and Primal Values Weekly Prices from USDA. Wt. Average 11/9/ /2/2018 w/w 11/10/2017 y/y US$/cwt US$/cwt % ch. US$/cwt % ch. Foresaddle 204 Rack, 8-Rib, Medium % % 209 Breast % % 207 Shoulders, Square Cut % % 210 Foreshank % % Neck % % Foresaddle Value % % Hindsaddle 232 Loin, Trimmed, 4x % % 232E Flank, Untrimmed % % 233A Leg, Trotter Off % % Hindsaddle Value % % Carcass Value % % Hindsaddle, Foresaddle and Total Lamb Cutout Value Source: USDA Mandatory Price Reporting System 500 Foresaddle Value Hindsaddle Value 450 Lamb Cutout
4 Page 4 Domestic Lamb Cutout Value, USA Source: Agricultural Marketin Service, USDA. $ per 100 lb. Dressed Carcass Yr Avg. % ch. vs. Yr Ago % ch. vs. 5-Yr Avg. Jan % 5.7% Feb % 8.3% Mar % 8.2% Apr % 8.1% May % 7.6% Jun % 8.2% Jul % 7.8% Aug % 5.7% Sep % 6.2% Oct % 6.0% Nov Dec Note: Monthly Cutout Value Calculated Using Weekly Data USA Domestic Lamb Cutout Value Monthly Avg. Price; Source: USDA Yr Avg Jan Feb Mar Apr May Jun Jul Aug Sep Oct Nov Dec
5 Page 5 Slaughter Lamb Price, Sioux Falls, SD Basis Monthly Average Prices, lb., $ per 100 lb Yr. Avg. % ch. vs. Yr Ago. % ch. vs. 5-Yr Avg. Jan % 4.5% Feb % 9.6% Mar % 13.7% Apr % 7.2% May % 4.0% Jun % 1.2% Jul % -4.5% Aug % -10.7% Sep % -11.2% Oct % -11.6% Nov Dec Source: USDA Slaughter Lamb Price, Sioux Falls, SD Basis Monthly Average Prices, lb., $ per 100 lb Yr. Avg Jan Feb Mar Apr May Jun Jul Aug Sep Oct Nov Dec
6 Page 6 Imported Lamb Price Summary Source: USDA Agricultural Marketing Service, Mandatory Price Reporting 2018 YTD Volume 2018 YTD Wt. Avg. $ 2018 YTD Implied Value Nov 13, 2017 Nov 5, 2018 Nov 12, 2018 % ch. vs. Week Ago % ch. vs. Year Ago Fresh/Chilled Pounds $/lb. Total $ AUS Shortloin, 1-Rib, 0x0 5,761,568 $ 5.52 $ 31,787,613 $ 5.52 $ 5.74 $ % -5.6% AUS Shoulder, Square-cut 2,642,298 $ 3.03 $ 8,011,007 $ 3.01 $ 3.01 $ % 7.4% AUS Rack, FR, Cap-off, 28 oz/up 3,439,878 $ $ 35,971,287 $ 9.46 $ $ % 33.9% AUS Shortloin, 1-Rib, 1x1 77,951 $ 5.26 $ 409,914 $ 5.85 $ - $ - n/a n/a AUS Leg, semi bnls 512,429 $ 4.14 $ 2,118,952 $ 4.22 $ 4.25 $ % -9.6% AUS Rack, FR, Cap-off, oz 695,268 $ $ 8,133,379 $ $ $ % 20.1% AUS Rack, FR, Cap-off, oz 319,686 $ $ 3,745,768 $ $ $ % 15.5% AUS Foreshank, VP 275,679 $ 3.54 $ 976,464 $ 3.71 $ 3.55 $ % -7.9% Subtotal 13,724,757 $ 6.64 $ 91,154,386 $ 6.29 $ 6.95 $ % 12.8% Frozen AUS Leg, Long 6,795,996 $ 2.39 $ 16,254,213 $ 3.66 $ 3.67 $ % 3.5% AUS Leg, bnls 5,861,387 $ 2.39 $ 14,018,877 $ 3.85 $ 3.77 $ % 0.2% AUS Shoulder, Square-cut, bnls 2,268,199 $ 2.39 $ 5,424,928 $ 3.88 $ 3.77 $ % -5.3% AUS Shoulder, Square-cut 4,943,590 $ 2.39 $ 11,823,751 $ 2.57 $ 2.65 $ % 4.7% AUS Foreshank, LP 1,935,771 $ 2.39 $ 4,629,849 $ 2.46 $ 2.95 $ % 13.2% AUS Hindshank, VP 594,157 $ 2.39 $ 1,421,065 $ 2.43 $ 2.84 $ % 14.9% AUS Rack, FR, Cap-off, 28 oz/up 809,711 $ 2.39 $ 1,936,613 $ 9.77 $ $ % 33.2% AUS Hindshank, LP 373,722 $ 2.39 $ 893,844 $ 2.48 $ 2.77 $ % 43.6% AUS Rack, FR, Cap-off, oz 797,666 $ 2.39 $ 1,907,805 $ 9.64 $ $ % 23.1% AUS Rack, FR, Cap-off, oz 901,717 $ 2.39 $ 2,156,667 $ 9.44 $ $ % 26.3% NZ Rack, FR, Cap-off, oz 3,083,525 $ 2.39 $ 7,374,971 $ 9.94 $ $ % 23.0% NZ Rack, FR, Cap-off, oz 2,005,027 $ 2.39 $ 4,795,491 $ $ $ % 23.8% NZ Rack, FR, Cap-off, 20 oz/up 1,023,549 $ 2.39 $ 2,448,057 $ 9.87 $ $ % 21.6% NZ Rack, FR, Cap-off, 12 oz/dn 92,078 $ 2.39 $ 220,226 $ - $ $ % #DIV/0! Subtotal 31,486,095 $ 2.39 $ 75,306,355 $ 5.12 $ 5.81 $ % 14.3% Please note that the prices, volume and sales value reported above represents only subset of total US lamb imports. It only reflects the data reported through the Mandatory Price Repor ng System. It is only for nego ated sales, no formula sales. Trade from smaller importers and traders is not included in the summary above. Data that does not meet the confiden ality guidelines also is not included in the above table.
7 Page 7 USA LAMB & MUTTON QUARTERLY SLAUGHTER, PRODUCTION, IMPORTS, EXPORTS AND DISAPPEARANCE. CARCASS WT. EQUIVALENT (CWE) =A x B A B C D E F G =C+D-E+F+G Year & Quarter Slaughter % ch. Avg. Carc. Wt. % ch. Comm. Lamb Prod. % ch. Imports % ch. Exports % ch. Farm Production Adj. to End. Stocks to Balance Total Disapp. % ch. 000 Head Y/Y Lbs. Y/Y (Mil. Lbs.) Y/Y (Mil. Lbs.) Y/Y (Mil. Lbs.) Y/Y (Mil. Lbs.) (Mil. Lbs.) (Mil. Lbs.) Y/Y st Qtr % % % % % % 2nd Qtr % % % % % % 3rd Qtr % % % % % % 4th Qtr % % % % % % Year 2, % % % % % % st Qtr % % % % % % 2nd Qtr % % % % % % 3rd Qtr % % % % % % 4th Qtr % % % % % % Year 2, % % % % % % st Qtr % % % % % % 2nd Qtr % % % % % % 3rd Qtr % % % % % % 4th Qtr % % % % % % Year 2, % % % % % % st Qtr % % % % % % 2nd Qtr % % % % % % 3rd Qtr % % % % % % 4th Qtr % % % % % % Year 2, % % % % % % st Qtr % % % % % % 2nd Qtr % % % % % % 3rd Qtr % % % % % % 4th Qtr % % % % % % Year 2, % % % % % % st Qtr % % % % % % 2nd Qtr % % % % % % 3rd Qtr % % % % % % * 4th Qtr % % % % % % * Year 2, % % % % % % 2019 * 1st Qtr % % % % % % * 2nd Qtr % % % % % % * 3rd Qtr % % % % % % * 4th Qtr % % % % % % * Year 2, % % % % % % * Estimates Source: This balance sheet was developed and is maintained by the Livestock Market Informa on Center
8 Page 8 Lamb & Sheep Slaughter. Monthly. '000 Head Yr Avg. % ch Yr Ago % ch 5-Yr Avg. Jan % 1.8% Feb % -0.6% Mar % 1.1% Apr % -6.6% May % 4.0% Jun % -5.5% Jul % -4.8% Aug % 6.2% Sep % -6.8% Oct Nov Dec Source: USDA Lamb & Sheep Slaughter. Monthly. '000 Head Monthly Data. Source: USDA Yr Avg Jan Feb Mar Apr May Jun Jul Aug Sep Oct Nov Dec
9 Page 9 Lamb Yearling Dressed Weights. Monthly. Avg. Pounds per Carcass Yr Avg. % ch Yr Ago % ch 5-Yr Avg. Jan % 2.3% Feb % 2.5% Mar % 1.2% Apr % 1.2% May % -1.4% Jun % 1.2% Jul % 1.4% Aug % 1.2% Sep % 5.1% Oct Nov Dec Source: USDA Lamb Yearling Dressed Weights. Monthly. Avg. Pounds per Carcass Monthly Data. Source: USDA Yr Avg Jan Feb Mar Apr May Jun Jul Aug Sep Oct Nov Dec Source: USDA
10 Page 10 Lamb Yearling Production. Monthly. Carcass Wt. Basis. Million Lb Yr Avg. % ch Yr Ago % ch 5-Yr Avg. Jan % 2.5% Feb % -2.0% Mar % 1.0% Apr % -5.9% May % 2.2% Jun % -5.8% Jul % -6.0% Aug % 1.9% Sep % -5.5% Oct Nov Dec Source: USDA Lamb Yearling Production. Monthly. Carcass Wt. Basis. Million Lb. Monthly Data. Source: USDA Yr Avg Jan Feb Mar Apr May Jun Jul Aug Sep Oct Nov Dec
11 Page 11 Y/Y Ch. in Sep. 18 vs. Sep 17 US Mutton, Goat, Lamb Imports Source: USDA/FAS Units: Metric Tons World Total 281 Australia(*) 589 Mexico Iceland Other Canada -1 Chile New Zealand(*) Change in total imports: 3% -1,200-1, Quantity of US Imports of Fr/Frz Mutton, Goat, Lamb: World Total Source: USDA/FAS. Units: Metric Ton. Analysis by: Steiner Consulting ( ) 18,000 16,000 14,000 12,000 10,000 8,000 6,000 4,000 2,000 5-Yr Avg
12 Page 12 Y/Y Ch. in Sep. 18 vs. Sep 17 US Mutton, Goat, Lamb Import Value ($) Source: USDA/FAS Units: US Dollars World Total Iceland Mexico -3,105,448 Change in total import value: -5% 551, ,531 New Zealand(*) 284,921 Other 121,564 Chile 43,833 Canada -16,108 Australia(*) -4,378,892-5,000,000-4,000,000-3,000,000-2,000,000-1,000, ,000,000 $ Value of US Imports of Fr/Frz Mutton, Goat, Lamb: World Total Source: USDA/FAS. Units: US Dollars. Analysis by: Steiner Consulting ( ) 120,000, ,000, ,000,000 90,000,000 80,000,000 70,000,000 60,000,000 50,000,000 40,000,000 30,000, Yr Avg 20,000,000
13 Page 13 TOP US LAMB IMPORT MARKETS IN 2018 TOP US LAMB IMPORT MARKETS IN 2017 Total Volume and Country Shares for Period Jan - Sep 2018, MT Total Volume and Country Shares for Period Jan - Sep 2017, MT New Zealand 21% New Zealand 24% 99K 97K Australia 79% Australia 76% Quantity of US Imports of Fr/Frz Mutton, Goat, Lamb: Australia(*) Source: USDA/FAS. Units: Metric Ton. Analysis by: Steiner Consulting ( ) 14,000 12,000 10,000 8,000 6,000 4,000 2, Yr Avg Quantity of US Imports of Fr/Frz Mutton, Goat, Lamb: New Zealand(*) Source: USDA/FAS. Units: Metric Ton. Analysis by: Steiner Consulting ( ) 4,500 4,000 3,500 3,000 2,500 2,000 1,500 1, Yr Avg $ Value of US Imports of Fr/Frz Mutton, Goat, Lamb: Australia(*) Source: USDA/FAS. Units: US Dollars. Analysis by: Steiner Consulting ( ) 90,000,000 80,000,000 70,000,000 60,000,000 50,000, Yr Avg $ Value of US Imports of Fr/Frz Mutton, Goat, Lamb: New Zealand(*) Source: USDA/FAS. Units: US Dollars. Analysis by: Steiner Consulting ( ) 35,000,000 30,000,000 25,000,000 20,000,000 40,000,000 30,000,000 20,000,000 15,000,000 10,000,000 10,000,000-5,000, Yr Avg

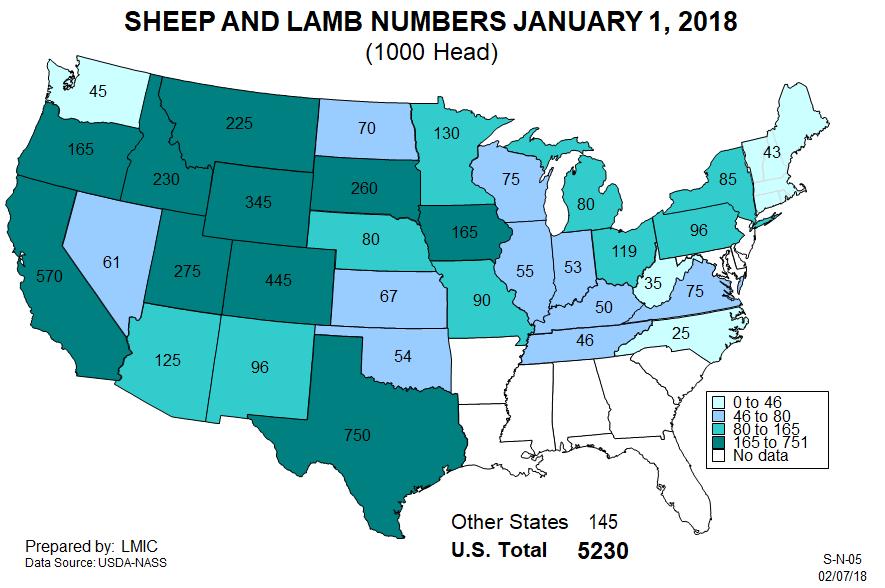
14 Page 14 60, HEAD JANUARY 1 SHEEP & LAMB INVENTORY Source: USDA 1942: 56,213 50,000 40,000 30, : 33,170 20,000 10, : 11, : 5, , 5,230

15 Page 15
16 Page mil lb. Domestic Lamb Production + Imports Imports US domestic production
Monthly US Lamb Market Update
 June 2018 Monthly US Lamb Market Update June 2018 Issue Prepared Exclusively for Meat & Livestock Australia - Sydney June 20, 2018 USA Domes c Lamb Market - Supply/Demand Situa on US domes c lamb slaughter
Monthly US Lamb Market Update
 April 2018 Monthly US Lamb Market Update May 2018 Issue Prepared Exclusively for Meat & Livestock Australia - Sydney May 17, 2018 USA Domes c Lamb Market - Supply/Demand Situa on US domes c lamb slaughter
Monthly US Lamb Market Update
 January 2018 Monthly US Lamb Market Update January 2018 Issue Prepared Exclusively for Meat & Livestock Australia - Sydney January 13, 2018 USA Domes c Lamb Market - Supply/Demand Situa on USDA will issue
Monthly US Lamb Market Update
 February 2018 Monthly US Lamb Market Update February 2018 Issue Prepared Exclusively for Meat & Livestock Australia - Sydney February 21, 2018 USA Domes c Lamb Market - Supply/Demand Situa on Special Edi
Monthly US Lamb Market Update
 February 2019 Monthly US Lamb Market Update February 2019 Issue Prepared Exclusively for Meat & Livestock Australia - Sydney February 19, 2019 USA Domes c Lamb Market - Supply/Demand Situa on The annual
Monthly Hog Market Update United States Hog Slaughter
 This information is provided as a resource by Saskatchewan Agriculture staff All prices are in Canadian dollars unless otherwise noted. Please use this information at your own risk. Monthly Hog Market
Is it time for a boneless beef trimmings derivative contract? David Farley 1 st March 2012
 Is it time for a boneless beef trimmings derivative contract? David Farley 1 st March 2012 Why does AAco care? 680,000 head of cattle Substantial price risk over which AAco has limited ability to take
SHEEP & GOAT - MARKET SITUATION - DASHBOARD Last update: 25/04/2018
 75 57 25 29 EU Trade 1 611 1 813 1 886 1 765 1 438 1 21 212 213 EU India (up to Jan) United States China + H. Kong EU India (up to Jan) United States China + H. Kong Iran Japan Iran Japan World Trade New
BEEF & VEAL MARKET SITUATION. "Single CMO" Management Committee 18 September 2014
 BEEF & VEAL MARKET SITUATION "Single CMO" Management Committee L I V E S T O C K JUNE SURVEY E.U. E V O L U T I O N T O T A L B O V I N E May/Jun %Var %Var %Var %Var TOT LIVESTOCK BOVINE < 1 Year BOVINE
Livestock Risk Protection (LRP)
") Livestock Risk Protection (LRP) A Price Risk Management Tool for Livestock Producers Tim Petry Extension Livestock Economist www.ndsu.edu/livestockeconomics November 14, 2017 FeedlotMgmtClass Nov2017.pptx
Livestock Risk Protection (LRP) A Price Risk Management Tool for Livestock Producers Tim Petry Extension Livestock Economist www.ndsu.edu/livestockeconomics November 14, 2017 FeedlotMgmtClass Nov2017.pptx
EU Pigmeat Market Situation. Meat Market Observatory Economic Board meeting 02 October 2018
 EU Pigmeat Market Situation Meat Market Observatory Economic Board meeting 2 October 218 EXCHANGE RATE INDEX/EURO 14 Index of daily exchange rates of the main trading partners compared to the Euro 13 12
Mil. lbs, carc Thousand Hd. 70
 Sponsored by One last reminder that CME Group will USE new se lement price computa on methods for Live Ca le, Feeder Ca le and Lean Hogs contracts TODAY. CME s Special Execu ve Report 7213 detailing the
Livestock Risk Protection (LRP) A New Price Risk Management Tool for Lamb Producers
 A New Price Risk Management Tool for Lamb Producers") Livestock Risk Protection (LRP) A New Price Risk Management Tool for Lamb Producers Tim Petry, Livestock Economist http://www.ndsu.edu/livestockeconomics 8/04/2017 LRP revenue insurance program that is
Livestock Risk Protection (LRP) A New Price Risk Management Tool for Lamb Producers Tim Petry, Livestock Economist http://www.ndsu.edu/livestockeconomics 8/04/2017 LRP revenue insurance program that is
MONTHLY MILK & FEED MARKET UPDATE
 MONTHLY MILK & FEED MARKET UPDATE Provided By: Curtis Bosma - (312) 870-1185 - curtisb@highgroundtrading.com December 2014 A Sinking Ship? As the leaves began to fall, so did milk futures. Cheese sellers
ECON 337 Agricultural Marketing Spring Exam I. Answer each of the following questions by circling True or False (2 point each).
.") Name: KEY ECON 337 Agricultural Marketing Spring 2014 Exam I Answer each of the following questions by circling True or False (2 point each). 1. True False Futures and options contracts have flexible sizes
Name: KEY ECON 337 Agricultural Marketing Spring 2014 Exam I Answer each of the following questions by circling True or False (2 point each). 1. True False Futures and options contracts have flexible sizes
XML Publisher Balance Sheet Vision Operations (USA) Feb-02
 Feb-02") Page:1 Apr-01 May-01 Jun-01 Jul-01 ASSETS Current Assets Cash and Short Term Investments 15,862,304 51,998,607 9,198,226 Accounts Receivable - Net of Allowance 2,560,786
Page:1 Apr-01 May-01 Jun-01 Jul-01 ASSETS Current Assets Cash and Short Term Investments 15,862,304 51,998,607 9,198,226 Accounts Receivable - Net of Allowance 2,560,786
Tim Petry Livestock Economist Agribusiness and Applied Economics.
 Tim Petry Livestock Economist Agribusiness and Applied Economics www.ag.ndsu.edu/aginfo/lsmkt/livestock.htm Lean Hogs.ppt 2-19-08 www.ers.usda.gov Livestock, Dairy, Poultry Outlook www.nass.usda.gov Hog
Dairy Outlook and Utilizing MPP- and LGM-Dairy: Kenny Burdine University of Kentucky Agricultural Economics
 Dairy Outlook and Utilizing MPP- and LGM-Dairy: 2015 Kenny Burdine University of Kentucky Agricultural Economics Outline for Discussion Review of Current Market Conditions Cow numbers, production expectations,
Financial Results for Fourth Quarter and Year Ended December 30, Pilgrim s Pride Corporation (NASDAQ: PPC)
") Financial Results for Fourth Quarter and Year December 30, 2018 Pilgrim s Pride Corporation (NASDAQ: PPC) Cautionary Notes and Forward-Looking Statements Statements contained in this presentation that
Financial Results for Fourth Quarter and Year December 30, 2018 Pilgrim s Pride Corporation (NASDAQ: PPC) Cautionary Notes and Forward-Looking Statements Statements contained in this presentation that
North American Steel Industry Recent Market Developments, Future Prospects and Key Challenges
 North American Steel Industry Recent Market Developments, Future Prospects and Key Challenges OECD Steel Committee December 1-11, 29 Paris, France * American Iron and Steel Institute (AISI) Steel Manufacturers
Futures and Options Live Cattle Feeder Cattle. Tim Petry Livestock Marketing Economist NDSU Extension
 Futures and Options Live Cattle Feeder Cattle Tim Petry Livestock Marketing Economist NDSU Extension www.ndsu.edu/livestockeconomcs FutOpt-Jan2019 Price Risk Management Tools Cash forward contract Video
Cattle Market And Controversy
 Cattle Market And Controversy Tri County Beef Cattle Merkting 2016 Jasper, TX April 21, 2016 David P. Anderson Professor and Extension Economist Overview Price Correction Increasing Beef Supply Price Relationships
Higher Beef Prices with Higher Prices to Come
 Louisiana Cattle Market Update Friday, August 31 st, 2012 Ross Pruitt, Department of Agricultural Economics and Agribusiness LSU AgCenter Higher Beef Prices with Higher Prices to Come As Labor Day weekend
Financial Results for Third Quarter Ended Sep 30, Pilgrim s Pride Corporation (NASDAQ: PPC)
") Financial Results for Third Quarter Ended Sep 30, 2018 Pilgrim s Pride Corporation (NASDAQ: PPC) Cautionary Notes and Forward-Looking Statements Statements contained in this presentation that share our
Financial Results for Third Quarter Ended Sep 30, 2018 Pilgrim s Pride Corporation (NASDAQ: PPC) Cautionary Notes and Forward-Looking Statements Statements contained in this presentation that share our
Schindler Capital Management, LLC / Dairy Advantage Program. Year Jan Feb Mar Apr May Jun Jul Aug Sep Oct Nov Dec
 Schindler Capital Management, LLC / Dairy Advantage Program Fundamental / Ag & Livestock Performance Since August 2005 Year Jan Feb Mar Apr May Jun Jul Aug Sep Oct Nov Dec 2005-11.20% 3.20% -6.67% -13.73%
SHEEP & GOAT - MARKET SITUATION - DASHBOARD Last update: 09/08/2017
 1,221 687 596 1,611 EU Trade 1,813 1,886 1,765 Qty in 1 heads Qty in 1 tonnes carcass weight 96 116 211 21 212 213 EU World Trade India (up to Apr) Uruguay United States EU India (up to Apr) Uruguay United
Historical Pricing PJM COMED, Around the Clock. Cal '15 Cal '16 Cal '17 Cal '18 Cal '19 Cal '20 Cal '21 Cal '22
 $50 Historical Pricing PJM COMED, Around the Clock $48 $46 $44 $42 $40 $38 $36 $34 $32 $30 $28 $26 Cal '15 Cal '16 Cal '17 Cal '18 Cal '19 Cal '20 Cal '21 Cal '22 The information presented above was gathered
12236/12 JR/fk 1 DG B 1
 COUNCIL OF THE EUROPEAN UNION Brussels, 10 July 2012 12236/12 AGRI 491 AGRIORG 116 NOTE from: to: Subject: Commission Council Report on the situation of the dairy market Delegations will find attached
Department of Agricultural and Resource Economics
 D 34 Department of Agricultural and Resource Economics BASIS ESTIMATES FOR FEEDER CATTLE AND FED CATTLE February 2018 Andrew P. Griffith, Assistant Professor Becky Bowling, UT Extension Specialist Table
Dairy Outlook. July By Jim Dunn Professor of Agricultural Economics, Penn State University. Market Psychology
 Dairy Outlook July 2013 By Jim Dunn Professor of Agricultural Economics, Penn State University Market Psychology The CME block price fell by 5% in the last month, ending 8.75 /lb. lower at $1.665/lb. Most
EU Market Situation for Poultry. Committee for the Common Organisation of the Agricultural Markets 22 March 2018
 EU Market Situation for Poultry Committee for the Common Organisation of the Agricultural Markets 22 March 218 -.2% -.8% -1.1% -2.4% -2.9% -3.3% -4.2% -4.5% 5.1% 4.6% 4.5% 3.8% 3.3% 2.7% 2.4% 1.5% 1.1%
Historical Pricing PJM PSEG, Around the Clock. Cal '15 Cal '16 Cal '17 Cal '18 Cal '19 Cal '20 Cal '21 Cal '22
 $70 Historical Pricing PJM PSEG, Around the Clock $65 $60 $55 $50 $45 $40 $35 $30 $25 Cal '15 Cal '16 Cal '17 Cal '18 Cal '19 Cal '20 Cal '21 Cal '22 The information presented above was gathered and compiled
Futures and Options Live Cattle Feeder Cattle. Tim Petry Livestock Marketing Economist NDSU Extension Service
 Futures and Options Live Cattle Feeder Cattle Tim Petry Livestock Marketing Economist NDSU Extension Service FutOpt-Jan2018 Price Risk Management Tools Cash forward contract Video and internet auctions
EU Market Situation for Poultry. Committee for the Common Organisation of the Agricultural Markets 24 August 2017
 EU Market Situation for Poultry Committee for the Common Organisation of the Agricultural Markets 24 August 217 -7.2% -7.7% -1.6% -1.7% -1.7% -2.1% -2.5% 4.1% 3.6% 3.5% 2.8% 1.9% 1.2%.8%.8%.6%.4%.2%.%.%.%.%
March Domestic Exports Imports. Volume Tonnes SW. MAT Mar-16 4, ,322 32, , % Change 3.8% 5.2% 13.2% 8.0% 1.1% 1.
 March 2017 Overview Table 1.1 Overview trends for Domestic, Export and Import trade Domestic Exports Imports Month Slaughter Pigmeat (Tonnes) Volume Tonnes SW Value $AUD (Million) Volume Tonnes SW Value
Dairy Outlook. August By Jim Dunn Professor of Agricultural Economics, Penn State University. Market Psychology
 Dairy Outlook August 2014 By Jim Dunn Professor of Agricultural Economics, Penn State University Market Psychology The prices of all dairy products have been mixed since last month. The CME block cheese
U.S. Steel Market Outlook. Amy Ebben ArcelorMittal USA November 30, 2018
 U.S. Steel Market Outlook Amy Ebben ArcelorMittal USA November 30, 2018 Agenda ArcelorMittal introduction U.S. steel industry performance and trade Global steel industry Review of steel markets 1 About
Soybeans face long road End to tariffs wouldn t help 2018 exports much By Bryce Knorr, senior grain market analyst
 Soybeans face long road End to tariffs wouldn t help 2018 exports much By Bryce Knorr, senior grain market analyst Forecasting grain prices is relatively easy in normal times. Most models assume the future
Quarterly Statistical Digest
 Quarterly Statistical Digest August Volume 27, No. 3 The Statistical Digest is a quarterly publication of the Central Bank of The Bahamas, prepared by the Research Department for issue in February, May,
Decline in Economic Activity Larger Than Advance GDP Estimate February 27, 2009
 Northern Trust Global Economic Research 5 South LaSalle Chicago, Illinois 663 northerntrust.com Asha G. Bangalore agb3@ntrs.com Decline in Economic Activity Larger Than Advance GDP Estimate February 27,
May Domestic Exports Imports. Volume Tonnes SW. MAT May-14 4, ,960 38, ,
 May 2014 Overview Table 1.1 Overview trends for Domestic, Export and Import trade Domestic Exports Imports Month Slaughter Pigmeat (Tonnes) Volume Tonnes SW Value $AUD (Million) Volume Tonnes SW Value
Weather targets fertilizer market too Heavy rains stall shipments, delay fall applications By Bryce Knorr, grain market analyst
 Weather targets fertilizer market too Heavy rains stall shipments, delay fall applications By Bryce Knorr, grain market analyst The Midwest is finally starting to dry out from heavy rains in the first
December Overview. Table 1.1 Overview trends for Domestic, Export and Import trade
 December 2016 Overview Table 1.1 Overview trends for Domestic, Export and Import trade Domestic Exports Imports Month Slaughter Pigmeat (Tonnes) Volume Tonnes SW Value $AUD (Million) Volume Tonnes SW Value
MARKET ANALYSIS REPORT NO 1 OF 2015: ONION
 MARKET ANALYSIS REPORT NO 1 OF 215: ONION 1. INTRODUCTION The purpose of this text is to analyze the onion marketing environment. This analysis will be updated on a quarterly basis. The interval covered
Answer each of the following questions by circling True or False (2 points each).
.") Name: Econ 337 Agricultural Marketing, Spring 2019 Exam I; March 28, 2019 Answer each of the following questions by circling True or False (2 points each). 1. True False Some risk transfer premium is appropriate
Name: Econ 337 Agricultural Marketing, Spring 2019 Exam I; March 28, 2019 Answer each of the following questions by circling True or False (2 points each). 1. True False Some risk transfer premium is appropriate
By Tom Leffler and Larry Glenn. 14- Day RSI. 10-Day Moving Avg. Today's Low
 www.lefflercom.com By Tom Leffler and Larry Glenn TODAY S THOUGHT Friday, December 30, 2016 HAPPY NEW YEAR 2017 MONDAY, JAN 2 ND GRAINS OPEN AT 7 PM.TUESDAY, JAN 3 RD LIVESTOCK OPENS AT 8:30 AM Tues Jan
THE B E A CH TO WN S O F P ALM B EA CH
 THE B E A CH TO WN S O F P ALM B EA CH C OU N T Y F LO R I D A August www.luxuryhomemarketing.com PALM BEACH TOWNS SINGLE-FAMILY HOMES LUXURY INVENTORY VS. SALES JULY Sales Luxury Benchmark Price : 7,
April Domestic Exports Imports. Volume Tonnes SW. MAT Apr-16 4, ,332 33, , % Change 2.8% 4.3% 12.6% 5.9% 2.9% 4.
 April 2017 Overview Table 1.1 Overview trends for Domestic, Export and Import trade Domestic Exports Imports Month Slaughter Pigmeat (Tonnes) Volume Tonnes SW Value $AUD (Million) Volume Tonnes SW Value
Review of Membership Developments
 RIPE Network Coordination Centre Review of Membership Developments 7 October 2009/ GM / Lisbon http://www.ripe.net 1 Applications development RIPE Network Coordination Centre 140 120 100 80 60 2007 2008
December Overview. Table 1.1 Overview trends for Domestic, Export and Import trade
 December 2018 Overview Table 1.1 Overview trends for Domestic, Export and Import trade Domestic Exports Imports Month Slaughter Pigmeat (Tonnes) Volume Tonnes SW Value $AUD (Million) Volume Tonnes SW Value
Meat Case Trends. Retail Advisory Committee Chicago, IL
 Meat Case Trends Retail Advisory Committee Chicago, IL Data provided by the Meat Solutions VMMEAT system sourced from FreshLook Marketing scanner data FreshLook Data: Represents approximately 68% of the
Wheat market may take patience Exports, seasonal weakness weigh on prices for now. By Bryce Knorr, Senior Grain Market Analyst
 Wheat market may take patience Exports, seasonal weakness weigh on prices for now By Bryce Knorr, Senior Grain Market Analyst The best days of the wheat rally may still be ahead. But first the market may
Retailers slash ammonia prices but urea shoots higher Weekly Fertilizer Review for February 22, 2016
 Retailers slash ammonia prices but urea shoots higher Weekly Fertilizer Review for February 22, 216 A fairly quiet start to retail fertilizer trade in 216 came to very abrupt halt this week, with big changes
SUMMARY OF SELECTED ECONOMIC INDICATORS
 SUMMARY OF SELECTED ECONOMIC INDICATORS RECENT DATA GRAPHS HISTORICAL DATA GRAPHS P.E.I. CONSUMER PRICE INDEX P.E.I. LABOUR FORCE STATISTICS CANADA/P.E.I. GROSS DOMESTIC PRODUCT, INCOME-BASED CANADA /
Industry Trends Watch
 Costing Trends - Alberta Asphalt Cement (Edmonton Rack $C/t) The Edmonton rack price for asphalt cement surged to $730 per tonne in early May. The rack price index averaged $655 per tonne in April and
SPECIAL REPORT: U.S. ALUMINUM IMPORT MONITOR. Data through May Issued: July 2018
 SPECIAL REPORT: U.S. ALUMINUM IMPORT MONITOR Data through May 218 Issued: July 218 OVERVIEW OF SECTION 232 Section 232 of the Trade Expansion Act of 1962, as amended, authorizes the President to adjust
Spheria Australian Smaller Companies Fund
 29-Jun-18 $ 2.7686 $ 2.7603 $ 2.7520 28-Jun-18 $ 2.7764 $ 2.7681 $ 2.7598 27-Jun-18 $ 2.7804 $ 2.7721 $ 2.7638 26-Jun-18 $ 2.7857 $ 2.7774 $ 2.7690 25-Jun-18 $ 2.7931 $ 2.7848 $ 2.7764 22-Jun-18 $ 2.7771
Economic Activity Index ( GDB-EAI ) For the month of May 2013 G O V E R N M E N T D E V E L O P M E N T B A N K F O R P U E R T O R I C O
 For the month of May 2013 G O V E R N M E N T D E V E L O P M E N T B A N K F O R P U E R T O R I C O") Economic Activity Index ( GDB-EAI ) For the month of May 2013 General Commentary May 2013 GDB-EAI for the month of May registered a 3.4% year-over-year ( YOY ) reduction May 2013 EAI was 126.7, a 3.4%
Economic Activity Index ( GDB-EAI ) For the month of May 2013 General Commentary May 2013 GDB-EAI for the month of May registered a 3.4% year-over-year ( YOY ) reduction May 2013 EAI was 126.7, a 3.4%
Business & Financial Services December 2017
 Business & Financial Services December 217 Completed Procurement Transactions by Month 2 4 175 15 125 1 75 5 2 1 Business Days to Complete 25 Jan Feb Mar Apr May Jun Jul Aug Sep Oct Nov Dec 217 Procurement
Key Labor Market and Economic Metrics
 Key Labor Market and Economic Metrics May Update Incorporates Data Available on May 27 th, 2016 This reference is the result of a collaboration between the Bureau of Labor Market Information and Strategic
Common stock prices 1. New York Stock Exchange indexes (Dec. 31,1965=50)2. Transportation. Utility 3. Finance
2. Transportation. Utility 3. Finance") Digitized for FRASER http://fraser.stlouisfed.org/ Federal Reserve Bank of St. Louis 000 97 98 99 I90 9 9 9 9 9 9 97 98 99 970 97 97 ""..".'..'.."... 97 97 97 97 977 978 979 980 98 98 98 98 98 98 987 988
Digitized for FRASER http://fraser.stlouisfed.org/ Federal Reserve Bank of St. Louis 000 97 98 99 I90 9 9 9 9 9 9 97 98 99 970 97 97 ""..".'..'.."... 97 97 97 97 977 978 979 980 98 98 98 98 98 98 987 988
Notes: 1. Prior corresponding period (pcp) 12 months to 31 March Statutory EBITDA represents Net Profit After Tax (NPAT) + tax expense +
 12 months to 31 March Statutory EBITDA represents Net Profit After Tax (NPAT) + tax expense +") Notes: 1. Prior corresponding period (pcp) 12 months to 31 March 2013 2. Statutory EBITDA represents Net Profit After Tax (NPAT) + tax expense + finance costs + depreciation, amortisation and impairment
Notes: 1. Prior corresponding period (pcp) 12 months to 31 March 2013 2. Statutory EBITDA represents Net Profit After Tax (NPAT) + tax expense + finance costs + depreciation, amortisation and impairment
June Todd Hale James Russo Jonathan Banks Jean-Jacques Vandenheede
 June 20 Todd Hale James Russo Jonathan Banks JeanJacques Vandenheede Nielsen Global Scorecard Shopping measures appear to be trending upward, driven by gains in China, India, Canada and the U.S., with
Soybeans face make or break moment Futures need a two-fer to avoid losses By Bryce Knorr, senior grain market analyst
 Soybeans face make or break moment Futures need a two-fer to avoid losses By Bryce Knorr, senior grain market analyst A year ago USDA shocked the market by cutting its forecast of soybean production, helping
Introduction to Futures & Options Markets for Livestock
 Introduction to Futures & Options Markets for Livestock Kevin McNew Montana State University Marketing Your Cattle Marketing: knowing when and how to price your cattle. When Prior to sale At time of sale
December Domestic Exports Imports. Volume Tonnes SW. MAT December-14 4, ,192 39, ,
 December 2014 Overview Table 1.1 Overview trends for Domestic, Export and Import trade Domestic Exports Imports Month Slaughter Pigmeat (Tonnes) Volume Tonnes SW Value $AUD (Million) Volume Tonnes SW Value
Marketing on Margin NPB Swine Educators Inservice. Mark Storlie ISU Swine Field Specialist or
 Marketing on Margin 2011 NPB Swine Educators Inservice Mark Storlie ISU Swine Field Specialist 563-425-3331 or mstorlie@iastate.edu Margin Blitz. Markets Eye on Margin ISU Extension Education efforts Markets.
PHOENIX ENERGY MARKETING CONSULTANTS INC. HISTORICAL NATURAL GAS & CRUDE OIL PRICES UPDATED TO July, 2018
 Jan-01 $12.9112 $10.4754 $9.7870 $1.5032 $29.2595 $275.39 $43.78 $159.32 $25.33 Feb-01 $10.4670 $7.8378 $6.9397 $1.5218 $29.6447 $279.78 $44.48 $165.68 $26.34 Mar-01 $7.6303 $7.3271 $5.0903 $1.5585 $27.2714
MARGIN M ANAGER INSIDE THIS ISSUE. Margin Watch Reports. Features DAIRY WHITE PAPER. Dairy... Pg 11 Beef... Corn... Beans... Pg 16 Wheat...
 MARGIN M ANAGER Margin Management Since 1999 The Leading Resource for Margin Management Education Learn more at MarginManager.Com Monthly INSIDE THIS ISSUE Margin Watch Reports Dairy... Pg 11 Beef... Pg
ACE 427 Spring Lecture 6. by Professor Scott H. Irwin
 ACE 427 Spring 2013 Lecture 6 Forecasting Crop Prices with Futures Prices by Professor Scott H. Irwin Required Reading: Schwager, J.D. Ch. 2: For Beginners Only. Schwager on Futures: Fundamental Analysis,
EU Market Situation for Eggs. Committee for the Common Organisation of the Agricultural Markets 30 August 2018
 EU Market Situation for Eggs Committee for the Common Organisation of the Agricultural Markets 30 August 2018 F O R E C A S T EU production of eggs for consumption (expert forecast May 2018) Source : Experts
WESTWOOD LUTHERAN CHURCH Summary Financial Statement YEAR TO DATE - February 28, Over(Under) Budget WECC Fund Actual Budget
 Budget WECC Fund Actual Budget") WESTWOOD LUTHERAN CHURCH Summary Financial Statement YEAR TO DATE - February 28, 2018 General Fund Actual A B C D E F WECC Fund Actual Revenue Revenue - Faith Giving 1 $ 213 $ 234 $ (22) - Tuition $ 226
WESTWOOD LUTHERAN CHURCH Summary Financial Statement YEAR TO DATE - February 28, 2018 General Fund Actual A B C D E F WECC Fund Actual Revenue Revenue - Faith Giving 1 $ 213 $ 234 $ (22) - Tuition $ 226
By Matt Gould, Chief Market Analyst. October 1, 2018
 By Matt Gould, Chief Market Analyst October 1, 2018 2 Road Map Forecast Outlook Dairy Product Demand Analysis Nonfat Dry Milk Butter Cheese Dry Whey Global Supply & Demand Milk Supply Analysis Global USA
Dairy Gross Margin Insurance
 Dairy Gross Margin Insurance Northeast Dairy Leadership Team Alan Zepp Risk Management Program Coordinator Center for Dairy Excellence Agenda What is LGM? What is a Margin? How do I use LGM? Dairy Gross
Fall 2017 Crop Outlook Webinar
 Fall 2017 Crop Outlook Webinar Chris Hurt, Professor & Extension Ag. Economist James Mintert, Professor & Director, Center for Commercial Agriculture Fall 2017 Crop Outlook Webinar October 13, 2017 50%
Margin Protection Program for Dairy Producers (MPP-Dairy) Dr. Marin Bozic
 Dr. Marin Bozic") Margin Protection Program for Dairy Producers (MPP-Dairy) Dr. Marin Bozic 2 Major Dairy Provisions of the Agricultural Act of 2014 REPEALED NEW Milk Income Loss Contract Dairy Product Price Support Program
Margin Protection Program for Dairy Producers (MPP-Dairy) Dr. Marin Bozic 2 Major Dairy Provisions of the Agricultural Act of 2014 REPEALED NEW Milk Income Loss Contract Dairy Product Price Support Program
EMPLOYER S MUNICIPAL INCOME TAX WITHHOLDING FORMS INSTRUCTIONS FOR FILING FORM LW-1
 CITY TAX DEPT 50 TOWN SQUARE P.O. BOX 155 LIMA, OHIO 45802 PHONE (419) 221-5245 FAX (419) 998-5527 (MONTHLY OR QUARTERLY STATEMENT) FORM LW-3 (ANNUAL RECONCILIATION) EMPLOYER S MUNICIPAL INCOME TAX WITHHOLDING
Beef Industry Outlook
 Glynn T. Tonsor Dept. of Agricultural Economics, Kansas State University Email: gtonsor@ksu.edu Twitter: @TonsorGlynn Industry Outlook Conf. April 25, 2018 Chicago, IL Beef Industry Outlook This presentation
Quarterly Statistical Digest
 Quarterly Statistical Digest February 2019 Volume 28, No. 1 The Statistical Digest is a quarterly publication of the Central Bank of The Bahamas, prepared by the Research Department for issue in February,
Development of Economy and Financial Markets of Kazakhstan
 Development of Economy and Financial Markets of Kazakhstan National Bank of Kazakhstan Macroeconomic development GDP, real growth, % 116 112 18 14 1 113,5 11,7 216,7223,8226,5 19,8 19,8 19,3 19,619,7 199,
Business Cycle Index July 2010
 Business Cycle Index July 2010 Bureau of Trade and Economic Indices, Ministry of Commerce, Tel. 0 2507 5805, Fax. 0 2507 5806, www.price.moc.go.th Thailand economic still expansion. Medium-run Leading
Current and Potential Losses to the U.S. Pork Industry from Retaliatory Tariffs Focus on Mexico June 13, 2018 Background Tariff Details
 Current and Potential Losses to the U.S. Pork Industry from Retaliatory Tariffs Focus on Mexico June 13, 2018 Background The recent implementation of duties and threats of imposing duties on U.S. imports
DG AGRI DASHBOARD: PIGMEAT Last update:
 Chile EU Trade 3 134 3 073 3 096 2 940 1 696 1 590 3 265 World Trade China + H. Kong Brazil Mexico (up to Apr) Russia (up to Apr) Chile China + H. Kong Brazil Mexico (up to Apr) Russia (up to Apr) Qty
North American Steel Industry Recent Market Developments, Future Prospects and Key Challenges
 North American Steel Industry Recent Market Developments, Future Prospects and Key Challenges OECD Steel Committee June 8-9, 29 Paris, France * American Iron and Steel Institute (AISI) Steel Manufacturers
DG AGRI DASHBOARD: PIGMEAT Last update:
 EU Trade World Trade China + H. Kong Brazil Chile (up to Mar) Mexico (up to Mar) Russia (up to Mar) 1 325 1 287 China + H. Kong Brazil Chile (up to Mar) Mexico (up to Mar) Russia (up to Mar) Qty in 1000
Fourth Quarter 2014 Earnings Conference Call. 26 November 2014
 Fourth Quarter 2014 Earnings Conference Call 26 November 2014 Safe Harbor Statement & Disclosures The earnings call and accompanying material include forward-looking comments and information concerning
Industry Trends Watch
 Costing Trends - Alberta Asphalt Cement (Edmonton Rack $C/t) The Edmonton rack price for asphalt cement averaged $730 per tonne in May, compared with $655 in April. In May of last year, the rack price
It s time to book 2018 fertilizer Focus on nitrogen first, using right tool for each market By Bryce Knorr, grain market analyst
 It s time to book 2018 fertilizer Focus on nitrogen first, using right tool for each market By Bryce Knorr, grain market analyst A slump in nitrogen costs this summer gives growers a chance to lock in
SmallBizU WORKSHEET 1: REQUIRED START-UP FUNDS. Online elearning Classroom. Item Required Amount ($) Fixed Assets. 1 -Buildings $ 2 -Land $
 Fixed Assets. 1 -Buildings $ 2 -Land $") WORKSHEET 1: REQUIRED START-UP FUNDS Item Required Amount () Fixed Assets 1 -Buildings 2 -Land 3 -Initial Inventory 4 -Equipment 5 -Furniture and Fixtures 6 -Vehicles 7 Total Fixed Assets Working Capital
WORKSHEET 1: REQUIRED START-UP FUNDS Item Required Amount () Fixed Assets 1 -Buildings 2 -Land 3 -Initial Inventory 4 -Equipment 5 -Furniture and Fixtures 6 -Vehicles 7 Total Fixed Assets Working Capital
SPECIAL REPORT: U.S. ALUMINUM IMPORT MONITOR. March Issued: May 2018
 SPECIAL REPORT: U.S. ALUMINUM IMPORT MONITOR March 218 Issued: May 218 OVERVIEW OF SECTION 232 Section 232 of the Trade Expansion Act of 1962, as amended, authorizes the President to adjust the imports
Fishpool Christmas Seminar 2017 Bearish signals going into 2018
 Photo: SB1 Markets SEAFOOD SALMON FARMING Fishpool Christmas Seminar 2017 Bearish signals going into 2018 Tore A. Tønseth Phone : (+47) 24 14 74 18 Mobile : (+47) 95 80 62 77 E-mail : tore.tonseth@sb1markets.no
MEDICAID FEDERAL SHARE OF MATCHING FUNDS
 MEDICAID FEDERAL SHARE OF MATCHING FUNDS revised by EDR based on FFIS Estimated for FFY 2019 August 3, 2017 Effective State Budget Year State adopted February 2017 State State FY real Difference in state
Black Knight Mortgage Monitor
 Black Knight Mortgage Monitor Mortgage Market Performance Observations Data as of May, 2014 Month-end Black Knight First Look May 2014 Total U.S. loan delinquency rate (loans 30 or more days past due,
ASX Plans to Support and Service the Carbon Pollution Reduction Scheme. Anthony Collins General Manager, Energy & Environment
 ASX Plans to Support and Service the Carbon Pollution Reduction Scheme Anthony Collins General Manager, Energy & Environment Outline The Role of Financial Markets Likely Market Evolution Emissions Trading
Monthly Mutual Fund Report
 July, Monthly Mutual Fund Report Statistics for May-June Sales and Redemptions Total assets for all funds increased in May by $9. billion, or., to $.7 trillion. Money market funds had a net cash outflow
Commodity Price Outlook & Risks
 Commodity Outlook & Risks Research Department, Commodities Team 1 December 22, 20 www.imf.org/commodities commodities@imf.org This monthly report presents a price outlook and risk assessment for selected
Performance Report October 2018
 Structured Investments Indicative Report October 2018 This report illustrates the indicative performance of all Structured Investment Strategies from inception to 31 October 2018 Matured Investment Strategies
1Q of FY ending December 31, (0.2) (1.9) 11.3 (0.2) (0.2) (0.2) (0.2) (1.2) (89.2) 0.1
 (1.9) 11.3 (0.2) (0.2) (0.2) (0.2) (1.2) (89.2) 0.1") August 6, ISEKI & CO., LTD. Supplementary Information to Consolidated Financial Results (April 1, June 30, ) I. Consolidated business results for the three months ended June 30, (Billions of yen, %) Year-on
August 6, ISEKI & CO., LTD. Supplementary Information to Consolidated Financial Results (April 1, June 30, ) I. Consolidated business results for the three months ended June 30, (Billions of yen, %) Year-on
LOAN MARKET DATA AND ANALYTICS BY THOMSON REUTERS LPC
 LOAN MARKET DATA AND ANALYTICS BY THOMSON REUTERS LPC GLOBAL LOAN MARKET DATA AND ANALYTICS BY THOMSON REUTERS LPC Secondary Market Bid Levels: Europe Slide 2 European CLO New Issue Volume Monthly Slide
EMPLOYER S MUNICIPAL INCOME TAX WITHHOLDING FORMS
 CITY TAX DEPT 50 TOWN SQUARE P.O. BOX 155 LIMA, OHIO 45802 PHONE (419) 221-5245 FAX (419) 998-5527 FORM LW-1 (MONTHLY OR QUARTERLY STATEMENT) FORM LW-3 (ANNUAL RECONCILIATION) EMPLOYER S MUNICIPAL INCOME