Monthly US Lamb Market Update
|
|
|
- Winfred Holmes
- 5 years ago
- Views:
Transcription

1 April 2018 Monthly US Lamb Market Update May 2018 Issue Prepared Exclusively for Meat & Livestock Australia - Sydney May 17, 2018 USA Domes c Lamb Market - Supply/Demand Situa on US domes c lamb slaughter normally declines following Easter and this year was no different. Weekly slaughter in the four weeks ending May 12 averaged 35,500 head/week compared to an average of 42,200 head per week in the weeks leading and immediately a er Easter. The slaughter levels of recent weeks were s ll about 8.8% higher than the same period a year ago but 9.8% lower than the five year average. As can be seen in the supply/demand balance table, lamb slaughter is expected to run modestly under year ago levels for the balance of the year. Some of the decline is expected to be offset by modestly higher weights. High lamb prices, especially imported product, has limited retail features going into Memorial Day weekend. Features during this me of year tend to be rela vely limited regardless because consumers have plenty of less expensive op ons. Retail features in the first two weeks of May are down some 35% compared to a year ago and 42% under the five year average. Wholesale domes c lamb prices were steady in the first four months of the year but remain above year ago levels. Cutout values for domes c lamb, a weighted average of the various lamb cuts sold at wholesale, was $373.25/cwt in April, 5% higher than a year ago and 8.1% higher than the five year average. Last year the cutout rose sharply in June, July and August, in part because of limited availability of imported product but also higher beef prices. Wholesale prices could be steady to modestly higher in the short term but lower lamb prices imply lower cutout values during the summer. The average price for slaughter lambs in April (Sioux Falls basis) was $158/cwt, 9.3% lower than a year ago but s ll 7.2% higher than the five year average. Last year slaughter lamb prices spiked in May and June, which is unlikely to be repeated this year. We expect slaughter lamb prices to be seasonally higher in May and June but well under last year s levels. Cold storage lamb inventory at the end of March was million pounds, 1.2% higher than the previous year. Seasonally inventories increase into the summer and fall, in part because end users look to accumulate product for year-end holidays. Inventories were up 10.9% compared to a year ago but s ll 2.3% lower than the five year average. Weekly USA Lamb & Sheep Slaughter '000 Head/Week. Source: USDA. Compiled and Analysis by Steiner Consulting THOUSAND POUNDS 40,000 35,000 5-Yr Jan Feb Mar Apr May Jun Jul Aug Sep Oct Nov Dec LAMB AND MUTTON, COLD STORAGE STOCKS, THOUSAND POUNDS, END OF MONTH INVENTORIES 30,000 25,000 20,000 15,000 LAMB AND MUTTON, COLD STORAGE STOCKS JAN FEB MAR APR MAY JUN JUL AUG SEP OCT NOV DEC Avg NATIONAL RETAIL LAMB FEATURE REPORT: ACTIVITY INDEX Source: USDA. Latest data point is for May 18, ,000 18,000 16,000 14,000 12,000 10,000 8,000 6,000 4,000 2,000-5-Yr Avg Jan Feb Mar Apr May Jun Jul Aug Sep Oct Nov Dec
2 Page 2 Imported Lamb Supply and Price Trends Weekly lamb imports have shown significant improvement in recent weeks although for the year overall volume remains under last year s levels. In the four weeks ending May 5 US lamb imports from Australia averaged 1,098 MT per week, 40% higher than the same period a year ago. Some of this may be due to the fact that Easter last year was in mid April compared to the end of March this year. S ll, robust prices for lamb in the US market make it especially a rac ve and should help bolster imports in the near term. Imports from New Zealand during this period averaged 525 MT/week, 16% lower than a year ago. Lamb imports from South America and Europe remain minimal. As the summary table to the right shows, entries of lamb from Chile, currently the third largest importer were just 87MT through May 5 while imports from Uruguay were a mere 21MT. South American lamb is almost unknown in the US and many of the tradi onal users, whether at retail or foodservice, are not familiar with the product. The value of lamb imports from Chile, for instance, is significantly lower than product from Australia or New Zealand. In March, the average import value of Chilean lamb was 5,367 USD/MT compared to 9,418 USD/MT for New Zealand product and 6,090 USD/MT for Australia. Import product composi on likely has a lot to do with this, as New Zealand ships a lot of racks compared to legs and shoulders from Australia Imports of goat meat and mu on con nue to be quite limited. Australia accounts for almost all imported goat meat coming to the US and in the last four reported weeks imports averaged 487MT/week, 28% lower than the same period a year ago. About 75% of all US mu on imports come from Australia with rest coming from New Zealand. In the last four weeks Australian mu on imports averaged 370 MT/week, 4% higher than a year ago. As US lamb prices decline, in part due to increased compe- on from other proteins, it remains to be seen if Australian imported lamb will be able to sustain the lo y levels established since the start of the year. So far prices for racks are running between 16% and 24% above last year s levels while shoulder pries are up as much as 25% y/y. Imported lamb prices from New Zealand remains very firm as well, with cap off racks as much as 30% above year ago levels. US YTD Lamb Imported Volume. Metric Ton Data updated through May 5, 2018 Total Australia New Zealand Canada Chile Iceland Uruguay Spain Northern Ireland Mexico -0.8% -6.2% % 0 5,000 10,000 15,000 20,000 25,000 30,000 35,000 Mexico Northern New Spain Uruguay Iceland Chile Canada Ireland Zealand Australia Total ,030 20,328 29, ,106 21,662 31,003 Australian Lamb Racks, Fresh, Cap-off, 28 oz/up. 4-WK Moving Avg. Weekly Prices. Source: USDA 1,150 1,100 1,050 1, Jan Feb Mar Apr May Jun Jul Aug Sep Oct Nov Dec
3 Page 3 US Domestic Lamb Cut and Primal Values Weekly Prices from USDA. Wt. Average 5/11/2018 5/4/2018 w/w 5/12/2017 y/y US$/cwt US$/cwt % ch. US$/cwt % ch. Foresaddle 204 Rack, 8-Rib, Medium % % 209 Breast % % 207 Shoulders, Square Cut % % 210 Foreshank % % Neck % % Foresaddle Value % % Hindsaddle 232 Loin, Trimmed, 4x % % 232E Flank, Untrimmed % % 233A Leg, Trotter Off % % Hindsaddle Value % % Carcass Value % % Hindsaddle, Foresaddle and Total Lamb Cutout Value Source: USDA Mandatory Price Reporting System 500 Foresaddle Value Hindsaddle Value 450 Lamb Cutout
4 Page 4 Domestic Lamb Cutout Value, USA Source: Agricultural Marketin Service, USDA. $ per 100 lb. Dressed Carcass Yr Avg. % ch. vs. Yr Ago % ch. vs. 5-Yr Avg. Jan % 5.7% Feb % 8.3% Mar % 8.2% Apr % 8.1% May Jun Jul Aug Sep Oct Nov Dec Note: Monthly Cutout Value Calculated Using Weekly Data USA Domestic Lamb Cutout Value Monthly Avg. Price; Source: USDA Yr Avg Jan Feb Mar Apr May Jun Jul Aug Sep Oct Nov Dec
5 Page 5 Slaughter Lamb Price, Sioux Falls, SD Basis Monthly Average Prices, lb., $ per 100 lb Yr. Avg. % ch. vs. Yr Ago. % ch. vs. 5-Yr Avg. Jan % 4.5% Feb % 9.6% Mar % 13.7% Apr % 7.2% May Jun Jul Aug Sep Oct Nov Dec Source: USDA Slaughter Lamb Price, Sioux Falls, SD Basis Monthly Average Prices, lb., $ per 100 lb Yr. Avg Jan Feb Mar Apr May Jun Jul Aug Sep Oct Nov Dec
6 Page 6 Imported Lamb Price Summary Source: USDA Agricultural Marketing Service, Mandatory Price Reporting 2018 YTD Volume 2018 YTD Wt. Avg. $ 2018 YTD Implied Value May 22, 2017 May 7, 2018 May 14, 2018 % ch. vs. Week Ago % ch. vs. Year Ago Fresh/Chilled Pounds $/lb. Total $ AUS Shortloin, 1-Rib, 0x0 2,809,936 $ 5.53 $ 15,537,499 $ 5.59 $ 5.51 $ % -1.2% AUS Shoulder, Square-cut 1,305,667 $ 3.09 $ 4,036,581 $ 2.51 $ 3.06 $ % 24.9% AUS Rack, FR, Cap-off, 28 oz/up 1,561,387 $ $ 15,909,456 $ 9.18 $ $ % 16.4% AUS Shortloin, 1-Rib, 1x1 66,906 $ 5.23 $ 349,918 $ 5.19 $ - $ - n/a n/a AUS Leg, semi bnls 366,830 $ 4.22 $ 1,548,344 $ 3.95 $ 4.00 $ % 4.2% AUS Rack, FR, Cap-off, oz 295,364 $ $ 3,317,549 $ 9.49 $ $ % 24.1% AUS Rack, FR, Cap-off, oz 153,987 $ $ 1,731,244 $ 9.68 $ $ % 25.7% AUS Foreshank, VP 146,937 $ 3.67 $ 539,544 $ 3.12 $ 3.31 $ % 8.0% Subtotal 6,707,014 $ 6.41 $ 42,970,134 $ 5.94 $ 6.49 $ % 9.5% Frozen AUS Leg, Long 3,393,984 $ 2.39 $ 8,117,506 $ 3.33 $ 3.58 $ % 9.3% AUS Leg, bnls 2,213,447 $ 2.39 $ 5,293,976 $ 3.58 $ 3.87 $ % 8.8% AUS Shoulder, Square-cut, bnls 1,034,368 $ 2.39 $ 2,473,933 $ 3.62 $ 3.72 $ % 1.4% AUS Shoulder, Square-cut 2,022,420 $ 2.39 $ 4,837,090 $ 2.84 $ 2.60 $ % -4.8% AUS Foreshank, LP 953,623 $ 2.39 $ 2,280,812 $ 2.34 $ 2.66 $ % 8.3% AUS Hindshank, VP 242,584 $ 2.39 $ 580,196 $ 2.22 $ 2.76 $ % 21.0% AUS Rack, FR, Cap-off, 28 oz/up 260,004 $ 2.39 $ 621,860 $ 9.31 $ $ % 15.9% AUS Hindshank, LP 186,589 $ 2.39 $ 446,271 $ 2.77 $ 3.06 $ % 20.0% AUS Rack, FR, Cap-off, oz 353,632 $ 2.39 $ 845,794 $ 8.93 $ 9.53 $ % 17.5% AUS Rack, FR, Cap-off, oz 354,654 $ 2.39 $ 848,238 $ 9.02 $ $ % 14.6% NZ Rack, FR, Cap-off, oz 1,187,240 $ 2.39 $ 2,839,562 $ 8.79 $ $ % 30.3% NZ Rack, FR, Cap-off, oz 925,180 $ 2.39 $ 2,212,784 $ 9.04 $ $ % 28.1% NZ Rack, FR, Cap-off, 20 oz/up 449,725 $ 2.39 $ 1,075,622 $ 8.33 $ $ % 25.5% NZ Rack, FR, Cap-off, 12 oz/dn 47,994 $ 2.39 $ 114,789 $ 8.99 $ $ % 28.0% Subtotal 13,625,444 $ 2.39 $ 32,588,434 $ 4.68 $ 5.30 $ % 15.5% Please note that the prices, volume and sales value reported above represents only subset of total US lamb imports. It only reflects the data reported through the Mandatory Price Repor ng System. It is only for nego ated sales, no formula sales. Trade from smaller importers and traders is not included in the summary above. Data that does not meet the confiden ality guidelines also is not included in the above table.
7 Page 7 USA LAMB & MUTTON QUARTERLY SLAUGHTER, PRODUCTION, IMPORTS, EXPORTS AND DISAPPEARANCE. CARCASS WT. EQUIVALENT (CWE) =A x B A B C D E F G =C+D-E+F+G Year & Quarter Slaughter % ch. Avg. Carc. Wt. % ch. Comm. Lamb Prod. % ch. Imports % ch. Exports % ch. Farm Production Adj. to End. Stocks to Balance Total Disapp. % ch. 000 Head Y/Y Lbs. Y/Y (Mil. Lbs.) Y/Y (Mil. Lbs.) Y/Y (Mil. Lbs.) Y/Y (Mil. Lbs.) (Mil. Lbs.) (Mil. Lbs.) Y/Y st Qtr % % % % % % 2nd Qtr % % % % % % 3rd Qtr % % % % % % 4th Qtr % % % % % % Year 2, % % % % % % st Qtr % % % % % % 2nd Qtr % % % % % % 3rd Qtr % % % % % % 4th Qtr % % % % % % Year 2, % % % % % % st Qtr % % % % % % 2nd Qtr % % % % % % 3rd Qtr % % % % % % 4th Qtr % % % % % % Year 2, % % % % % % st Qtr % % % % % % 2nd Qtr % % % % % % 3rd Qtr % % % % % % 4th Qtr % % % % % % Year 2, % % % % % % st Qtr % % % % % % 2nd Qtr % % % % % % 3rd Qtr % % % % % % 4th Qtr % % % % % % Year 2, % % % % % % 2018 * 1st Qtr % % % % % % * 2nd Qtr % % % % % % * 3rd Qtr % % % % % % * 4th Qtr % % % % % % * Year 2, % % % % % % 2019 * 1st Qtr % % % % % % * 2nd Qtr % % % % % % * 3rd Qtr % % % % % % * 4th Qtr % % % % % % * Year 2, % % % % % % * Estimates Source: This balance sheet was developed and is maintained by the Livestock Market Informa on Center
8 Page 8 Lamb & Sheep Slaughter. Monthly. '000 Head Yr Avg. % ch Yr Ago % ch 5-Yr Avg. Jan % 1.8% Feb % -0.6% Mar % 1.0% Apr May Jun Jul Aug Sep Oct Nov Dec Source: USDA Lamb & Sheep Slaughter. Monthly. '000 Head Monthly Data. Source: USDA Yr Avg Jan Feb Mar Apr May Jun Jul Aug Sep Oct Nov Dec
9 Page 9 Lamb Yearling Dressed Weights. Monthly. Avg. Pounds per Carcass Yr Avg. % ch Yr Ago % ch 5-Yr Avg. Jan % 2.3% Feb % 2.5% Mar % 1.2% Apr May Jun Jul Aug Sep Oct Nov Dec Source: USDA Lamb Yearling Dressed Weights. Monthly. Avg. Pounds per Carcass Monthly Data. Source: USDA Yr Avg Jan Feb Mar Apr May Jun Jul Aug Sep Oct Nov Dec Source: USDA
10 Page 10 Lamb Yearling Production. Monthly. Carcass Wt. Basis. Million Lb Yr Avg. % ch Yr Ago % ch 5-Yr Avg. Jan % 2.5% Feb % -2.0% Mar % 1.0% Apr May Jun Jul Aug Sep Oct Nov Dec Source: USDA Lamb Yearling Production. Monthly. Carcass Wt. Basis. Million Lb. Monthly Data. Source: USDA Yr Avg Jan Feb Mar Apr May Jun Jul Aug Sep Oct Nov Dec
11 Page 11 Y/Y Ch. in Mar. 18 vs. Mar 17 US Mutton, Goat, Lamb Imports Source: USDA/FAS Units: Metric Tons World Total -2,511 Other Chile 3 35 Iceland -5 Mexico -8 Canada New Zealand(*) Change in total imports: -15% Australia(*) -1,647-3,500-3,000-2,500-2,000-1,500-1, Quantity of US Imports of Fr/Frz Mutton, Goat, Lamb: World Total Source: USDA/FAS. Units: Metric Ton. Analysis by: Steiner Consulting ( ) 18,000 16,000 14,000 12,000 10,000 8,000 6,000 4,000 2,000 5-Yr Avg
12 Page 12 Y/Y Ch. in Mar. 18 vs. Mar 17 US Mutton, Goat, Lamb Import Value ($) Source: USDA/FAS Units: US Dollars World Total -12,688,619 Other Chile 58,273 10,165 Mexico -14,291 Canada Iceland New Zealand(*) Change in total import value: -11% -1,122,249-61,509-72,417 Australia(*) -11,486,591-20,000,000-15,000,000-10,000,000-5,000, ,000,000 $ Value of US Imports of Fr/Frz Mutton, Goat, Lamb: World Total Source: USDA/FAS. Units: US Dollars. Analysis by: Steiner Consulting ( ) 120,000, ,000, ,000,000 90,000,000 80,000,000 70,000,000 60,000,000 50,000,000 40,000,000 30,000, Yr Avg 20,000,000
13 Page 13 TOP US LAMB IMPORT MARKETS IN 2018 TOP US LAMB IMPORT MARKETS IN 2017 Total Volume and Country Shares for Period Jan - Mar 2018, MT Total Volume and Country Shares for Period Jan - Mar 2017, MT New Zealand 21% New Zealand 22% 36K 40K Australia 79% Australia 78% Quantity of US Imports of Fr/Frz Mutton, Goat, Lamb: Australia(*) Source: USDA/FAS. Units: Metric Ton. Analysis by: Steiner Consulting ( ) 14,000 12,000 10,000 8,000 6,000 4, Yr Avg Quantity of US Imports of Fr/Frz Mutton, Goat, Lamb: New Zealand(*) Source: USDA/FAS. Units: Metric Ton. Analysis by: Steiner Consulting ( ) 4,000 3,500 3,000 2,500 2,000 1,500 1, Yr Avg 2, $ Value of US Imports of Fr/Frz Mutton, Goat, Lamb: Australia(*) Source: USDA/FAS. Units: US Dollars. Analysis by: Steiner Consulting ( ) 90,000,000 80,000,000 70,000,000 60,000,000 50,000, Yr Avg $ Value of US Imports of Fr/Frz Mutton, Goat, Lamb: New Zealand(*) Source: USDA/FAS. Units: US Dollars. Analysis by: Steiner Consulting ( ) 35,000,000 30,000,000 25,000,000 20,000,000 40,000,000 30,000,000 20,000,000 15,000,000 10,000,000 10,000,000-5,000, Yr Avg

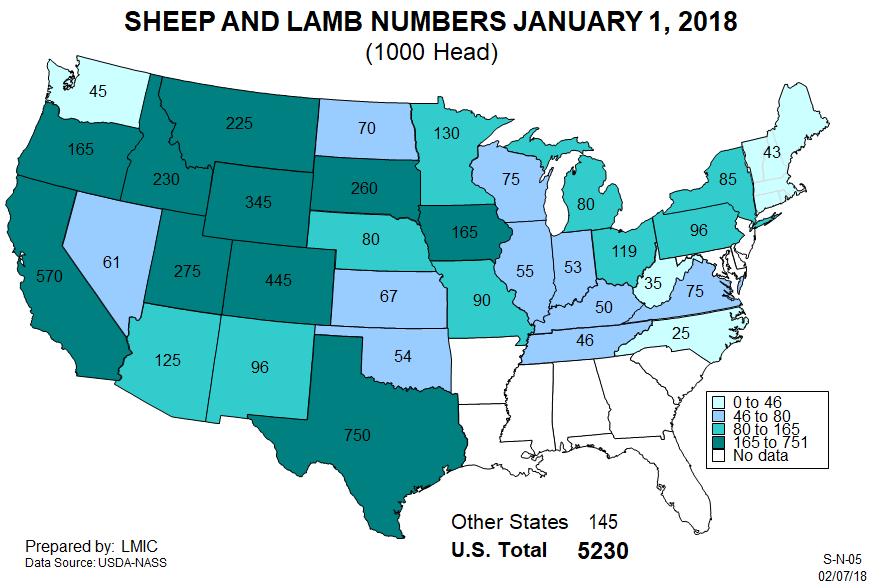
14 Page 14 60, HEAD JANUARY 1 SHEEP & LAMB INVENTORY Source: USDA 1942: 56,213 50,000 40,000 30, : 33,170 20,000 10, : 11, : 5, , 5,230

15 Page 15
16 Page mil lb. Domestic Lamb Production + Imports Imports US domestic production
Monthly US Lamb Market Update
 June 2018 Monthly US Lamb Market Update June 2018 Issue Prepared Exclusively for Meat & Livestock Australia - Sydney June 20, 2018 USA Domes c Lamb Market - Supply/Demand Situa on US domes c lamb slaughter
Monthly US Lamb Market Update
 August 2018 Monthly US Lamb Market Update November 2018 Issue Prepared Exclusively for Meat & Livestock Australia - Sydney November 27, 2018 USA Domes c Lamb Market - Supply/Demand Situa on High prices,
Monthly US Lamb Market Update
 February 2018 Monthly US Lamb Market Update February 2018 Issue Prepared Exclusively for Meat & Livestock Australia - Sydney February 21, 2018 USA Domes c Lamb Market - Supply/Demand Situa on Special Edi
Monthly US Lamb Market Update
 January 2018 Monthly US Lamb Market Update January 2018 Issue Prepared Exclusively for Meat & Livestock Australia - Sydney January 13, 2018 USA Domes c Lamb Market - Supply/Demand Situa on USDA will issue
Monthly US Lamb Market Update
 February 2019 Monthly US Lamb Market Update February 2019 Issue Prepared Exclusively for Meat & Livestock Australia - Sydney February 19, 2019 USA Domes c Lamb Market - Supply/Demand Situa on The annual
Monthly Hog Market Update United States Hog Slaughter
 This information is provided as a resource by Saskatchewan Agriculture staff All prices are in Canadian dollars unless otherwise noted. Please use this information at your own risk. Monthly Hog Market
Is it time for a boneless beef trimmings derivative contract? David Farley 1 st March 2012
 Is it time for a boneless beef trimmings derivative contract? David Farley 1 st March 2012 Why does AAco care? 680,000 head of cattle Substantial price risk over which AAco has limited ability to take
Livestock Risk Protection (LRP) A New Price Risk Management Tool for Lamb Producers
 A New Price Risk Management Tool for Lamb Producers") Livestock Risk Protection (LRP) A New Price Risk Management Tool for Lamb Producers Tim Petry, Livestock Economist http://www.ndsu.edu/livestockeconomics 8/04/2017 LRP revenue insurance program that is
Livestock Risk Protection (LRP) A New Price Risk Management Tool for Lamb Producers Tim Petry, Livestock Economist http://www.ndsu.edu/livestockeconomics 8/04/2017 LRP revenue insurance program that is
Mil. lbs, carc Thousand Hd. 70
 Sponsored by One last reminder that CME Group will USE new se lement price computa on methods for Live Ca le, Feeder Ca le and Lean Hogs contracts TODAY. CME s Special Execu ve Report 7213 detailing the
BEEF & VEAL MARKET SITUATION. "Single CMO" Management Committee 18 September 2014
 BEEF & VEAL MARKET SITUATION "Single CMO" Management Committee L I V E S T O C K JUNE SURVEY E.U. E V O L U T I O N T O T A L B O V I N E May/Jun %Var %Var %Var %Var TOT LIVESTOCK BOVINE < 1 Year BOVINE
SHEEP & GOAT - MARKET SITUATION - DASHBOARD Last update: 25/04/2018
 75 57 25 29 EU Trade 1 611 1 813 1 886 1 765 1 438 1 21 212 213 EU India (up to Jan) United States China + H. Kong EU India (up to Jan) United States China + H. Kong Iran Japan Iran Japan World Trade New
Livestock Risk Protection (LRP)
") Livestock Risk Protection (LRP) A Price Risk Management Tool for Livestock Producers Tim Petry Extension Livestock Economist www.ndsu.edu/livestockeconomics November 14, 2017 FeedlotMgmtClass Nov2017.pptx
Livestock Risk Protection (LRP) A Price Risk Management Tool for Livestock Producers Tim Petry Extension Livestock Economist www.ndsu.edu/livestockeconomics November 14, 2017 FeedlotMgmtClass Nov2017.pptx
Cattle Market And Controversy
 Cattle Market And Controversy Tri County Beef Cattle Merkting 2016 Jasper, TX April 21, 2016 David P. Anderson Professor and Extension Economist Overview Price Correction Increasing Beef Supply Price Relationships
EU Pigmeat Market Situation. Meat Market Observatory Economic Board meeting 02 October 2018
 EU Pigmeat Market Situation Meat Market Observatory Economic Board meeting 2 October 218 EXCHANGE RATE INDEX/EURO 14 Index of daily exchange rates of the main trading partners compared to the Euro 13 12
Tim Petry Livestock Economist Agribusiness and Applied Economics.
 Tim Petry Livestock Economist Agribusiness and Applied Economics www.ag.ndsu.edu/aginfo/lsmkt/livestock.htm Lean Hogs.ppt 2-19-08 www.ers.usda.gov Livestock, Dairy, Poultry Outlook www.nass.usda.gov Hog
MONTHLY MILK & FEED MARKET UPDATE
 MONTHLY MILK & FEED MARKET UPDATE Provided By: Curtis Bosma - (312) 870-1185 - curtisb@highgroundtrading.com December 2014 A Sinking Ship? As the leaves began to fall, so did milk futures. Cheese sellers
Dairy Outlook. July By Jim Dunn Professor of Agricultural Economics, Penn State University. Market Psychology
 Dairy Outlook July 2013 By Jim Dunn Professor of Agricultural Economics, Penn State University Market Psychology The CME block price fell by 5% in the last month, ending 8.75 /lb. lower at $1.665/lb. Most
Higher Beef Prices with Higher Prices to Come
 Louisiana Cattle Market Update Friday, August 31 st, 2012 Ross Pruitt, Department of Agricultural Economics and Agribusiness LSU AgCenter Higher Beef Prices with Higher Prices to Come As Labor Day weekend
XML Publisher Balance Sheet Vision Operations (USA) Feb-02
 Feb-02") Page:1 Apr-01 May-01 Jun-01 Jul-01 ASSETS Current Assets Cash and Short Term Investments 15,862,304 51,998,607 9,198,226 Accounts Receivable - Net of Allowance 2,560,786
Page:1 Apr-01 May-01 Jun-01 Jul-01 ASSETS Current Assets Cash and Short Term Investments 15,862,304 51,998,607 9,198,226 Accounts Receivable - Net of Allowance 2,560,786
ECON 337 Agricultural Marketing Spring Exam I. Answer each of the following questions by circling True or False (2 point each).
.") Name: KEY ECON 337 Agricultural Marketing Spring 2014 Exam I Answer each of the following questions by circling True or False (2 point each). 1. True False Futures and options contracts have flexible sizes
Name: KEY ECON 337 Agricultural Marketing Spring 2014 Exam I Answer each of the following questions by circling True or False (2 point each). 1. True False Futures and options contracts have flexible sizes
Financial Results for Fourth Quarter and Year Ended December 30, Pilgrim s Pride Corporation (NASDAQ: PPC)
") Financial Results for Fourth Quarter and Year December 30, 2018 Pilgrim s Pride Corporation (NASDAQ: PPC) Cautionary Notes and Forward-Looking Statements Statements contained in this presentation that
Financial Results for Fourth Quarter and Year December 30, 2018 Pilgrim s Pride Corporation (NASDAQ: PPC) Cautionary Notes and Forward-Looking Statements Statements contained in this presentation that
Dairy Outlook and Utilizing MPP- and LGM-Dairy: Kenny Burdine University of Kentucky Agricultural Economics
 Dairy Outlook and Utilizing MPP- and LGM-Dairy: 2015 Kenny Burdine University of Kentucky Agricultural Economics Outline for Discussion Review of Current Market Conditions Cow numbers, production expectations,
Futures and Options Live Cattle Feeder Cattle. Tim Petry Livestock Marketing Economist NDSU Extension
 Futures and Options Live Cattle Feeder Cattle Tim Petry Livestock Marketing Economist NDSU Extension www.ndsu.edu/livestockeconomcs FutOpt-Jan2019 Price Risk Management Tools Cash forward contract Video
Financial Results for Third Quarter Ended Sep 30, Pilgrim s Pride Corporation (NASDAQ: PPC)
") Financial Results for Third Quarter Ended Sep 30, 2018 Pilgrim s Pride Corporation (NASDAQ: PPC) Cautionary Notes and Forward-Looking Statements Statements contained in this presentation that share our
Financial Results for Third Quarter Ended Sep 30, 2018 Pilgrim s Pride Corporation (NASDAQ: PPC) Cautionary Notes and Forward-Looking Statements Statements contained in this presentation that share our
Department of Agricultural and Resource Economics
 D 34 Department of Agricultural and Resource Economics BASIS ESTIMATES FOR FEEDER CATTLE AND FED CATTLE February 2018 Andrew P. Griffith, Assistant Professor Becky Bowling, UT Extension Specialist Table
Futures and Options Live Cattle Feeder Cattle. Tim Petry Livestock Marketing Economist NDSU Extension Service
 Futures and Options Live Cattle Feeder Cattle Tim Petry Livestock Marketing Economist NDSU Extension Service FutOpt-Jan2018 Price Risk Management Tools Cash forward contract Video and internet auctions
Dairy Outlook. August By Jim Dunn Professor of Agricultural Economics, Penn State University. Market Psychology
 Dairy Outlook August 2014 By Jim Dunn Professor of Agricultural Economics, Penn State University Market Psychology The prices of all dairy products have been mixed since last month. The CME block cheese
Retailers slash ammonia prices but urea shoots higher Weekly Fertilizer Review for February 22, 2016
 Retailers slash ammonia prices but urea shoots higher Weekly Fertilizer Review for February 22, 216 A fairly quiet start to retail fertilizer trade in 216 came to very abrupt halt this week, with big changes
Answer each of the following questions by circling True or False (2 points each).
.") Name: Econ 337 Agricultural Marketing, Spring 2019 Exam I; March 28, 2019 Answer each of the following questions by circling True or False (2 points each). 1. True False Some risk transfer premium is appropriate
Name: Econ 337 Agricultural Marketing, Spring 2019 Exam I; March 28, 2019 Answer each of the following questions by circling True or False (2 points each). 1. True False Some risk transfer premium is appropriate
Historical Pricing PJM COMED, Around the Clock. Cal '15 Cal '16 Cal '17 Cal '18 Cal '19 Cal '20 Cal '21 Cal '22
 $50 Historical Pricing PJM COMED, Around the Clock $48 $46 $44 $42 $40 $38 $36 $34 $32 $30 $28 $26 Cal '15 Cal '16 Cal '17 Cal '18 Cal '19 Cal '20 Cal '21 Cal '22 The information presented above was gathered
Schindler Capital Management, LLC / Dairy Advantage Program. Year Jan Feb Mar Apr May Jun Jul Aug Sep Oct Nov Dec
 Schindler Capital Management, LLC / Dairy Advantage Program Fundamental / Ag & Livestock Performance Since August 2005 Year Jan Feb Mar Apr May Jun Jul Aug Sep Oct Nov Dec 2005-11.20% 3.20% -6.67% -13.73%
THE B E A CH TO WN S O F P ALM B EA CH
 THE B E A CH TO WN S O F P ALM B EA CH C OU N T Y F LO R I D A August www.luxuryhomemarketing.com PALM BEACH TOWNS SINGLE-FAMILY HOMES LUXURY INVENTORY VS. SALES JULY Sales Luxury Benchmark Price : 7,
Soybeans face long road End to tariffs wouldn t help 2018 exports much By Bryce Knorr, senior grain market analyst
 Soybeans face long road End to tariffs wouldn t help 2018 exports much By Bryce Knorr, senior grain market analyst Forecasting grain prices is relatively easy in normal times. Most models assume the future
Historical Pricing PJM PSEG, Around the Clock. Cal '15 Cal '16 Cal '17 Cal '18 Cal '19 Cal '20 Cal '21 Cal '22
 $70 Historical Pricing PJM PSEG, Around the Clock $65 $60 $55 $50 $45 $40 $35 $30 $25 Cal '15 Cal '16 Cal '17 Cal '18 Cal '19 Cal '20 Cal '21 Cal '22 The information presented above was gathered and compiled
Business & Financial Services December 2017
 Business & Financial Services December 217 Completed Procurement Transactions by Month 2 4 175 15 125 1 75 5 2 1 Business Days to Complete 25 Jan Feb Mar Apr May Jun Jul Aug Sep Oct Nov Dec 217 Procurement
12236/12 JR/fk 1 DG B 1
 COUNCIL OF THE EUROPEAN UNION Brussels, 10 July 2012 12236/12 AGRI 491 AGRIORG 116 NOTE from: to: Subject: Commission Council Report on the situation of the dairy market Delegations will find attached
WESTWOOD LUTHERAN CHURCH Summary Financial Statement YEAR TO DATE - February 28, Over(Under) Budget WECC Fund Actual Budget
 Budget WECC Fund Actual Budget") WESTWOOD LUTHERAN CHURCH Summary Financial Statement YEAR TO DATE - February 28, 2018 General Fund Actual A B C D E F WECC Fund Actual Revenue Revenue - Faith Giving 1 $ 213 $ 234 $ (22) - Tuition $ 226
WESTWOOD LUTHERAN CHURCH Summary Financial Statement YEAR TO DATE - February 28, 2018 General Fund Actual A B C D E F WECC Fund Actual Revenue Revenue - Faith Giving 1 $ 213 $ 234 $ (22) - Tuition $ 226
By Tom Leffler and Larry Glenn. 14- Day RSI. 10-Day Moving Avg. Today's Low
 www.lefflercom.com By Tom Leffler and Larry Glenn TODAY S THOUGHT Friday, December 30, 2016 HAPPY NEW YEAR 2017 MONDAY, JAN 2 ND GRAINS OPEN AT 7 PM.TUESDAY, JAN 3 RD LIVESTOCK OPENS AT 8:30 AM Tues Jan
Notes: 1. Prior corresponding period (pcp) 12 months to 31 March Statutory EBITDA represents Net Profit After Tax (NPAT) + tax expense +
 12 months to 31 March Statutory EBITDA represents Net Profit After Tax (NPAT) + tax expense +") Notes: 1. Prior corresponding period (pcp) 12 months to 31 March 2013 2. Statutory EBITDA represents Net Profit After Tax (NPAT) + tax expense + finance costs + depreciation, amortisation and impairment
Notes: 1. Prior corresponding period (pcp) 12 months to 31 March 2013 2. Statutory EBITDA represents Net Profit After Tax (NPAT) + tax expense + finance costs + depreciation, amortisation and impairment
MARGIN M ANAGER INSIDE THIS ISSUE. Margin Watch Reports. Features DAIRY WHITE PAPER. Dairy... Pg 11 Beef... Corn... Beans... Pg 16 Wheat...
 MARGIN M ANAGER Margin Management Since 1999 The Leading Resource for Margin Management Education Learn more at MarginManager.Com Monthly INSIDE THIS ISSUE Margin Watch Reports Dairy... Pg 11 Beef... Pg
Quarterly Statistical Digest
 Quarterly Statistical Digest August Volume 27, No. 3 The Statistical Digest is a quarterly publication of the Central Bank of The Bahamas, prepared by the Research Department for issue in February, May,
SHEEP & GOAT - MARKET SITUATION - DASHBOARD Last update: 09/08/2017
 1,221 687 596 1,611 EU Trade 1,813 1,886 1,765 Qty in 1 heads Qty in 1 tonnes carcass weight 96 116 211 21 212 213 EU World Trade India (up to Apr) Uruguay United States EU India (up to Apr) Uruguay United
Beef Industry Outlook
 Glynn T. Tonsor Dept. of Agricultural Economics, Kansas State University Email: gtonsor@ksu.edu Twitter: @TonsorGlynn Industry Outlook Conf. April 25, 2018 Chicago, IL Beef Industry Outlook This presentation
December Overview. Table 1.1 Overview trends for Domestic, Export and Import trade
 December 2016 Overview Table 1.1 Overview trends for Domestic, Export and Import trade Domestic Exports Imports Month Slaughter Pigmeat (Tonnes) Volume Tonnes SW Value $AUD (Million) Volume Tonnes SW Value
By Matt Gould, Chief Market Analyst. October 1, 2018
 By Matt Gould, Chief Market Analyst October 1, 2018 2 Road Map Forecast Outlook Dairy Product Demand Analysis Nonfat Dry Milk Butter Cheese Dry Whey Global Supply & Demand Milk Supply Analysis Global USA
Demand, supply, prices and geography
 Deutsche Bank Markets Research Asia China Energy Industry Date 6 August 2014 Industry Update Demand, supply, prices and geography Getting our head around China's market for fertilizers We source this data
It s time to book 2018 fertilizer Focus on nitrogen first, using right tool for each market By Bryce Knorr, grain market analyst
 It s time to book 2018 fertilizer Focus on nitrogen first, using right tool for each market By Bryce Knorr, grain market analyst A slump in nitrogen costs this summer gives growers a chance to lock in
April Domestic Exports Imports. Volume Tonnes SW. MAT Apr-16 4, ,332 33, , % Change 2.8% 4.3% 12.6% 5.9% 2.9% 4.
 April 2017 Overview Table 1.1 Overview trends for Domestic, Export and Import trade Domestic Exports Imports Month Slaughter Pigmeat (Tonnes) Volume Tonnes SW Value $AUD (Million) Volume Tonnes SW Value
Unsettled fertilizer markets firm Phosphates and potash make noise in wake of nitrogen rally By Bryce Knorr, grain market analyst
 Unsettled fertilizer markets firm Phosphates and potash make noise in wake of nitrogen rally By Bryce Knorr, grain market analyst I ve been pushing growers to lock in fertilizer costs if they can find
Should I Buy Stocker Calves This Fall or a Fishing License?
 Should I Buy Stocker Calves This Fall or a Fishing License? Ona Report Webinar September 15, 2016 Chris Prevatt University of Florida Livestock and Forage Economist Stocker Marketing Options We must consider:
Bubble baths and better data
 Bubble baths and better data Getting a better understanding of replacement rate for workforce analyses 11 September 2017 Adam Barker: adam.barker@scarlatti.co.nz Hannah Binnie: hannah.binnie@scarlatti.co.nz
December Overview. Table 1.1 Overview trends for Domestic, Export and Import trade
 December 2018 Overview Table 1.1 Overview trends for Domestic, Export and Import trade Domestic Exports Imports Month Slaughter Pigmeat (Tonnes) Volume Tonnes SW Value $AUD (Million) Volume Tonnes SW Value
U.S. Natural Gas Storage Charts
 U.S. Natural Gas Storage Charts BMO Capital Markets Commodity Products Group November 26, 214 Total U.S. Natural Gas in Storage 5, Total Stocks This Week 3432 4, 3, 2, 1, Reported On: November 26, 214
March Domestic Exports Imports. Volume Tonnes SW. MAT Mar-16 4, ,322 32, , % Change 3.8% 5.2% 13.2% 8.0% 1.1% 1.
 March 2017 Overview Table 1.1 Overview trends for Domestic, Export and Import trade Domestic Exports Imports Month Slaughter Pigmeat (Tonnes) Volume Tonnes SW Value $AUD (Million) Volume Tonnes SW Value
MARGIN M ANAGER The Leading Resource for Margin Management Education
 Margin Management Since 1999 MARGIN M ANAGER The Leading Resource for Margin Management Education Learn more at MarginManager.Com March INSIDE THIS ISSUE Dear Ag Industry Associate, The USDA released several
Development of Economy and Financial Markets of Kazakhstan
 Development of Economy and Financial Markets of Kazakhstan National Bank of Kazakhstan Macroeconomic development GDP, real growth, % 116 112 18 14 1 113,5 11,7 216,7223,8226,5 19,8 19,8 19,3 19,619,7 199,
U.S. Steel Market Outlook. Amy Ebben ArcelorMittal USA November 30, 2018
 U.S. Steel Market Outlook Amy Ebben ArcelorMittal USA November 30, 2018 Agenda ArcelorMittal introduction U.S. steel industry performance and trade Global steel industry Review of steel markets 1 About
Spheria Australian Smaller Companies Fund
 29-Jun-18 $ 2.7686 $ 2.7603 $ 2.7520 28-Jun-18 $ 2.7764 $ 2.7681 $ 2.7598 27-Jun-18 $ 2.7804 $ 2.7721 $ 2.7638 26-Jun-18 $ 2.7857 $ 2.7774 $ 2.7690 25-Jun-18 $ 2.7931 $ 2.7848 $ 2.7764 22-Jun-18 $ 2.7771
SUMMARY OF SELECTED ECONOMIC INDICATORS
 SUMMARY OF SELECTED ECONOMIC INDICATORS RECENT DATA GRAPHS HISTORICAL DATA GRAPHS P.E.I. CONSUMER PRICE INDEX P.E.I. LABOUR FORCE STATISTICS CANADA/P.E.I. GROSS DOMESTIC PRODUCT, INCOME-BASED CANADA /
FEDERAL RESERVE BANK OF MINNEAPOLIS BANKING AND POLICY STUDIES
 FEDERAL RESERVE BANK OF MINNEAPOLIS BANKING AND POLICY STUDIES Minneapolis Options Report December 13 th Commodity Markets Option trading rose relative to two weeks ago to a more average level last week
Quarterly Statistical Digest
 Quarterly Statistical Digest February 2019 Volume 28, No. 1 The Statistical Digest is a quarterly publication of the Central Bank of The Bahamas, prepared by the Research Department for issue in February,
Key Labor Market and Economic Metrics
 Key Labor Market and Economic Metrics May Update Incorporates Data Available on May 27 th, 2016 This reference is the result of a collaboration between the Bureau of Labor Market Information and Strategic
India urea tender doesn t rattle U.S. market much Ammonia Urea UAN Phosphates Potash
 India urea tender doesn t rattle U.S. market much Retail fertilizer prices continue to have firm tone despite slow start to spring By Bryce Knorr, grain market analyst India stepped in to buy more urea
Meat Case Trends. Retail Advisory Committee Chicago, IL
 Meat Case Trends Retail Advisory Committee Chicago, IL Data provided by the Meat Solutions VMMEAT system sourced from FreshLook Marketing scanner data FreshLook Data: Represents approximately 68% of the
Marketing on Margin NPB Swine Educators Inservice. Mark Storlie ISU Swine Field Specialist or
 Marketing on Margin 2011 NPB Swine Educators Inservice Mark Storlie ISU Swine Field Specialist 563-425-3331 or mstorlie@iastate.edu Margin Blitz. Markets Eye on Margin ISU Extension Education efforts Markets.
May Domestic Exports Imports. Volume Tonnes SW. MAT May-14 4, ,960 38, ,
 May 2014 Overview Table 1.1 Overview trends for Domestic, Export and Import trade Domestic Exports Imports Month Slaughter Pigmeat (Tonnes) Volume Tonnes SW Value $AUD (Million) Volume Tonnes SW Value
Performance Report October 2018
 Structured Investments Indicative Report October 2018 This report illustrates the indicative performance of all Structured Investment Strategies from inception to 31 October 2018 Matured Investment Strategies
EU Market Situation for Poultry. Committee for the Common Organisation of the Agricultural Markets 24 August 2017
 EU Market Situation for Poultry Committee for the Common Organisation of the Agricultural Markets 24 August 217 -7.2% -7.7% -1.6% -1.7% -1.7% -2.1% -2.5% 4.1% 3.6% 3.5% 2.8% 1.9% 1.2%.8%.8%.6%.4%.2%.%.%.%.%
North American Steel Industry Recent Market Developments, Future Prospects and Key Challenges
 North American Steel Industry Recent Market Developments, Future Prospects and Key Challenges OECD Steel Committee December 1-11, 29 Paris, France * American Iron and Steel Institute (AISI) Steel Manufacturers
Margin Protection Program for Dairy Producers (MPP-Dairy) Dr. Marin Bozic
 Dr. Marin Bozic") Margin Protection Program for Dairy Producers (MPP-Dairy) Dr. Marin Bozic 2 Major Dairy Provisions of the Agricultural Act of 2014 REPEALED NEW Milk Income Loss Contract Dairy Product Price Support Program
Margin Protection Program for Dairy Producers (MPP-Dairy) Dr. Marin Bozic 2 Major Dairy Provisions of the Agricultural Act of 2014 REPEALED NEW Milk Income Loss Contract Dairy Product Price Support Program
DG AGRI DASHBOARD: PIGMEAT Last update:
 Chile EU Trade 3 134 3 073 3 096 2 940 1 696 1 590 3 265 World Trade China + H. Kong Brazil Mexico (up to Apr) Russia (up to Apr) Chile China + H. Kong Brazil Mexico (up to Apr) Russia (up to Apr) Qty
December Domestic Exports Imports. Volume Tonnes SW. MAT December-14 4, ,192 39, ,
 December 2014 Overview Table 1.1 Overview trends for Domestic, Export and Import trade Domestic Exports Imports Month Slaughter Pigmeat (Tonnes) Volume Tonnes SW Value $AUD (Million) Volume Tonnes SW Value
ACE 427 Spring Lecture 6. by Professor Scott H. Irwin
 ACE 427 Spring 2013 Lecture 6 Forecasting Crop Prices with Futures Prices by Professor Scott H. Irwin Required Reading: Schwager, J.D. Ch. 2: For Beginners Only. Schwager on Futures: Fundamental Analysis,
Pricing Considerations Cattle Pricing and Risk Management
 Pricing Considerations Cattle Pricing and Risk Management Risk Market Outlook Profit Target or Breakeven Derrell S. Peel Agricultural Economics Department Cash High risk/highest return potential Bullish
EU Market Situation for Poultry. Committee for the Common Organisation of the Agricultural Markets 22 March 2018
 EU Market Situation for Poultry Committee for the Common Organisation of the Agricultural Markets 22 March 218 -.2% -.8% -1.1% -2.4% -2.9% -3.3% -4.2% -4.5% 5.1% 4.6% 4.5% 3.8% 3.3% 2.7% 2.4% 1.5% 1.1%
Fall fertilizer costs pinch budgets Three-year high in urea leads market gains By Bryce Knorr, grain market analyst
 Fall fertilizer costs pinch budgets Three-year high in urea leads market gains By Bryce Knorr, grain market analyst Fertilizer costs start September at their highest levels in a couple years, putting further
Urea makes new push higher Supply problems crop up just as demand for fertilizer rises By Bryce Knorr, grain market analyst
 Urea makes new push higher Supply problems crop up just as demand for fertilizer rises By Bryce Knorr, grain market analyst What passes for calm in the fertilizer market never seems to last long. Just
Santiago, May 11 th, Results Presentation 1Q18
 Santiago, May 11 th, 2018 Results Presentation 1Q18 Agenda I. Highlights II. III. Financial Statements Supply, Demand and Prices IV. Farming Operation V. Prospects 2 Highlights EBIT 1Q18 USD 18.8 million
Fall 2017 Crop Outlook Webinar
 Fall 2017 Crop Outlook Webinar Chris Hurt, Professor & Extension Ag. Economist James Mintert, Professor & Director, Center for Commercial Agriculture Fall 2017 Crop Outlook Webinar October 13, 2017 50%
EMPLOYER S MUNICIPAL INCOME TAX WITHHOLDING FORMS INSTRUCTIONS FOR FILING FORM LW-1
 CITY TAX DEPT 50 TOWN SQUARE P.O. BOX 155 LIMA, OHIO 45802 PHONE (419) 221-5245 FAX (419) 998-5527 (MONTHLY OR QUARTERLY STATEMENT) FORM LW-3 (ANNUAL RECONCILIATION) EMPLOYER S MUNICIPAL INCOME TAX WITHHOLDING
Economic and Revenue Update
 Economic and Revenue Update A Briefing for the Money Committees Aubrey L. Layne, Jr. Secretary of Finance Commonwealth of Virginia www.finance.virginia.gov January 2018 Topics for Discussion National and
Introduction to Futures & Options Markets for Livestock
 Introduction to Futures & Options Markets for Livestock Kevin McNew Montana State University Marketing Your Cattle Marketing: knowing when and how to price your cattle. When Prior to sale At time of sale
Weather targets fertilizer market too Heavy rains stall shipments, delay fall applications By Bryce Knorr, grain market analyst
 Weather targets fertilizer market too Heavy rains stall shipments, delay fall applications By Bryce Knorr, grain market analyst The Midwest is finally starting to dry out from heavy rains in the first
Dairy Gross Margin Insurance
 Dairy Gross Margin Insurance Northeast Dairy Leadership Team Alan Zepp Risk Management Program Coordinator Center for Dairy Excellence Agenda What is LGM? What is a Margin? How do I use LGM? Dairy Gross
Winter fertilizer bargains could be rare Global market shows signs of stability By Bryce Knorr, grain market analyst
 Winter fertilizer bargains could be rare Global market shows signs of stability By Bryce Knorr, grain market analyst While fertilizer costs continued to edge mostly higher this week, the strong summer
Soybeans face make or break moment Futures need a two-fer to avoid losses By Bryce Knorr, senior grain market analyst
 Soybeans face make or break moment Futures need a two-fer to avoid losses By Bryce Knorr, senior grain market analyst A year ago USDA shocked the market by cutting its forecast of soybean production, helping
Commodity Price Outlook & Risks
 Commodity Outlook & Risks Research Department, Commodities Team 1 December 22, 20 www.imf.org/commodities commodities@imf.org This monthly report presents a price outlook and risk assessment for selected
Q Earnings Summary August 5, 2015
 Q2 2015 Earnings Summary August 5, 2015 Trademark of Trinseo S.A. or its affiliates Introductions & Disclosure Rules Introductions Chris Pappas, President & CEO John Feenan, Executive Vice President &
SPECIAL REPORT: U.S. ALUMINUM IMPORT MONITOR. Data through May Issued: July 2018
 SPECIAL REPORT: U.S. ALUMINUM IMPORT MONITOR Data through May 218 Issued: July 218 OVERVIEW OF SECTION 232 Section 232 of the Trade Expansion Act of 1962, as amended, authorizes the President to adjust
Indicators of the Kansas Economy
 Governor s Council of Economic Advisors Indicators of the Kansas Economy A Review of Economic Trends and the Kansas Economy 1000 S.W. Jackson St. Suite 100 Topeka, KS 66612-1354 Phone: (785) 296-0967 Fax:
BUSINESS YEAR 2009 RESULTS
 BUSINESS YEAR 2009 RESULTS Madrid, 26 February 2010 WORLD PRODUCTION OF STAINLESS STEEL Thousand Mt. 30,000 28,000 26,000 24,000 22,000 20,000 18,000 16,000 14,000 12,000 10,000 8,000 6,000 4,000 2,000
DG AGRI DASHBOARD: PIGMEAT Last update:
 EU Trade World Trade China + H. Kong Brazil Chile (up to Mar) Mexico (up to Mar) Russia (up to Mar) 1 325 1 287 China + H. Kong Brazil Chile (up to Mar) Mexico (up to Mar) Russia (up to Mar) Qty in 1000
11 May Report.xls Office of Budget & Fiscal Planning
 Education and General Fund Actual Revenues and s by Month MTD YTD Change Revenue Jul Aug Sep Oct Nov Dec Jan Feb Mar Apr May Jun Per 14 Total over FY06 Enrollment Fees $ 8,211 $ 219 $ 41,952 ($ 818) $
SmallBizU WORKSHEET 1: REQUIRED START-UP FUNDS. Online elearning Classroom. Item Required Amount ($) Fixed Assets. 1 -Buildings $ 2 -Land $
 Fixed Assets. 1 -Buildings $ 2 -Land $") WORKSHEET 1: REQUIRED START-UP FUNDS Item Required Amount () Fixed Assets 1 -Buildings 2 -Land 3 -Initial Inventory 4 -Equipment 5 -Furniture and Fixtures 6 -Vehicles 7 Total Fixed Assets Working Capital
WORKSHEET 1: REQUIRED START-UP FUNDS Item Required Amount () Fixed Assets 1 -Buildings 2 -Land 3 -Initial Inventory 4 -Equipment 5 -Furniture and Fixtures 6 -Vehicles 7 Total Fixed Assets Working Capital
Economic Activity Index ( GDB-EAI ) For the month of May 2013 G O V E R N M E N T D E V E L O P M E N T B A N K F O R P U E R T O R I C O
 For the month of May 2013 G O V E R N M E N T D E V E L O P M E N T B A N K F O R P U E R T O R I C O") Economic Activity Index ( GDB-EAI ) For the month of May 2013 General Commentary May 2013 GDB-EAI for the month of May registered a 3.4% year-over-year ( YOY ) reduction May 2013 EAI was 126.7, a 3.4%
Economic Activity Index ( GDB-EAI ) For the month of May 2013 General Commentary May 2013 GDB-EAI for the month of May registered a 3.4% year-over-year ( YOY ) reduction May 2013 EAI was 126.7, a 3.4%
Fertilizer market starts to crack India nabs lower prices in latest urea tender By Bryce Knorr, grain market analyst
 Fertilizer market starts to crack India nabs lower prices in latest urea tender By Bryce Knorr, grain market analyst When India talks in the fertilizer market, the world listens. The large importer of
MEDICAID FEDERAL SHARE OF MATCHING FUNDS
 MEDICAID FEDERAL SHARE OF MATCHING FUNDS revised by EDR based on FFIS Estimated for FFY 2019 August 3, 2017 Effective State Budget Year State adopted February 2017 State State FY real Difference in state
Leading Economic Indicator Nebraska
 Nebraska Monthly Economic Indicators: August 19, 2016 Prepared by the UNL College of Business Administration, Department of Economics Authors: Dr. Eric Thompson, Dr. William Walstad Leading Economic Indicator...1
Monthly Mutual Fund Report
 July, Monthly Mutual Fund Report Statistics for May-June Sales and Redemptions Total assets for all funds increased in May by $9. billion, or., to $.7 trillion. Money market funds had a net cash outflow
ASX Plans to Support and Service the Carbon Pollution Reduction Scheme. Anthony Collins General Manager, Energy & Environment
 ASX Plans to Support and Service the Carbon Pollution Reduction Scheme Anthony Collins General Manager, Energy & Environment Outline The Role of Financial Markets Likely Market Evolution Emissions Trading