Monthly US Lamb Market Update
|
|
|
- Samson Baldwin
- 5 years ago
- Views:
Transcription

1 June 2018 Monthly US Lamb Market Update June 2018 Issue Prepared Exclusively for Meat & Livestock Australia - Sydney June 20, 2018 USA Domes c Lamb Market - Supply/Demand Situa on US domes c lamb slaughter is running above year ago levels and combined with high retail prices and lower features this is causing product to back up in cold storage. Prices for domes c lamb are lower than a year ago. On the other hand, end users con nue to pay higher prices for imports as they compete with other markets for Australian and New Zealand product. The high price of imports con nues to nega vely impact retail featuring, however and has a knock on effect on pricing for domes- c product as well. In the four weeks ending June 16, US lamb and sheep slaughter averaged 38,400 head a week, 4.7% higher than a year ago. Slaughter remains about 1% under the five year average, however. Memorial Day holiday features were par cularly limited. The Na onal Retail Lamb Feature index in the four weeks ending June 15 averaged 1,993 points, 25% lower than a year ago and 50% lower than the five year average. Average lamb feature pries are significantly higher than a year ago. With plenty of compe ng proteins featured at lower levels lamb retail features have failed to gain trac on. The average price of loin chops at retail in the four weeks ending June 16 was $9.375.lb. compared to $8.15/lb. during the same period a year ago, a 15% increase. Wholesale lamb prices have been flat for much of the year and are currently substan ally under year ago levels. The domes c lamb cutout value in May averaged $ per pound, 5.7% lower than a year ago. In February the cutout averaged $ per pound. Prices remain under year ago levels as of this wri ng. By mid June the foresaddle value was down about 11.6% compared to last year and the hindsaddle was down 10.2%. The overall domes c lamb carcass value by mid June was down almost 11% compared to a year ago. Cold storage lamb inventory at the end of April was 34 million pounds, 18.8% higher than the previous year and 10.8% higher than the five year average. Seasonally inventories increase into the summer and fall, in part because end users look to accumulate product for year-end holidays. The big jump in inventories this early in the year should keep prices in check over the summer months. Weekly USA Lamb & Sheep Slaughter '000 Head/Week. Source: USDA. Compiled and Analysis by Steiner Consulting THOUSAND POUNDS 40,000 35,000 5-Yr Jan Feb Mar Apr May Jun Jul Aug Sep Oct Nov Dec LAMB AND MUTTON, COLD STORAGE STOCKS, THOUSAND POUNDS, END OF MONTH INVENTORIES 30,000 25,000 20,000 15,000 LAMB AND MUTTON, COLD STORAGE STOCKS JAN FEB MAR APR MAY JUN JUL AUG SEP OCT NOV DEC Avg NATIONAL RETAIL LAMB FEATURE REPORT: ACTIVITY INDEX Source: USDA. Latest data point is for June 15, ,000 18,000 16,000 14,000 12,000 10,000 8,000 6,000 4,000 5-Yr Avg ,000 - Jan Feb Mar Apr May Jun Jul Aug Sep Oct Nov Dec
2 Page 2 Imported Lamb Supply and Price Trends While lamb imports from Australia and New Zealand remain under year ago levels, import volume has increased significantly in recent weeks. In the four weeks ending June 9, lamb imports from Australia averaged around 1000 MT/week, 21% higher than the same period a year ago. Lamb imports from New Zealand during this period averaged 676 MT/wk, 8% higher than last year. The increase in imports comes at a me when domes c slaughter is also running above year ago levels and more lamb is ge ng backed up in cold storage. Imported lamb prices con nue to trade above year ago levels but those premiums will likely disappear given the shi in the supply situa on. Already the price for some items is either at part or under last year. According to USDA the wholesale price of semi boneless chilled Australian lamb leg is now 6% lower than a year ago while the price of chilled foreshank is 8.4% under a year ago. Overall imported Australian chilled lamb prices are s ll about 5% higher than a year ago. Lamb imports from South America and Europe remain minimal. As the summary table to the right shows, entries of lamb from Chile, currently the third largest importer were just 156MT through June 5 while imports from Uruguay were a mere 21MT, unchanged from four weeks ago. South American lamb is almost unknown in the US and many of the tradi onal users, whether at retail or foodservice, are not familiar with the product. South American lamb value remains well below that of product from Australia or New Zealand. This could be because of the product mix although it is our understanding that generally South American lamb trades at a discount. April trade data shows the value of Chilean lamb was $6,145 USD per MT compared to $7,178 USD per MT for Australian product. Imports of goat meat and mu on con nue to be quite limited. Australia accounts for almost all imported goat meat coming to the US. In the last four reported weeks imports averaged 366 MT/week, 44% lower than the same period a year ago. About 75% of all US mu on imports come from Australia with rest coming from New Zealand. In the last four weeks Australian mu on imports averaged 189 MT/week, 23% lower than a year ago. Mu on imports have declined sharply in recent weeks. US YTD Lamb Imported Volume. Metric Ton Data updated through May 5, 2018 Total Australia New Zealand Canada Chile Iceland Uruguay Spain Northern Ireland Mexico -1.1% -1.7% % 0 5,000 10,000 15,000 20,000 25,000 30,000 35,000 40,000 45,000 Mexico Northern New Spain Uruguay Iceland Chile Canada Ireland Zealand Australia Total ,289 25,488 38, ,430 25,924 38,708 Australian Lamb Racks, Fresh, Cap-off, 28 oz/up. 4-WK Moving Avg. Weekly Prices. Source: USDA 1,150 1,100 1,050 1, Jan Feb Mar Apr May Jun Jul Aug Sep Oct Nov Dec
3 Page 3 US Domestic Lamb Cut and Primal Values Weekly Prices from USDA. Wt. Average 6/15/2018 6/8/2018 w/w 6/16/2017 y/y US$/cwt US$/cwt % ch. US$/cwt % ch. Foresaddle 204 Rack, 8-Rib, Medium % % 209 Breast % % 207 Shoulders, Square Cut % % 210 Foreshank % % Neck % % Foresaddle Value % % Hindsaddle 232 Loin, Trimmed, 4x % % 232E Flank, Untrimmed % % 233A Leg, Trotter Off % % Hindsaddle Value % % Carcass Value % % Hindsaddle, Foresaddle and Total Lamb Cutout Value Source: USDA Mandatory Price Reporting System 500 Foresaddle Value Hindsaddle Value 450 Lamb Cutout
4 Page 4 Domestic Lamb Cutout Value, USA Source: Agricultural Marketin Service, USDA. $ per 100 lb. Dressed Carcass Yr Avg. % ch. vs. Yr Ago % ch. vs. 5-Yr Avg. Jan % 5.7% Feb % 8.3% Mar % 8.2% Apr % 8.1% May % 7.6% Jun Jul Aug Sep Oct Nov Dec Note: Monthly Cutout Value Calculated Using Weekly Data USA Domestic Lamb Cutout Value Monthly Avg. Price; Source: USDA Yr Avg Jan Feb Mar Apr May Jun Jul Aug Sep Oct Nov Dec
5 Page 5 Slaughter Lamb Price, Sioux Falls, SD Basis Monthly Average Prices, lb., $ per 100 lb Yr. Avg. % ch. vs. Yr Ago. % ch. vs. 5-Yr Avg. Jan % 4.5% Feb % 9.6% Mar % 13.7% Apr % 7.2% May % 4.0% Jun Jul Aug Sep Oct Nov Dec Source: USDA Slaughter Lamb Price, Sioux Falls, SD Basis Monthly Average Prices, lb., $ per 100 lb Yr. Avg Jan Feb Mar Apr May Jun Jul Aug Sep Oct Nov Dec
6 Page 6 Imported Lamb Price Summary Source: USDA Agricultural Marketing Service, Mandatory Price Reporting 2018 YTD Volume 2018 YTD Wt. Avg. $ 2018 YTD Implied Value Jun 19, 2017 Jun 11, 2018 Jun 18, 2018 % ch. vs. Week Ago % ch. vs. Year Ago Fresh/Chilled Pounds $/lb. Total $ AUS Shortloin, 1-Rib, 0x0 3,538,505 $ 5.53 $ 19,567,834 $ 5.60 $ 5.18 $ % 1.1% AUS Shoulder, Square-cut 1,655,780 $ 3.07 $ 5,084,410 $ 2.94 $ 2.86 $ % 1.3% AUS Rack, FR, Cap-off, 28 oz/up 2,087,827 $ $ 21,391,141 $ 9.19 $ $ % 11.7% AUS Shortloin, 1-Rib, 1x1 66,906 $ 5.23 $ 349,918 $ 5.36 $ - $ - n/a n/a AUS Leg, semi bnls 399,354 $ 4.18 $ 1,668,658 $ 4.21 $ 3.88 $ % -6.0% AUS Rack, FR, Cap-off, oz 399,281 $ $ 4,550,427 $ $ $ % 7.6% AUS Rack, FR, Cap-off, oz 192,693 $ $ 2,206,840 $ $ $ % 18.3% AUS Foreshank, VP 179,366 $ 3.61 $ 646,906 $ 3.67 $ 3.43 $ % -8.4% Subtotal 8,519,712 $ 6.51 $ 55,466,133 $ 6.21 $ 6.42 $ % 5.1% Frozen AUS Leg, Long 4,112,606 $ 2.39 $ 9,836,258 $ 3.27 $ 3.55 $ % 8.5% AUS Leg, bnls 2,773,105 $ 2.39 $ 6,632,529 $ 3.59 $ 3.80 $ % 5.2% AUS Shoulder, Square-cut, bnls 1,115,856 $ 2.39 $ 2,668,830 $ 3.78 $ 3.78 $ % -2.0% AUS Shoulder, Square-cut 2,528,633 $ 2.39 $ 6,047,817 $ 2.62 $ 2.76 $ % 3.0% AUS Foreshank, LP 1,201,640 $ 2.39 $ 2,874,003 $ 2.49 $ 2.61 $ % 6.8% AUS Hindshank, VP 341,511 $ 2.39 $ 816,803 $ 2.36 $ 2.52 $ % 31.7% AUS Rack, FR, Cap-off, 28 oz/up 319,265 $ 2.39 $ 763,597 $ 8.26 $ $ % 35.9% AUS Hindshank, LP 209,012 $ 2.39 $ 499,901 $ - $ 3.17 $ % #DIV/0! AUS Rack, FR, Cap-off, oz 416,085 $ 2.39 $ 995,165 $ 9.57 $ $ % 15.0% AUS Rack, FR, Cap-off, oz 452,903 $ 2.39 $ 1,083,223 $ 9.70 $ $ % 11.2% NZ Rack, FR, Cap-off, oz 1,567,011 $ 2.39 $ 3,747,873 $ 9.57 $ $ % 21.4% NZ Rack, FR, Cap-off, oz 1,188,862 $ 2.39 $ 2,843,441 $ 9.50 $ $ % 20.7% NZ Rack, FR, Cap-off, 20 oz/up 519,250 $ 2.39 $ 1,241,908 $ 9.00 $ $ % 28.4% NZ Rack, FR, Cap-off, 12 oz/dn 56,161 $ 2.39 $ 134,322 $ 9.82 $ $ % 19.9% Subtotal 16,801,900 $ 2.39 $ 40,185,671 $ 4.80 $ 5.50 $ % 14.7% Please note that the prices, volume and sales value reported above represents only subset of total US lamb imports. It only reflects the data reported through the Mandatory Price Repor ng System. It is only for nego ated sales, no formula sales. Trade from smaller importers and traders is not included in the summary above. Data that does not meet the confiden ality guidelines also is not included in the above table.
7 Page 7 USA LAMB & MUTTON QUARTERLY SLAUGHTER, PRODUCTION, IMPORTS, EXPORTS AND DISAPPEARANCE. CARCASS WT. EQUIVALENT (CWE) =A x B A B C D E F G =C+D-E+F+G Year & Quarter Slaughter % ch. Avg. Carc. Wt. % ch. Comm. Lamb Prod. % ch. Imports % ch. Exports % ch. Farm Production Adj. to End. Stocks to Balance Total Disapp. % ch. 000 Head Y/Y Lbs. Y/Y (Mil. Lbs.) Y/Y (Mil. Lbs.) Y/Y (Mil. Lbs.) Y/Y (Mil. Lbs.) (Mil. Lbs.) (Mil. Lbs.) Y/Y st Qtr % % % % % % 2nd Qtr % % % % % % 3rd Qtr % % % % % % 4th Qtr % % % % % % Year 2, % % % % % % st Qtr % % % % % % 2nd Qtr % % % % % % 3rd Qtr % % % % % % 4th Qtr % % % % % % Year 2, % % % % % % st Qtr % % % % % % 2nd Qtr % % % % % % 3rd Qtr % % % % % % 4th Qtr % % % % % % Year 2, % % % % % % st Qtr % % % % % % 2nd Qtr % % % % % % 3rd Qtr % % % % % % 4th Qtr % % % % % % Year 2, % % % % % % st Qtr % % % % % % 2nd Qtr % % % % % % 3rd Qtr % % % % % % 4th Qtr % % % % % % Year 2, % % % % % % st Qtr % % % % % % * 2nd Qtr % % % % % % * 3rd Qtr % % % % % % * 4th Qtr % % % % % % * Year 2, % % % % % % 2019 * 1st Qtr % % % % % % * 2nd Qtr % % % % % % * 3rd Qtr % % % % % % * 4th Qtr % % % % % % * Year 2, % % % % % % * Estimates Source: This balance sheet was developed and is maintained by the Livestock Market Informa on Center
8 Page 8 Lamb & Sheep Slaughter. Monthly. '000 Head Yr Avg. % ch Yr Ago % ch 5-Yr Avg. Jan % 1.8% Feb % -0.6% Mar % 1.1% Apr % -6.6% May Jun Jul Aug Sep Oct Nov Dec Source: USDA Lamb & Sheep Slaughter. Monthly. '000 Head Monthly Data. Source: USDA Yr Avg Jan Feb Mar Apr May Jun Jul Aug Sep Oct Nov Dec
9 Page 9 Lamb Yearling Dressed Weights. Monthly. Avg. Pounds per Carcass Yr Avg. % ch Yr Ago % ch 5-Yr Avg. Jan % 2.3% Feb % 2.5% Mar % 1.2% Apr % 1.2% May Jun Jul Aug Sep Oct Nov Dec Source: USDA Lamb Yearling Dressed Weights. Monthly. Avg. Pounds per Carcass Monthly Data. Source: USDA Yr Avg Jan Feb Mar Apr May Jun Jul Aug Sep Oct Nov Dec Source: USDA
10 Page 10 Lamb Yearling Production. Monthly. Carcass Wt. Basis. Million Lb Yr Avg. % ch Yr Ago % ch 5-Yr Avg. Jan % 2.5% Feb % -2.0% Mar % 1.0% Apr % -5.9% May Jun Jul Aug Sep Oct Nov Dec Source: USDA Lamb Yearling Production. Monthly. Carcass Wt. Basis. Million Lb. Monthly Data. Source: USDA Yr Avg Jan Feb Mar Apr May Jun Jul Aug Sep Oct Nov Dec
11 Page 11 Y/Y Ch. in Apr. 18 vs. Apr 17 US Mutton, Goat, Lamb Imports Source: USDA/FAS Units: Metric Tons World Total -806 Australia(*) 207 Mexico Other Change in total imports: -7% Iceland Canada 0-2 Chile -46 New Zealand(*) ,500-1,300-1, Quantity of US Imports of Fr/Frz Mutton, Goat, Lamb: World Total Source: USDA/FAS. Units: Metric Ton. Analysis by: Steiner Consulting ( ) 18,000 16,000 14,000 12,000 10,000 8,000 6,000 4,000 2,000 5-Yr Avg
12 Page 12 Y/Y Ch. in Apr. 18 vs. Apr 17 US Mutton, Goat, Lamb Import Value ($) Source: USDA/FAS Units: US Dollars World Total 368,692 Australia(*) 4,184,985 Other 214,640 Mexico 128,447 Canada Iceland Change in total import value: 0% -2,427 3,899 Chile -171,891 New Zealand(*) -3,988,961-9,000,000-4,000,000 1,000,000 6,000,000 $ Value of US Imports of Fr/Frz Mutton, Goat, Lamb: World Total Source: USDA/FAS. Units: US Dollars. Analysis by: Steiner Consulting ( ) 120,000, ,000, ,000,000 90,000,000 80,000,000 70,000,000 60,000,000 50,000,000 40,000,000 30,000, Yr Avg 20,000,000
13 Page 13 TOP US LAMB IMPORT MARKETS IN 2018 TOP US LAMB IMPORT MARKETS IN 2017 Total Volume and Country Shares for Period Jan - Apr 2018, MT Total Volume and Country Shares for Period Jan - Apr 2017, MT New Zealand 20% New Zealand 23% 47K 51K Australia 80% Australia 77% Quantity of US Imports of Fr/Frz Mutton, Goat, Lamb: Australia(*) Source: USDA/FAS. Units: Metric Ton. Analysis by: Steiner Consulting ( ) 14,000 12,000 10,000 8,000 6,000 4, Yr Avg Quantity of US Imports of Fr/Frz Mutton, Goat, Lamb: New Zealand(*) Source: USDA/FAS. Units: Metric Ton. Analysis by: Steiner Consulting ( ) 4,000 3,500 3,000 2,500 2,000 1,500 1, Yr Avg 2, $ Value of US Imports of Fr/Frz Mutton, Goat, Lamb: Australia(*) Source: USDA/FAS. Units: US Dollars. Analysis by: Steiner Consulting ( ) 90,000,000 80,000,000 70,000,000 60,000,000 50,000, Yr Avg $ Value of US Imports of Fr/Frz Mutton, Goat, Lamb: New Zealand(*) Source: USDA/FAS. Units: US Dollars. Analysis by: Steiner Consulting ( ) 35,000,000 30,000,000 25,000,000 20,000,000 40,000,000 30,000,000 20,000,000 15,000,000 10,000,000 10,000,000-5,000, Yr Avg

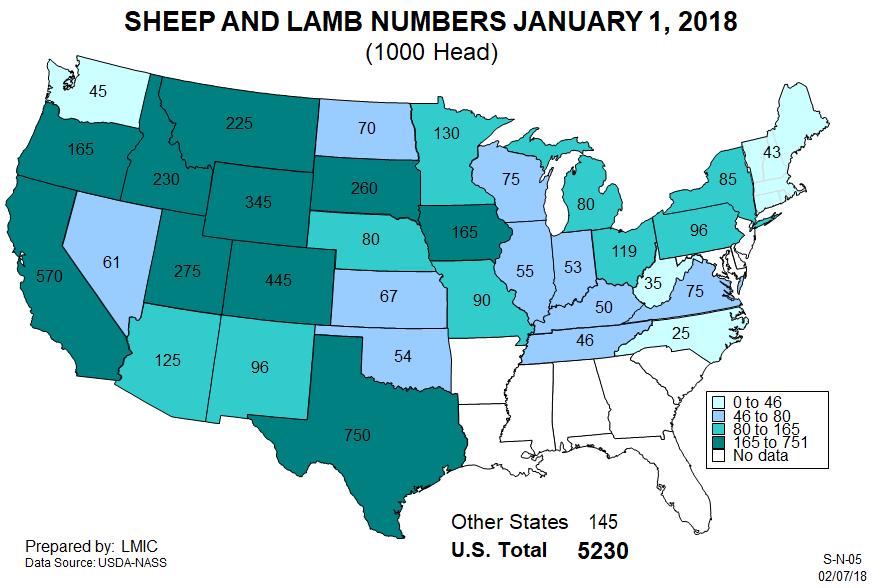
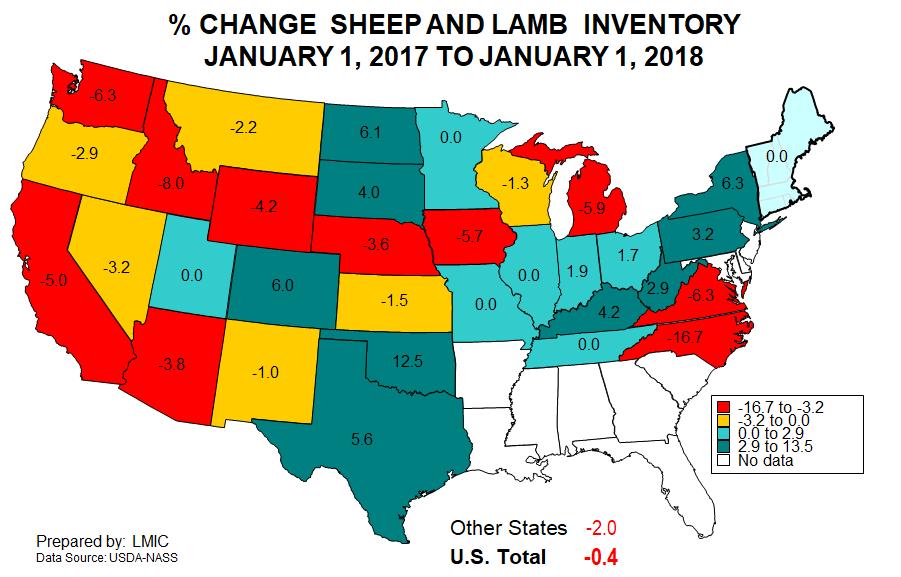
14 Page 14 60, HEAD JANUARY 1 SHEEP & LAMB INVENTORY Source: USDA 1942: 56,213 50,000 40,000 30, : 33,170 20,000 10, : 11, : 5, , 5,230
15 Page 15
16 Page mil lb. Domestic Lamb Production + Imports Imports US domestic production
Monthly US Lamb Market Update
 April 2018 Monthly US Lamb Market Update May 2018 Issue Prepared Exclusively for Meat & Livestock Australia - Sydney May 17, 2018 USA Domes c Lamb Market - Supply/Demand Situa on US domes c lamb slaughter
Monthly US Lamb Market Update
 August 2018 Monthly US Lamb Market Update November 2018 Issue Prepared Exclusively for Meat & Livestock Australia - Sydney November 27, 2018 USA Domes c Lamb Market - Supply/Demand Situa on High prices,
Monthly US Lamb Market Update
 February 2018 Monthly US Lamb Market Update February 2018 Issue Prepared Exclusively for Meat & Livestock Australia - Sydney February 21, 2018 USA Domes c Lamb Market - Supply/Demand Situa on Special Edi
Monthly US Lamb Market Update
 January 2018 Monthly US Lamb Market Update January 2018 Issue Prepared Exclusively for Meat & Livestock Australia - Sydney January 13, 2018 USA Domes c Lamb Market - Supply/Demand Situa on USDA will issue
Monthly US Lamb Market Update
 February 2019 Monthly US Lamb Market Update February 2019 Issue Prepared Exclusively for Meat & Livestock Australia - Sydney February 19, 2019 USA Domes c Lamb Market - Supply/Demand Situa on The annual
Is it time for a boneless beef trimmings derivative contract? David Farley 1 st March 2012
 Is it time for a boneless beef trimmings derivative contract? David Farley 1 st March 2012 Why does AAco care? 680,000 head of cattle Substantial price risk over which AAco has limited ability to take
Monthly Hog Market Update United States Hog Slaughter
 This information is provided as a resource by Saskatchewan Agriculture staff All prices are in Canadian dollars unless otherwise noted. Please use this information at your own risk. Monthly Hog Market
SHEEP & GOAT - MARKET SITUATION - DASHBOARD Last update: 25/04/2018
 75 57 25 29 EU Trade 1 611 1 813 1 886 1 765 1 438 1 21 212 213 EU India (up to Jan) United States China + H. Kong EU India (up to Jan) United States China + H. Kong Iran Japan Iran Japan World Trade New
Livestock Risk Protection (LRP) A New Price Risk Management Tool for Lamb Producers
 A New Price Risk Management Tool for Lamb Producers") Livestock Risk Protection (LRP) A New Price Risk Management Tool for Lamb Producers Tim Petry, Livestock Economist http://www.ndsu.edu/livestockeconomics 8/04/2017 LRP revenue insurance program that is
Livestock Risk Protection (LRP) A New Price Risk Management Tool for Lamb Producers Tim Petry, Livestock Economist http://www.ndsu.edu/livestockeconomics 8/04/2017 LRP revenue insurance program that is
EU Pigmeat Market Situation. Meat Market Observatory Economic Board meeting 02 October 2018
 EU Pigmeat Market Situation Meat Market Observatory Economic Board meeting 2 October 218 EXCHANGE RATE INDEX/EURO 14 Index of daily exchange rates of the main trading partners compared to the Euro 13 12
BEEF & VEAL MARKET SITUATION. "Single CMO" Management Committee 18 September 2014
 BEEF & VEAL MARKET SITUATION "Single CMO" Management Committee L I V E S T O C K JUNE SURVEY E.U. E V O L U T I O N T O T A L B O V I N E May/Jun %Var %Var %Var %Var TOT LIVESTOCK BOVINE < 1 Year BOVINE
Mil. lbs, carc Thousand Hd. 70
 Sponsored by One last reminder that CME Group will USE new se lement price computa on methods for Live Ca le, Feeder Ca le and Lean Hogs contracts TODAY. CME s Special Execu ve Report 7213 detailing the
Cattle Market And Controversy
 Cattle Market And Controversy Tri County Beef Cattle Merkting 2016 Jasper, TX April 21, 2016 David P. Anderson Professor and Extension Economist Overview Price Correction Increasing Beef Supply Price Relationships
Livestock Risk Protection (LRP)
") Livestock Risk Protection (LRP) A Price Risk Management Tool for Livestock Producers Tim Petry Extension Livestock Economist www.ndsu.edu/livestockeconomics November 14, 2017 FeedlotMgmtClass Nov2017.pptx
Livestock Risk Protection (LRP) A Price Risk Management Tool for Livestock Producers Tim Petry Extension Livestock Economist www.ndsu.edu/livestockeconomics November 14, 2017 FeedlotMgmtClass Nov2017.pptx
Financial Results for Fourth Quarter and Year Ended December 30, Pilgrim s Pride Corporation (NASDAQ: PPC)
") Financial Results for Fourth Quarter and Year December 30, 2018 Pilgrim s Pride Corporation (NASDAQ: PPC) Cautionary Notes and Forward-Looking Statements Statements contained in this presentation that
Financial Results for Fourth Quarter and Year December 30, 2018 Pilgrim s Pride Corporation (NASDAQ: PPC) Cautionary Notes and Forward-Looking Statements Statements contained in this presentation that
XML Publisher Balance Sheet Vision Operations (USA) Feb-02
 Feb-02") Page:1 Apr-01 May-01 Jun-01 Jul-01 ASSETS Current Assets Cash and Short Term Investments 15,862,304 51,998,607 9,198,226 Accounts Receivable - Net of Allowance 2,560,786
Page:1 Apr-01 May-01 Jun-01 Jul-01 ASSETS Current Assets Cash and Short Term Investments 15,862,304 51,998,607 9,198,226 Accounts Receivable - Net of Allowance 2,560,786
Financial Results for Third Quarter Ended Sep 30, Pilgrim s Pride Corporation (NASDAQ: PPC)
") Financial Results for Third Quarter Ended Sep 30, 2018 Pilgrim s Pride Corporation (NASDAQ: PPC) Cautionary Notes and Forward-Looking Statements Statements contained in this presentation that share our
Financial Results for Third Quarter Ended Sep 30, 2018 Pilgrim s Pride Corporation (NASDAQ: PPC) Cautionary Notes and Forward-Looking Statements Statements contained in this presentation that share our
MONTHLY MILK & FEED MARKET UPDATE
 MONTHLY MILK & FEED MARKET UPDATE Provided By: Curtis Bosma - (312) 870-1185 - curtisb@highgroundtrading.com December 2014 A Sinking Ship? As the leaves began to fall, so did milk futures. Cheese sellers
Tim Petry Livestock Economist Agribusiness and Applied Economics.
 Tim Petry Livestock Economist Agribusiness and Applied Economics www.ag.ndsu.edu/aginfo/lsmkt/livestock.htm Lean Hogs.ppt 2-19-08 www.ers.usda.gov Livestock, Dairy, Poultry Outlook www.nass.usda.gov Hog
Dairy Outlook and Utilizing MPP- and LGM-Dairy: Kenny Burdine University of Kentucky Agricultural Economics
 Dairy Outlook and Utilizing MPP- and LGM-Dairy: 2015 Kenny Burdine University of Kentucky Agricultural Economics Outline for Discussion Review of Current Market Conditions Cow numbers, production expectations,
Dairy Outlook. July By Jim Dunn Professor of Agricultural Economics, Penn State University. Market Psychology
 Dairy Outlook July 2013 By Jim Dunn Professor of Agricultural Economics, Penn State University Market Psychology The CME block price fell by 5% in the last month, ending 8.75 /lb. lower at $1.665/lb. Most
Soybeans face long road End to tariffs wouldn t help 2018 exports much By Bryce Knorr, senior grain market analyst
 Soybeans face long road End to tariffs wouldn t help 2018 exports much By Bryce Knorr, senior grain market analyst Forecasting grain prices is relatively easy in normal times. Most models assume the future
Historical Pricing PJM COMED, Around the Clock. Cal '15 Cal '16 Cal '17 Cal '18 Cal '19 Cal '20 Cal '21 Cal '22
 $50 Historical Pricing PJM COMED, Around the Clock $48 $46 $44 $42 $40 $38 $36 $34 $32 $30 $28 $26 Cal '15 Cal '16 Cal '17 Cal '18 Cal '19 Cal '20 Cal '21 Cal '22 The information presented above was gathered
Schindler Capital Management, LLC / Dairy Advantage Program. Year Jan Feb Mar Apr May Jun Jul Aug Sep Oct Nov Dec
 Schindler Capital Management, LLC / Dairy Advantage Program Fundamental / Ag & Livestock Performance Since August 2005 Year Jan Feb Mar Apr May Jun Jul Aug Sep Oct Nov Dec 2005-11.20% 3.20% -6.67% -13.73%
Futures and Options Live Cattle Feeder Cattle. Tim Petry Livestock Marketing Economist NDSU Extension
 Futures and Options Live Cattle Feeder Cattle Tim Petry Livestock Marketing Economist NDSU Extension www.ndsu.edu/livestockeconomcs FutOpt-Jan2019 Price Risk Management Tools Cash forward contract Video
Historical Pricing PJM PSEG, Around the Clock. Cal '15 Cal '16 Cal '17 Cal '18 Cal '19 Cal '20 Cal '21 Cal '22
 $70 Historical Pricing PJM PSEG, Around the Clock $65 $60 $55 $50 $45 $40 $35 $30 $25 Cal '15 Cal '16 Cal '17 Cal '18 Cal '19 Cal '20 Cal '21 Cal '22 The information presented above was gathered and compiled
Meat Case Trends. Retail Advisory Committee Chicago, IL
 Meat Case Trends Retail Advisory Committee Chicago, IL Data provided by the Meat Solutions VMMEAT system sourced from FreshLook Marketing scanner data FreshLook Data: Represents approximately 68% of the
Development of Economy and Financial Markets of Kazakhstan
 Development of Economy and Financial Markets of Kazakhstan National Bank of Kazakhstan Macroeconomic development GDP, real growth, % 116 112 18 14 1 113,5 11,7 216,7223,8226,5 19,8 19,8 19,3 19,619,7 199,
ECON 337 Agricultural Marketing Spring Exam I. Answer each of the following questions by circling True or False (2 point each).
.") Name: KEY ECON 337 Agricultural Marketing Spring 2014 Exam I Answer each of the following questions by circling True or False (2 point each). 1. True False Futures and options contracts have flexible sizes
Name: KEY ECON 337 Agricultural Marketing Spring 2014 Exam I Answer each of the following questions by circling True or False (2 point each). 1. True False Futures and options contracts have flexible sizes
Performance Report October 2018
 Structured Investments Indicative Report October 2018 This report illustrates the indicative performance of all Structured Investment Strategies from inception to 31 October 2018 Matured Investment Strategies
Futures and Options Live Cattle Feeder Cattle. Tim Petry Livestock Marketing Economist NDSU Extension Service
 Futures and Options Live Cattle Feeder Cattle Tim Petry Livestock Marketing Economist NDSU Extension Service FutOpt-Jan2018 Price Risk Management Tools Cash forward contract Video and internet auctions
WESTWOOD LUTHERAN CHURCH Summary Financial Statement YEAR TO DATE - February 28, Over(Under) Budget WECC Fund Actual Budget
 Budget WECC Fund Actual Budget") WESTWOOD LUTHERAN CHURCH Summary Financial Statement YEAR TO DATE - February 28, 2018 General Fund Actual A B C D E F WECC Fund Actual Revenue Revenue - Faith Giving 1 $ 213 $ 234 $ (22) - Tuition $ 226
WESTWOOD LUTHERAN CHURCH Summary Financial Statement YEAR TO DATE - February 28, 2018 General Fund Actual A B C D E F WECC Fund Actual Revenue Revenue - Faith Giving 1 $ 213 $ 234 $ (22) - Tuition $ 226
Retailers slash ammonia prices but urea shoots higher Weekly Fertilizer Review for February 22, 2016
 Retailers slash ammonia prices but urea shoots higher Weekly Fertilizer Review for February 22, 216 A fairly quiet start to retail fertilizer trade in 216 came to very abrupt halt this week, with big changes
Higher Beef Prices with Higher Prices to Come
 Louisiana Cattle Market Update Friday, August 31 st, 2012 Ross Pruitt, Department of Agricultural Economics and Agribusiness LSU AgCenter Higher Beef Prices with Higher Prices to Come As Labor Day weekend
Quarterly Statistical Digest
 Quarterly Statistical Digest August Volume 27, No. 3 The Statistical Digest is a quarterly publication of the Central Bank of The Bahamas, prepared by the Research Department for issue in February, May,
U.S. Steel Market Outlook. Amy Ebben ArcelorMittal USA November 30, 2018
 U.S. Steel Market Outlook Amy Ebben ArcelorMittal USA November 30, 2018 Agenda ArcelorMittal introduction U.S. steel industry performance and trade Global steel industry Review of steel markets 1 About
SHEEP & GOAT - MARKET SITUATION - DASHBOARD Last update: 09/08/2017
 1,221 687 596 1,611 EU Trade 1,813 1,886 1,765 Qty in 1 heads Qty in 1 tonnes carcass weight 96 116 211 21 212 213 EU World Trade India (up to Apr) Uruguay United States EU India (up to Apr) Uruguay United
It s time to book 2018 fertilizer Focus on nitrogen first, using right tool for each market By Bryce Knorr, grain market analyst
 It s time to book 2018 fertilizer Focus on nitrogen first, using right tool for each market By Bryce Knorr, grain market analyst A slump in nitrogen costs this summer gives growers a chance to lock in
THE B E A CH TO WN S O F P ALM B EA CH
 THE B E A CH TO WN S O F P ALM B EA CH C OU N T Y F LO R I D A August www.luxuryhomemarketing.com PALM BEACH TOWNS SINGLE-FAMILY HOMES LUXURY INVENTORY VS. SALES JULY Sales Luxury Benchmark Price : 7,
EU Market Situation for Poultry. Committee for the Common Organisation of the Agricultural Markets 24 August 2017
 EU Market Situation for Poultry Committee for the Common Organisation of the Agricultural Markets 24 August 217 -7.2% -7.7% -1.6% -1.7% -1.7% -2.1% -2.5% 4.1% 3.6% 3.5% 2.8% 1.9% 1.2%.8%.8%.6%.4%.2%.%.%.%.%
U.S. Natural Gas Storage Charts
 U.S. Natural Gas Storage Charts BMO Capital Markets Commodity Products Group November 26, 214 Total U.S. Natural Gas in Storage 5, Total Stocks This Week 3432 4, 3, 2, 1, Reported On: November 26, 214
12236/12 JR/fk 1 DG B 1
 COUNCIL OF THE EUROPEAN UNION Brussels, 10 July 2012 12236/12 AGRI 491 AGRIORG 116 NOTE from: to: Subject: Commission Council Report on the situation of the dairy market Delegations will find attached
By Tom Leffler and Larry Glenn. 14- Day RSI. 10-Day Moving Avg. Today's Low
 www.lefflercom.com By Tom Leffler and Larry Glenn TODAY S THOUGHT Friday, December 30, 2016 HAPPY NEW YEAR 2017 MONDAY, JAN 2 ND GRAINS OPEN AT 7 PM.TUESDAY, JAN 3 RD LIVESTOCK OPENS AT 8:30 AM Tues Jan
Demand, supply, prices and geography
 Deutsche Bank Markets Research Asia China Energy Industry Date 6 August 2014 Industry Update Demand, supply, prices and geography Getting our head around China's market for fertilizers We source this data
Spheria Australian Smaller Companies Fund
 29-Jun-18 $ 2.7686 $ 2.7603 $ 2.7520 28-Jun-18 $ 2.7764 $ 2.7681 $ 2.7598 27-Jun-18 $ 2.7804 $ 2.7721 $ 2.7638 26-Jun-18 $ 2.7857 $ 2.7774 $ 2.7690 25-Jun-18 $ 2.7931 $ 2.7848 $ 2.7764 22-Jun-18 $ 2.7771
Quarterly Statistical Digest
 Quarterly Statistical Digest February 2019 Volume 28, No. 1 The Statistical Digest is a quarterly publication of the Central Bank of The Bahamas, prepared by the Research Department for issue in February,
Dairy Outlook. August By Jim Dunn Professor of Agricultural Economics, Penn State University. Market Psychology
 Dairy Outlook August 2014 By Jim Dunn Professor of Agricultural Economics, Penn State University Market Psychology The prices of all dairy products have been mixed since last month. The CME block cheese
SUMMARY OF SELECTED ECONOMIC INDICATORS
 SUMMARY OF SELECTED ECONOMIC INDICATORS RECENT DATA GRAPHS HISTORICAL DATA GRAPHS P.E.I. CONSUMER PRICE INDEX P.E.I. LABOUR FORCE STATISTICS CANADA/P.E.I. GROSS DOMESTIC PRODUCT, INCOME-BASED CANADA /
Business & Financial Services December 2017
 Business & Financial Services December 217 Completed Procurement Transactions by Month 2 4 175 15 125 1 75 5 2 1 Business Days to Complete 25 Jan Feb Mar Apr May Jun Jul Aug Sep Oct Nov Dec 217 Procurement
Key Labor Market and Economic Metrics
 Key Labor Market and Economic Metrics May Update Incorporates Data Available on May 27 th, 2016 This reference is the result of a collaboration between the Bureau of Labor Market Information and Strategic
EU Market Situation for Poultry. Committee for the Common Organisation of the Agricultural Markets 22 March 2018
 EU Market Situation for Poultry Committee for the Common Organisation of the Agricultural Markets 22 March 218 -.2% -.8% -1.1% -2.4% -2.9% -3.3% -4.2% -4.5% 5.1% 4.6% 4.5% 3.8% 3.3% 2.7% 2.4% 1.5% 1.1%
Santiago, May 11 th, Results Presentation 1Q18
 Santiago, May 11 th, 2018 Results Presentation 1Q18 Agenda I. Highlights II. III. Financial Statements Supply, Demand and Prices IV. Farming Operation V. Prospects 2 Highlights EBIT 1Q18 USD 18.8 million
December Overview. Table 1.1 Overview trends for Domestic, Export and Import trade
 December 2016 Overview Table 1.1 Overview trends for Domestic, Export and Import trade Domestic Exports Imports Month Slaughter Pigmeat (Tonnes) Volume Tonnes SW Value $AUD (Million) Volume Tonnes SW Value
DG AGRI DASHBOARD: PIGMEAT Last update:
 Chile EU Trade 3 134 3 073 3 096 2 940 1 696 1 590 3 265 World Trade China + H. Kong Brazil Mexico (up to Apr) Russia (up to Apr) Chile China + H. Kong Brazil Mexico (up to Apr) Russia (up to Apr) Qty
April Domestic Exports Imports. Volume Tonnes SW. MAT Apr-16 4, ,332 33, , % Change 2.8% 4.3% 12.6% 5.9% 2.9% 4.
 April 2017 Overview Table 1.1 Overview trends for Domestic, Export and Import trade Domestic Exports Imports Month Slaughter Pigmeat (Tonnes) Volume Tonnes SW Value $AUD (Million) Volume Tonnes SW Value
DG AGRI DASHBOARD: PIGMEAT Last update:
 EU Trade World Trade China + H. Kong Brazil Chile (up to Mar) Mexico (up to Mar) Russia (up to Mar) 1 325 1 287 China + H. Kong Brazil Chile (up to Mar) Mexico (up to Mar) Russia (up to Mar) Qty in 1000
SPECIAL REPORT: U.S. ALUMINUM IMPORT MONITOR. Data through May Issued: July 2018
 SPECIAL REPORT: U.S. ALUMINUM IMPORT MONITOR Data through May 218 Issued: July 218 OVERVIEW OF SECTION 232 Section 232 of the Trade Expansion Act of 1962, as amended, authorizes the President to adjust
December Overview. Table 1.1 Overview trends for Domestic, Export and Import trade
 December 2018 Overview Table 1.1 Overview trends for Domestic, Export and Import trade Domestic Exports Imports Month Slaughter Pigmeat (Tonnes) Volume Tonnes SW Value $AUD (Million) Volume Tonnes SW Value
March Domestic Exports Imports. Volume Tonnes SW. MAT Mar-16 4, ,322 32, , % Change 3.8% 5.2% 13.2% 8.0% 1.1% 1.
 March 2017 Overview Table 1.1 Overview trends for Domestic, Export and Import trade Domestic Exports Imports Month Slaughter Pigmeat (Tonnes) Volume Tonnes SW Value $AUD (Million) Volume Tonnes SW Value
Department of Agricultural and Resource Economics
 D 34 Department of Agricultural and Resource Economics BASIS ESTIMATES FOR FEEDER CATTLE AND FED CATTLE February 2018 Andrew P. Griffith, Assistant Professor Becky Bowling, UT Extension Specialist Table
Fall 2017 Crop Outlook Webinar
 Fall 2017 Crop Outlook Webinar Chris Hurt, Professor & Extension Ag. Economist James Mintert, Professor & Director, Center for Commercial Agriculture Fall 2017 Crop Outlook Webinar October 13, 2017 50%
EMPLOYER S MUNICIPAL INCOME TAX WITHHOLDING FORMS INSTRUCTIONS FOR FILING FORM LW-1
 CITY TAX DEPT 50 TOWN SQUARE P.O. BOX 155 LIMA, OHIO 45802 PHONE (419) 221-5245 FAX (419) 998-5527 (MONTHLY OR QUARTERLY STATEMENT) FORM LW-3 (ANNUAL RECONCILIATION) EMPLOYER S MUNICIPAL INCOME TAX WITHHOLDING
Current and Potential Losses to the U.S. Pork Industry from Retaliatory Tariffs Focus on Mexico June 13, 2018 Background Tariff Details
 Current and Potential Losses to the U.S. Pork Industry from Retaliatory Tariffs Focus on Mexico June 13, 2018 Background The recent implementation of duties and threats of imposing duties on U.S. imports
India urea tender doesn t rattle U.S. market much Ammonia Urea UAN Phosphates Potash
 India urea tender doesn t rattle U.S. market much Retail fertilizer prices continue to have firm tone despite slow start to spring By Bryce Knorr, grain market analyst India stepped in to buy more urea
Economic and Revenue Update
 Economic and Revenue Update A Briefing for the Money Committees Aubrey L. Layne, Jr. Secretary of Finance Commonwealth of Virginia www.finance.virginia.gov January 2018 Topics for Discussion National and
Weather targets fertilizer market too Heavy rains stall shipments, delay fall applications By Bryce Knorr, grain market analyst
 Weather targets fertilizer market too Heavy rains stall shipments, delay fall applications By Bryce Knorr, grain market analyst The Midwest is finally starting to dry out from heavy rains in the first
Marketing on Margin NPB Swine Educators Inservice. Mark Storlie ISU Swine Field Specialist or
 Marketing on Margin 2011 NPB Swine Educators Inservice Mark Storlie ISU Swine Field Specialist 563-425-3331 or mstorlie@iastate.edu Margin Blitz. Markets Eye on Margin ISU Extension Education efforts Markets.
May Domestic Exports Imports. Volume Tonnes SW. MAT May-14 4, ,960 38, ,
 May 2014 Overview Table 1.1 Overview trends for Domestic, Export and Import trade Domestic Exports Imports Month Slaughter Pigmeat (Tonnes) Volume Tonnes SW Value $AUD (Million) Volume Tonnes SW Value
Winter fertilizer bargains could be rare Global market shows signs of stability By Bryce Knorr, grain market analyst
 Winter fertilizer bargains could be rare Global market shows signs of stability By Bryce Knorr, grain market analyst While fertilizer costs continued to edge mostly higher this week, the strong summer
Soybeans face make or break moment Futures need a two-fer to avoid losses By Bryce Knorr, senior grain market analyst
 Soybeans face make or break moment Futures need a two-fer to avoid losses By Bryce Knorr, senior grain market analyst A year ago USDA shocked the market by cutting its forecast of soybean production, helping
Unsettled fertilizer markets firm Phosphates and potash make noise in wake of nitrogen rally By Bryce Knorr, grain market analyst
 Unsettled fertilizer markets firm Phosphates and potash make noise in wake of nitrogen rally By Bryce Knorr, grain market analyst I ve been pushing growers to lock in fertilizer costs if they can find
December Domestic Exports Imports. Volume Tonnes SW. MAT December-14 4, ,192 39, ,
 December 2014 Overview Table 1.1 Overview trends for Domestic, Export and Import trade Domestic Exports Imports Month Slaughter Pigmeat (Tonnes) Volume Tonnes SW Value $AUD (Million) Volume Tonnes SW Value
CALHOUN COUNTY CHAMBER OF COMMERCE AND VISITORS CENTER
 2017 Economic Forum CALHOUN COUNTY CHAMBER OF COMMERCE AND VISITORS CENTER Information provided by School of Business and Industry THANK YOU to our SPONSORS Calhoun County Economy Forum National Update
U.S. Sugar Monthly Import and Re-Exports
 U.S. Sugar Monthly Import and Re-Exports Fiscal Year (FY) 2018 Report February 2018 The February WASDE report shows FY 2018 WTO raw sugar tariff-rate quota (TRQ) shortfall projected at 99,208 short tons
MARGIN M ANAGER INSIDE THIS ISSUE. Margin Watch Reports. Features DAIRY WHITE PAPER. Dairy... Pg 11 Beef... Corn... Beans... Pg 16 Wheat...
 MARGIN M ANAGER Margin Management Since 1999 The Leading Resource for Margin Management Education Learn more at MarginManager.Com Monthly INSIDE THIS ISSUE Margin Watch Reports Dairy... Pg 11 Beef... Pg
Answer each of the following questions by circling True or False (2 points each).
.") Name: Econ 337 Agricultural Marketing, Spring 2019 Exam I; March 28, 2019 Answer each of the following questions by circling True or False (2 points each). 1. True False Some risk transfer premium is appropriate
Name: Econ 337 Agricultural Marketing, Spring 2019 Exam I; March 28, 2019 Answer each of the following questions by circling True or False (2 points each). 1. True False Some risk transfer premium is appropriate
ACE 427 Spring Lecture 6. by Professor Scott H. Irwin
 ACE 427 Spring 2013 Lecture 6 Forecasting Crop Prices with Futures Prices by Professor Scott H. Irwin Required Reading: Schwager, J.D. Ch. 2: For Beginners Only. Schwager on Futures: Fundamental Analysis,
Economic Activity Index ( GDB-EAI ) For the month of May 2013 G O V E R N M E N T D E V E L O P M E N T B A N K F O R P U E R T O R I C O
 For the month of May 2013 G O V E R N M E N T D E V E L O P M E N T B A N K F O R P U E R T O R I C O") Economic Activity Index ( GDB-EAI ) For the month of May 2013 General Commentary May 2013 GDB-EAI for the month of May registered a 3.4% year-over-year ( YOY ) reduction May 2013 EAI was 126.7, a 3.4%
Economic Activity Index ( GDB-EAI ) For the month of May 2013 General Commentary May 2013 GDB-EAI for the month of May registered a 3.4% year-over-year ( YOY ) reduction May 2013 EAI was 126.7, a 3.4%
MEDICAID FEDERAL SHARE OF MATCHING FUNDS
 MEDICAID FEDERAL SHARE OF MATCHING FUNDS revised by EDR based on FFIS Estimated for FFY 2019 August 3, 2017 Effective State Budget Year State adopted February 2017 State State FY real Difference in state
Industry Trends Watch
 Costing Trends - Alberta Asphalt Cement (Edmonton Rack $C/t) The Edmonton rack price for asphalt cement averaged $730 per tonne in May, compared with $655 in April. In May of last year, the rack price
Executive Summary. July 17, 2015
 Executive Summary July 17, 2015 The Revenue Estimating Conference adopted interest rates for use in the state budgeting process. The adopted interest rates take into consideration current benchmark rates
North American Steel Industry Recent Market Developments, Future Prospects and Key Challenges
 North American Steel Industry Recent Market Developments, Future Prospects and Key Challenges OECD Steel Committee December 1-11, 29 Paris, France * American Iron and Steel Institute (AISI) Steel Manufacturers
Notes: 1. Prior corresponding period (pcp) 12 months to 31 March Statutory EBITDA represents Net Profit After Tax (NPAT) + tax expense +
 12 months to 31 March Statutory EBITDA represents Net Profit After Tax (NPAT) + tax expense +") Notes: 1. Prior corresponding period (pcp) 12 months to 31 March 2013 2. Statutory EBITDA represents Net Profit After Tax (NPAT) + tax expense + finance costs + depreciation, amortisation and impairment
Notes: 1. Prior corresponding period (pcp) 12 months to 31 March 2013 2. Statutory EBITDA represents Net Profit After Tax (NPAT) + tax expense + finance costs + depreciation, amortisation and impairment
Monthly Mutual Fund Report
 July, Monthly Mutual Fund Report Statistics for May-June Sales and Redemptions Total assets for all funds increased in May by $9. billion, or., to $.7 trillion. Money market funds had a net cash outflow
Fishpool Christmas Seminar 2017 Bearish signals going into 2018
 Photo: SB1 Markets SEAFOOD SALMON FARMING Fishpool Christmas Seminar 2017 Bearish signals going into 2018 Tore A. Tønseth Phone : (+47) 24 14 74 18 Mobile : (+47) 95 80 62 77 E-mail : tore.tonseth@sb1markets.no
OTHER DEPOSITS FINANCIAL INSTITUTIONS DEPOSIT BARKAT SAVING ACCOUNT
 WEIGHTAGES JAN FEB MAR APR MAY JUN JUL AUG SEPT OCT NOV DEC ANNOUNCEMENT DATE 19.Dez.14 27.Jän.15 24.Feb.15 26.Mär.15 27.Apr.15 26.Mai.15 25.Jun.15 28.Jul.15 26.Aug.15 23.Sep.15 27.Okt.15 25.Nov.15 MUDARIB
The Benefits for Canada from Pork Exports
 The Benefits for Canada from Pork Exports October 16, 2006 By Kevin Grier George Morris Centre Purpose and Objectives The purpose of this project is to illustrate and describe the benefits to Canada from
Urea makes new push higher Supply problems crop up just as demand for fertilizer rises By Bryce Knorr, grain market analyst
 Urea makes new push higher Supply problems crop up just as demand for fertilizer rises By Bryce Knorr, grain market analyst What passes for calm in the fertilizer market never seems to last long. Just
ncia THE WEEK'S HIGHLIGHTS:
 December 17, 1992 U.S. Fk>EC vo Bank [ 982Data 2 1 ncia THE WEEK'S HIGHLIGHTS: Privately owned housing starts rose from a seasonally adjusted annual rate of1,224,000 units in October to 1,242,000 units
Aug-12. Oct-13. Dec-14. Feb-16
 Feb-2 Apr-3 Jun-4 Aug-5 Oct-6 Feb-9 Apr-1 Jun-11 Aug-12 Feb-16 Dec-1 Dec-2 Dec-3 Dec-4 Dec-5 Dec-6 Richard Farr Jim McGovern U.S. Trading European Trading Chief Market Strategist Market Strategist Tourmaline
Decline in Economic Activity Larger Than Advance GDP Estimate February 27, 2009
 Northern Trust Global Economic Research 5 South LaSalle Chicago, Illinois 663 northerntrust.com Asha G. Bangalore agb3@ntrs.com Decline in Economic Activity Larger Than Advance GDP Estimate February 27,
MARKET ANALYSIS REPORT NO 1 OF 2015: ONION
 MARKET ANALYSIS REPORT NO 1 OF 215: ONION 1. INTRODUCTION The purpose of this text is to analyze the onion marketing environment. This analysis will be updated on a quarterly basis. The interval covered
Using projections to manage your programs
 Using projections to manage your programs To project total provider reimbursements To do what ifs based on caseloads or other metrics To project amounts of admin & support available for spending Based
EMPLOYER S MUNICIPAL INCOME TAX WITHHOLDING FORMS
 CITY TAX DEPT 50 TOWN SQUARE P.O. BOX 155 LIMA, OHIO 45802 PHONE (419) 221-5245 FAX (419) 998-5527 FORM LW-1 (MONTHLY OR QUARTERLY STATEMENT) FORM LW-3 (ANNUAL RECONCILIATION) EMPLOYER S MUNICIPAL INCOME
HIPIOWA - IOWA COMPREHENSIVE HEALTH ASSOCIATION Unaudited Balance Sheet As of July 31
 Unaudited Balance Sheet As of July 31 Total Enrollment: 407 Assets: Cash $ 9,541,661 $ 1,237,950 Invested Cash 781,689 8,630,624 Premiums Receivable 16,445 299,134 Prepaid 32,930 34,403 Assessments Receivable
PHOENIX ENERGY MARKETING CONSULTANTS INC. HISTORICAL NATURAL GAS & CRUDE OIL PRICES UPDATED TO July, 2018
 Jan-01 $12.9112 $10.4754 $9.7870 $1.5032 $29.2595 $275.39 $43.78 $159.32 $25.33 Feb-01 $10.4670 $7.8378 $6.9397 $1.5218 $29.6447 $279.78 $44.48 $165.68 $26.34 Mar-01 $7.6303 $7.3271 $5.0903 $1.5585 $27.2714
FDD FIRM STORAGE SERVICE NORTHERN NATURAL GAS COMPANY
 FDD FIRM STORAGE SERVICE NORTHERN NATURAL GAS COMPANY FIRM STORAGE SERVICE OPTIONS Northern s firm storage service is provided pursuant to the FDD Rate Schedule located in Northern s FERC Gas Tariff. The
Weekly Salmon Outlook Week
 Week 10-20 Page 1 of 8 Harvest of Atlantic salmon in Norway continued to grow in week 9. The harvest volume (23 000 tonnes wfe) was up 1000 tonnes from the previous week and 3% higher than in the corresponding
HUD NSP-1 Reporting Apr 2010 Grantee Report - New Mexico State Program
 HUD NSP-1 Reporting Apr 2010 Grantee Report - State Program State Program NSP-1 Grant Amount is $19,600,000 $9,355,381 (47.7%) has been committed $4,010,874 (20.5%) has been expended Grant Number HUD Region
BUSINESS YEAR 2009 RESULTS
 BUSINESS YEAR 2009 RESULTS Madrid, 26 February 2010 WORLD PRODUCTION OF STAINLESS STEEL Thousand Mt. 30,000 28,000 26,000 24,000 22,000 20,000 18,000 16,000 14,000 12,000 10,000 8,000 6,000 4,000 2,000