Recep Tekeli Adnan Menderes University, Turkey Policy Research Institute, MOF, Japan
|
|
|
- Martin Flowers
- 5 years ago
- Views:
Transcription


1 Recep Tekeli Adnan Menderes University, Turkey Policy Research Institute, MOF, Japan
2 Research Questions Find out which factors determine Tax Morale in two OECD Countries? Are there any differences/similarities in determination of tax morale between Turkey and Japan? 2
3 outline Explain the term tax morale and why it is important Show the magnitude of tax morale What determines tax morale? Empirical results on tax morale determination will be presented 3
4 Statement of the Problem Why do people pay taxes? 4
5 What would lead citizens to behave more honestly, provide correct information and improve the tax compliance rate? tax morale? the existence of an intrinsic motivation to pay taxes a moral obligation to pay taxes, a belief in contributing to society by paying taxes. Tax morale, unlike tax evasion, measures not individual behavior but individual attitude. 5
6 Why Tax Morale is Important? German scholars in the 1960s (e.g. Schmölders, 1970 and Strümpel, 1969) tried to bridge economics and social psychology by emphasizing that economic phenomena should be analyzed from a perspective larger than the traditional neoclassical point of view (e.g., Lewis, 1979, 1982) (see Torgler and Schneider 2007b:444). In this respect, Torgler and Schneider (2007a:10-11) argue that values and attitudes can affect individual behavior. Apart from sanctions, Spicer and Lundstedt (1976) argued that a set of attitudes and norms might have affect on the choice between tax compliance and evasion. 6
7 Tax noncompliance is actually inevitable fact in all societies Schneider (2005:600) defines the shadow economy as: The shadow economy includes all market-based legal production of goods and services that are deliberately concealed from public authorities : to avoid payment of taxes and social security contributions, to avoid having to meet certain legal labor market standards, such as minimum wages, and to avoid complying with certain administrative procedures. 7
8 Estimates of the size of the shadow economies Schnieder (2005) and Schneider et al (2010) have provided estimates of the size of the shadow economies for developing, transition and highly developed OECD countries over the periods of time 8
9 Estimates of the size of the shadow economies in EU Table 1: The size of shadow economy in 26 EU countries and Turkey Size of the shadow economy (as % of GDP) EU Countries 1989/ / / Austria Belgium Bulgaria Czech Republic Denmark Estonia N.A N.A N.A 42.3 Finland France Germany Great Britain Greece Hungary Ireland Italy Latvia Lithuania Luxembourg N.A N.A N.A 10.2 Malta N.A N.A N.A 27.7 Netherlands Poland Portugal Romania Slovakia Slovenia Spain Sweden Turkey Average
10 The shadow economy has reached a remarkably large size and increasing over the years Size of the shadow economy (as % of GDP) 1989/ / / Turkey Average EU Countries


11 11

12 Shadow Economy in Turkey and Japan 12
13 How Shadow Economy and Tax Morale Relates? A reduction of tax morale reduces the moral costs of behaving illegally and increases the incentives to work in the underground economy (see Torgler and Shneider2007). Core hypothesis: A higher degree of tax morale, defined as the intrinsic motivation to pay taxes, reduces the size of the shadow economy in a country, ceteris paribus. 13
14 previous studies: higher tax morale leads to a smaller shadow economy Alm and Torgler (2006) focus on Europe and the United States. They find a strong negative correlation (r=-0.460). Torgler (2005) in Latin America, finds a strong negative correlation (r=-0.511). Torgler and Schneider (2009) finds a significant correlation based on data from more than 50 countries Alm, Martinez-Vazquez, and Schneider (2004) focusing on transition countries finds a strong negative correlation (-0.657) 14
15 Tax Morale to analyse what may shape tax morale among taxpayers. We define tax morale as the intrinsic motivation to pay taxes : it is not an output variable such as tax evasion or the size of shadow economy. It measures an individual s willingness to pay taxes, the moral obligation to pay taxes or the belief that paying taxes contributes to society. Data are extracted from the World Values Survey (WVS) (see Inglehart et al., 2000) / / / individuals in Turkey and 1096 individuals in Japan
16 Magnitude of Tax Morale (TM) Please tell me for each of the following statements whether you think it can always be justified, never be justified, or something in between : V200. Cheating on tax if you have the chance never justified always justified Re-coding (0, 1, 2, 3) 16
17 cautions the measurement of tax morale is not free of bias However, the degree of honesty is expected to be higher because in the WWS the tax morale is defined less sensitive than directly asking whether a person has evaded taxes. Moreover, the dataset is based on wide-ranging surveys (based on more than two hundred questions) it was assumed to reduce the probability of respondent suspicion. (see Torgler 2004, Torgler and Schneider 2007a; Torgler and Schneider 2007b; Torgler and Shaltegger 2006; Torgler et al 2010). 17

18 TM Magnitude in the EU 18

19 TM Magnitude in the APEC 19

20 TM Magnitude in OECD 20
21 What do the graphs say? In sum, the results for tax morale show that Japan and Turkey rank in the highest as compared to other countries within their regions. Thus, this gives a task to explain why tax morale is very high in these two countries; what determines tax morale and are there any similarities between these two countries in the determination of tax morale level. 21
22 Determinants of Tax Morale (Model and Variables) TM i 1 TRUST i 2 PRIDE i 3 POL i 3 HAPPY i k k 1 X i The Ordered Probit models help to analyze the ranking information of the scaled dependent variable (tax morale). The equation has a non-linear form; only the sign of the coefficient can be directly interpreted, not its size. Therefore, calculating the marginal effects is a method to find the quantitative effect a variable has on tax morale. The marginal effect indicates the change in the share of (or the probability of) taxpayers belonging to a specific tax morale level (i.e. 0,1,2,3) when the independent variable increases by one unit. 22
23 Dependent Variable TM From the fifth wave of World Values Survey Many studies used WVS Torgler and with his collegeues 23
24 Magnitude of Tax Morale in Turkey and Japan 24 Country Justifiable: cheating on taxes Japan (2005) Turkey (2007) Never justifiable 82.90% 80.50% % 12.50% % 4.00% % 1.10% % 1.10% % 0.20% % 0.20% % 0.10% % 0.10% Always justifiable 0.90% 0.30% Total (100%) (100%) Mean Standard Deviation
25 Independent Variables Main variables: Trust, Pride, Political attitudes, Happiness, 25
26 CONTROL VARIABLES Age, Gender, Education and awareness, Marital status, Economic status Occupation status 26 Religiosity
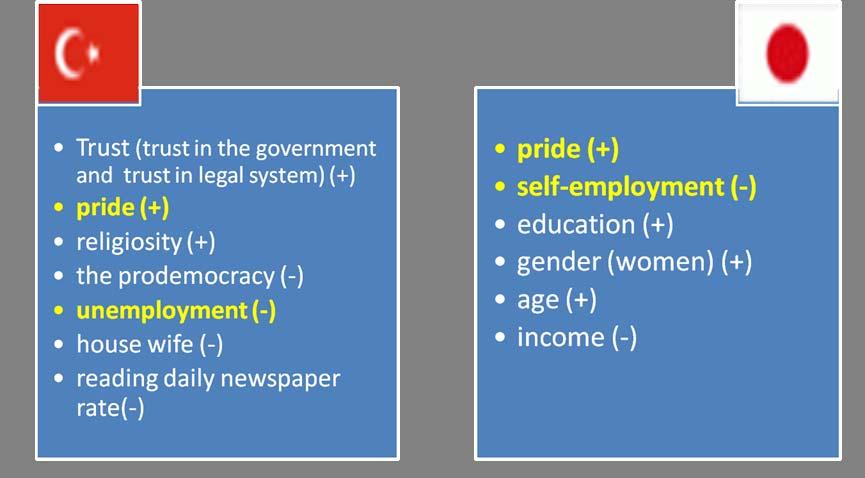
27 Variables used in the literature Dependent Variable Table 7: Literature: Determinants of Tax Morale (excerpted from Torgler and Shaltegger 2006:415) Tax Morale Regions Europe a North and Latin America b Independent Variables Age Gender (female) Education (-/+) (+) + Married + + (+) Self-employed - (+) - Income Financial Satisfaction Church Att endance + + +(Asia) Religious + + (-/+ ) Trust in Government Trust in Legal System + + Trust in court/legal + system Trust in the president + Trust public officials + + Pride + + Direct democracy +(Switzerland) +USA Pro-democratic attitudes Local autonomy + 27 Transition, Asian Countries and Australia c
28 TRUST: trust in the government, trust in the legal system and trust in the parliament Could you tell me how much confidence you have in the government in your capital/ have in the legal system / have in the Parliament : is it a great deal of confidence, quite a lot of confidence, not very much confidence or none at all? a great deal none at all Hypothesis 1. The more extensive the citizens trust in the government, in the parliament and the legal system (justice or the court), the higher the tax morale. 28
29 TRUST Table 9: Trust Justice System Confidence in Country Justice System Japan Turkey A great deal 17.20% 36.80% Quite a lot 64.80% 38.90% Not very much 15.50% 16.30% None at all 2.50% 8.00% Total 1031 (100%) 1313 (100%) 29
30 TRUST Table 10: Trust Parliament Confidence in Country Parliament Japan Turkey A great deal 1.20% 22.70% Quite a lot 22.00% 38.80% Not very much 55.40% 24.00% None at all 21.30% 14.60% Total 1012 (100%) 1277 (100%) 30
31 TRUST Table 11: Trust The Government Confidence in Country The Government Japan Turkey A great deal 1.60% 27.60% Quite a lot 29.50% 36.00% Not very much 50.20% 21.80% None at all 18.80% 14.50% Total 1028 (100%) 1304 (100%) 31
32 PRIDE How proud are you to be...? (specific nationality, e.g., Turkish, Japanese, Korean, Dutch etc. ) very proud Quite proud Not very proud not at all proud Hypothesis 2. The greater the citizens national pride, the higher the tax morale 32
33 PRIDE Table 12: Pride. How proud of Country nationality Japan Turkey Very proud 22.20% 81.30% Quite proud 38.80% 15.10% Not very proud 35.10% 2.90% Not at all proud 3.80% 0.60% Total (100%) (100%) 33
34 POLITICAL ATTITUDES ideology and pro democratic attitude How would you place yourself in a political scale? extreme left extreme right Would you say that our country is governed by a democratic political system? not democratically governed country is completely governed by a democracy Hypothesis 3. A stronger pro democratic attitude leads to a higher tax morale 34
35 Table 13: Ideology 35 Self positioning in Country political scale Japan Turkey Left 2.40% 7.90% % 3.90% % 7.00% % 6.00% % 12.90% % 18.80% % 7.70% % 13.50% % 6.60% Right 2.00% 15.70% Total 863 (100%) 1143 (100%) Mean
36 Table 14: Democraticness 36 Democraticness in own Country country Japan Turkey Not at all democratic 0.80% 6.90% % 4.20% % 7.10% % 8.30% % 11.20% % 16.50% % 15.50% % 13.80% % 7.70% Completely democratic 3.10% 8.80% Total 998 (100%) 1277 (100%) Mean 6.9 6
37 HAPPINESS Taking all things together, would you say you are: very happy quite happy not very happy not at all happy Hypothesis 4. Tax morale increases with individual s well being 37
38 Table 15: Happiness Feeling of Country happiness Japan Turkey Very happy 29.20% 37.40% Quite happy 60.50% 48.90% Not very happy 9.20% 9.40% Not at all happy 1.10% 4.30% Total 1066 (100%) 1345 (100%) 38
39 CONTROL VARIABLES Age, Gender, Education and awareness, Marital status, Economic status Occupation status 39 Religiosity
40 1. Age Do older people have higher tax morale than younger? 40
41 Table 16: Age Age Group Country Japan Turkey % 20.70% % 31.60% % 21.80% % 14.20% % 6.20% % 5.50% Total 1096 (100%) 1346 (100%) Mean
42 2. Gender Categorical variable [1= male (in the reference group), female=2] Do gender differences affect the level of tax morale? 42
43 Table 17: Gender Sex Country Japan Turkey Male 44.10% 50.20% Female 55.90% 49.80% Total 1096 (100%) 1346 (100%) 43
44 3. Marital status Categorical variable: married (in the reference group), single, living together, divorced, separated, widowed] Do married people have different levels of tax morale than others? 44
45 Marital status Table 18: Marital status. Country Marital status Japan Turkey Married 72.80% 66.40% Living together as married 1.70% 0.10% Divorced 3.00% 1.40% Separated 0.60% 0.20% Widowed 4.70% 2.30% Single/Never married 17.20% 29.60% Total 1090 (100%) 1346 (100%) 45
46 4. Education [continuous variable for higher educational level attained: 1= low (never gone to the school), 10 = higher education)] Do more educated people have higher tax morale level than less educated people? Awareness Did you read daily newspaper last week to obtain news/information? (categorical variable: 1=yes, 2=no) 46
47 Table 19: Educational level Country Highest educational level attained Japan Turkey No formal education % Inadequately completed elementary education % Completed (compulsory) elementary education 8.20% 36.60% Incomplete secondary school: technical/vocational type/(compulsory) elementary education and basic vocational qualification Complete secondary school: technical/vocational type/secondary, intermediate vocational qualification Incomplete secondary: university-preparatory type/secondary, intermediate general qualification 1.30% 2.60% 11.50% 6.90% 4.00% 3.30% Complete secondary: university-preparatory type/full secondary, maturity level certificate Some university without degree/higher education - lower-level tertiary certificate University with degree/higher education - upper-level tertiary certificate Total % 26.70% 1.90% 1.00% 25.10% 10.80% 1072 (100%) 1346 (100%)
48 Torgler and Shaltegger (2006:409) suggested that future studies should take a look at informal education such as time spent for reading a newspaper to investigate whether awareness affects tax morale or not. Table 20: Awareness. Country Information source: Daily newspaper Japan Turkey Used last week 90.10% 58.60% Not used last week 9.90% 41.40% Total 1080 (100%) 1343 (100%) 48
49 5. Economic class we used scale of incomes: [1=low income, 10=high income]. Do the levels of tax morale vary with the level of tax payers income? 49
50 50 Table 21: Incomes Country Scale of incomes Japan Turkey Lower step 14.80% 22.90% second step 13.80% 26.60% Third step 13.50% 14.10% Fourth step 11.40% 14.80% Fifth step 9.10% 3.20% Sixth step 9.20% 7.50% Seventh step 7.80% 1.30% Eigth step 5.80% 5.80% Nineth step 7.30% 1.90% Tenth step 7.30% 1.90% Total 1000 (100%) 1321 (100%) Mean
51 6. Occupation status [full time employed (in the reference group), part time employed, self employed, unemployed, at home, student, retired, other] Does the occupation status of individual influence tax morale? 51
52 Table 22: Employment status. Country Employment status. Japan Turkey Full time 38.40% 22.20% Part time 15.50% 2.70% Self employed 11.60% 14.50% Retired 9.90% 9.10% Housewife 17.90% 34.60% Students 2.80% 8.40% Unemployed 1.60% 6.10% Other 2.40% 2.40% Total 1055 (100%) 1346 (100%) 52
53 7. Religiosity Does the religion make any differences to the levels of tax morale? Apart from funerals, (for non-muslims weddings, and christenings), about how often do you attend religious services these days? more than once a week once a week Once a month only on special holy days once a year less often never or practically never 53
54 Table 23: Religious services attendance. How often do you Country attend religious services. Japan Turkey More than once a week 1.70% 14.00% Once a week 1.60% 20.20% Once a month 6.50% 1.80% Only on special holy days/christmas/easter days 42.10% 23.80% Once a year 22.30% 3.30% Less often 15.00% 4.00% Never practically never 10.80% 32.90% Total 1090 (100%) 1320 (100%) 54
55 Table 24: Religiosity Country Religious Person Japan Turkey A religious person 24.20% 82.60% Not a religious person 62.10% 16.90% A convinced atheist 13.70% 0.50% Total (100%) (100%) 55

56 3. Empirical results on tax morale in Turkey SPECIAL THANKS TO ASSOC PROF DR MUHITTIN KAPLAN UNIVERSITY OF MELIHSAH KAYSERI 56
57 Note that trust, religious service attendance and pride are recoded For example: How proud are you to be...? (specific nationality, e.g., Turkish, Japanese, Korean, Dutch etc. ) very proud quite proud not very proud not at all proud Recoded as: not at all proud not very proud quite proud very proud 57


58 Table 40: Determinants of Tax Morale in Turkey (2007) 58
")

59 Table 40 (continued) Determinants of Tax Morale in Turkey (2007) 59
")

60 Table 40 (continued) Determinants of Tax Morale in Turkey (2007) 60
61 Results from tables Statistically Significant variables: Trust (trust in the government and trust in legal system) (+) pride (+) religiosity (+) the prodemocracy ( ) unemployment ( ) house wife ( ) reading daily newspaper rate( ) Income, education, gender (woman), marital status, happiness and ideology did not have any effect on tax morale 61
62 Results from tables An increase in the trust in government (trust in legal system) by one unit increases the share of subjects indicating the highest tax morale by 2.5 to 4.7 (2.6 to 3.6) percentage points An increase in pride by one point raises the share of persons indicating the highest tax morale value by more than 3 to 4 percentage points A one point increase in the prodemocracy index reduces the share of persons with the highest tax morale by 2 percentage points The proportion of unemployed who report the highest tax morale is approximately 10 percentage points lower than the one of full time employees. The proportion of house wife who report the highest tax morale is approximately 8percentage points lower than the one of full time employees. An increase in religious attendance increases the tax morale between 8 and 10 percentage points. If the reading daily newspaper rate increases, tax morale decreases by 8 to 10 percentage points. 62
63 3. Empirical results on tax morale in Japan 63


64 Table 41: Determinants of tax morale in Japan (2005) 64


65 Table 41: Determinants of tax morale in Japan (2005) 65
:")

66 Table 41(continued): Determinants of tax morale in Japan (2005) 66
67 Results from tables The trust in government and trust in legal system, the prodemocracy, religiosity, marital status and ideology did not have any effects on tax morale in Japan the significant variables: gender (women) (+) education (+) age (+) pride (+) self employment ( ) income ( ) 67
68 Results from tables An increase in Pride by one point raises the share of persons indicating the highest tax morale value almost 3 percentage points (only in one estimation) Our results indicate that the proportion of self employed who report the highest tax morale is approximately 18 percentage points lower than the one of full time employees. Japanese women seem to have stronger tax morale than men in Japan The result indicates that an increase in income scale by one point reduces the share of persons indicating the highest tax morale value by less than 1 percentage point. Results show that education has significant effects. We found that if the individual s education level increases tax morale increases by 1.5 to 2 percentage points. The proportion of people aged over 50 who report the highest tax morale is approximately 19 percentage points higher than the year old reference group (lower age category). The proportion of people of the age who report the highest level of tax morale is around 10 percentage points higher than the year old reference group. 68

69 Similarities/differences in determination 69
70 3. Empirical results on tax morale in Japan & Turkey TM i k TRUSTi PRIDE POLi HAPPYi X 1 2 i 3 3 k 1 4 JAPAN i 70


71 Table 42: Determinants of tax morale in Turkey& Japan 71
:")

72 Table 42 (continued): Determinants of tax morale in Turkey& Japan 72
:")

73 Table 42 (continued): Determinants of tax morale in Turkey& Japan 73
74 Results from combined estimations Happiness, ideology, income, education, gender (woman), marital status and did not have any effect on tax morale The significant variables the trust in government and trust in legal system (+) pride (+) religiosity (+) age (+) the prodemocracy ( ) Country dummy (JAPAN) (+) self employment ( ) unemployment ( ) the reading daily newspaper rate ( ) 74
75 Results from combined estimations An increase in the trust in government (trust in legal system) by one unit increases the share of subjects indicating the highest tax morale by 3 (2.6) percentage points An increase in Pride by one point raises the share of persons indicating the highest tax morale value by more than 2.6 to 3.4 percentage points A one point increase in the prodemocracy index reduces the share of persons with the highest tax morale by 1 percentage point. Our results indicate that the proportion of self employed who report the highest tax morale is approximately 8 percentage points lower than the one of full time employees. The result indicates that an increase in self employee by one point reduces the share of persons indicating the highest tax morale value by 8 percentage points. 75
76 The proportion of unemployed who report the highest tax morale is approximately 8 percentage points lower than the one of full time employees. An increase in unemployment by one point reduces the share of persons indicating the highest tax morale value by almost 8 percentage points An increase in religiosity raises the tax morale between 3.8 and 4.5 percentage points. If the reading daily newspaper rate increases, tax morale also decreases by 4 to 5 percentage points. Older individuals tend to exhibit higher tax morale as the coefficients on age are statistically significant in all estimations. A one point increase in the age increases the share of persons with the highest tax morale approximately 1 percentage point, meaning that getting old leads to higher tax morale. 76
77 The coefficient on the country dummy (JAPAN) is statistically significant in models (#4 to 8). We observe that individuals in Japan have higher tax morale than those in Turkey. The marginal effects indicate that being a resident/or a citizen of Japan rather than of Turkey increases the probability of reporting the highest tax morale by around 4.3 to 6.1 percentage points, and this result is robust across various specifications. 77
78 final points Not only trust in the government might have an effect on tax morale, but also trust in the court, or the legal system. An increase in the level of democracy decreases the tax morale level. Tax morale of unemployed and selfemployed is lower. While unawareness has significant effects on tax morale level, education does not affect tax morale. Pride has positive effect on tax morale level especially in Turkey. The results on religion: It seems that tax cheating is immoral for a Muslim. There is a cultural differences in tax morale level: Being from Japan rather than from Turkey increases the probability of stating that tax cheating is never justified by between 4.3 percentage and 6.1 points. 78
79 Thanks for listening 79
The Determinants of Tax Morale: the Effects of Cultural Differences and Politics
 1 Determinants of Tax Morale in Japan and in Turkey The Determinants of Tax Morale: the Effects of Cultural Differences and Politics Recep Tekeli 1 Abstract: In this paper we analyze the tax morale in
Live Long and Prosper? Demographic Change and Europe s Pensions Crisis. Dr. Jochen Pimpertz Brussels, 10 November 2015
 Live Long and Prosper? Demographic Change and Europe s Pensions Crisis Dr. Jochen Pimpertz Brussels, 10 November 2015 Old-age-dependency ratio, EU28 45,9 49,4 50,2 39,0 27,5 31,8 2013 2020 2030 2040 2050
EMPLOYMENT RATE Employed/Working age population (15-64 years)
") 1 EMPLOYMENT RATE 1980-2003 Employed/Working age population (15-64 years 80 % Finland (Com 75 70 65 60 EU-15 Finland (Stat. Fin. 55 50 80 82 84 86 88 90 92 94 96 98 00 02 9.9.2002/SAK /TL Source: European
1 EMPLOYMENT RATE 1980-2003 Employed/Working age population (15-64 years 80 % Finland (Com 75 70 65 60 EU-15 Finland (Stat. Fin. 55 50 80 82 84 86 88 90 92 94 96 98 00 02 9.9.2002/SAK /TL Source: European
EMPLOYMENT RATE IN EU-COUNTRIES 2000 Employed/Working age population (15-64 years)
") EMPLOYMENT RATE IN EU-COUNTRIES 2 Employed/Working age population (15-64 years EU-15 Denmark Netherlands Great Britain Sweden Portugal Finland Austria Germany Ireland Luxembourg France Belgium Greece Spain
EMPLOYMENT RATE IN EU-COUNTRIES 2 Employed/Working age population (15-64 years EU-15 Denmark Netherlands Great Britain Sweden Portugal Finland Austria Germany Ireland Luxembourg France Belgium Greece Spain
Special Eurobarometer 465. Gender Equality 2017
 Summary Gender Equality 01 Gender Pay Gap Survey requested by the European Commission, Directorate-General for Justice and Consumers and co-ordinated by the Directorate-General for Communication This document
Burden of Taxation: International Comparisons
 Burden of Taxation: International Comparisons Standard Note: SN/EP/3235 Last updated: 15 October 2008 Author: Bryn Morgan Economic Policy & Statistics Section This note presents data comparing the national
Approach to Employment Injury (EI) compensation benefits in the EU and OECD
 compensation benefits in the EU and OECD") Approach to (EI) compensation benefits in the EU and OECD The benefits of protection can be divided in three main groups. The cash benefits include disability pensions, survivor's pensions and other short-
Approach to (EI) compensation benefits in the EU and OECD The benefits of protection can be divided in three main groups. The cash benefits include disability pensions, survivor's pensions and other short-
EMPLOYMENT RATE Employed/Working age population (15 64 years)
") EMPLOYMENT RATE 198 26 Employed/Working age population (15 64 years 8 % Finland 75 EU 15 EU 25 7 65 6 55 5 8 82 84 86 88 9 92 94 96 98 2 4** 6** 14.4.25/SAK /TL Source: European Commission 1 UNEMPLOYMENT
EMPLOYMENT RATE 198 26 Employed/Working age population (15 64 years 8 % Finland 75 EU 15 EU 25 7 65 6 55 5 8 82 84 86 88 9 92 94 96 98 2 4** 6** 14.4.25/SAK /TL Source: European Commission 1 UNEMPLOYMENT
EU BUDGET AND NATIONAL BUDGETS
 DIRECTORATE GENERAL FOR INTERNAL POLICIES POLICY DEPARTMENT ON BUDGETARY AFFAIRS EU BUDGET AND NATIONAL BUDGETS 1999-2009 October 2010 INDEX Foreward 3 Table 1. EU and National budgets 1999-2009; EU-27
Trust and Fertility Dynamics. Arnstein Aassve, Università Bocconi Francesco C. Billari, University of Oxford Léa Pessin, Universitat Pompeu Fabra
 Trust and Fertility Dynamics Arnstein Aassve, Università Bocconi Francesco C. Billari, University of Oxford Léa Pessin, Universitat Pompeu Fabra 1 Background Fertility rates across OECD countries differ
Youth Integration into the labour market Barcelona, July 2011 Jan Hendeliowitz Director, Employment Region Copenhagen & Zealand Ministry of
 Youth Integration into the labour market Barcelona, July 2011 Jan Hendeliowitz Director, Employment Region Copenhagen & Zealand Ministry of Employment, Denmark Chair of the OECD-LEED Directing Committee
Pan-European opinion poll on occupational safety and health
 REPORT Pan-European opinion poll on occupational safety and health Results across 36 European countries Final report Conducted by Ipsos MORI Social Research Institute at the request of the European Agency
Turkish Economic Review Volume 3 March 2016 Issue 1
 www.kspjournals.org Volume 3 March 2016 Issue 1 Tax Losses due to Shadow Economy Activities in OECD Countries from 2011 to 2013: A preliminary calculation By Friedrich SCHNEIDER a Abstract. In this short
WHAT ARE THE FINANCIAL INCENTIVES TO INVEST IN EDUCATION?
 INDICATOR WHAT ARE THE FINANCIAL INCENTIVES TO INVEST IN EDUCATION? Not only does education pay off for individuals ly, but the public sector also from having a large proportion of tertiary-educated individuals
Tax morale in Australia: What shapes it and has it changed over time?
 Tax morale in Australia: What shapes it and has it changed over time? Benno Torgler and Kristina Murphy WORKING PAPER 58 JANUARY 2005 TAX MORALE IN AUSTRALIA: WHAT SHAPES IT AND HAS IT CHANGED OVER TIME?
Special Eurobarometer 418 SOCIAL CLIMATE REPORT
 Special Eurobarometer 418 SOCIAL CLIMATE REPORT Fieldwork: June 2014 Publication: November 2014 This survey has been requested by the European Commission, Directorate-General for Employment, Social Affairs
EU-28 RECOVERED PAPER STATISTICS. Mr. Giampiero MAGNAGHI On behalf of EuRIC
 EU-28 RECOVERED PAPER STATISTICS Mr. Giampiero MAGNAGHI On behalf of EuRIC CONTENTS EU-28 Paper and Board: Consumption and Production EU-28 Recovered Paper: Effective Consumption and Collection EU-28 -
Macroeconomic scenarios for skill demand and supply projections, including dealing with the recession
 Alphametrics (AM) Alphametrics Ltd Macroeconomic scenarios for skill demand and supply projections, including dealing with the recession Paper presented at Skillsnet technical workshop on: Forecasting
Analysis of European Union Economy in Terms of GDP Components
 Expert Journal of Economic s (2 0 1 3 ) 1, 13-18 2013 Th e Au thor. Publish ed by Sp rint In v estify. Econ omics.exp ertjou rn a ls.com Analysis of European Union Economy in Terms of GDP Components Simona
For further information, please see online or contact
 For further information, please see http://ec.europa.eu/research/sme-techweb online or contact Lieve.VanWoensel@ec.europa.eu Sixth Progress Report on participation in the 7 th R&D Framework Programme Statistical
DG TAXUD. STAT/11/100 1 July 2011
 DG TAXUD STAT/11/100 1 July 2011 Taxation trends in the European Union Recession drove EU27 overall tax revenue down to 38.4% of GDP in 2009 Half of the Member States hiked the standard rate of VAT since
Linking Education for Eurostat- OECD Countries to Other ICP Regions
 International Comparison Program [05.01] Linking Education for Eurostat- OECD Countries to Other ICP Regions Francette Koechlin and Paulus Konijn 8 th Technical Advisory Group Meeting May 20-21, 2013 Washington
Global Report on Tax Morale. Preliminary findings. Christian Daude Head of Americas Desk OECD Development Centre
 Global Report on Tax Morale Preliminary findings Christian Daude Head of Americas Desk OECD Development Centre Task Force on Tax and Development Subgroup State Building, Taxation and Aid Paris, 8 February
REPORT FROM THE COMMISSION TO THE EUROPEAN PARLIAMENT, THE COUNCIL, THE EUROPEAN ECONOMIC AND SOCIAL COMMITTEE AND THE COMMITTEE OF THE REGIONS
 EUROPEAN COMMISSION Brussels,.4.29 COM(28) 86 final/ 2 ANNEXES to 3 ANNEX to the REPORT FROM THE COMMISSION TO THE EUROPEAN PARLIAMENT, THE COUNCIL, THE EUROPEAN ECONOMIC AND SOCIAL COMMITTEE AND THE COMMITTEE
Introduction 283,602,000,000 ( 284 billion ) 71 billion 10.71%
 71 billion 10.71%") Introduction Over the last 4 years (between 2012 to 2015 inclusive) the UK has imported 283,602,000,000 ( 284 billion ) more from the rest of the EU than the UK and NI have exported to the EU resulting
Introduction Over the last 4 years (between 2012 to 2015 inclusive) the UK has imported 283,602,000,000 ( 284 billion ) more from the rest of the EU than the UK and NI have exported to the EU resulting
Fiscal rules in Lithuania
 Fiscal rules in Lithuania Algimantas Rimkūnas Vice Minister, Ministry of Finance of Lithuania 3 June, 2016 Evolution of National and EU Fiscal Regulations Stability and Growth Pact (SGP) Maastricht Treaty
EUROPA - Press Releases - Taxation trends in the European Union EU27 tax...of GDP in 2008 Steady decline in top corporate income tax rate since 2000
 DG TAXUD STAT/10/95 28 June 2010 Taxation trends in the European Union EU27 tax ratio fell to 39.3% of GDP in 2008 Steady decline in top corporate income tax rate since 2000 The overall tax-to-gdp ratio1
January 2010 Euro area unemployment rate at 9.9% EU27 at 9.5%
 STAT//29 1 March 20 January 20 Euro area unemployment rate at 9.9% EU27 at 9.5% The euro area 1 (EA16) seasonally-adjusted 2 unemployment rate 3 was 9.9% in January 20, the same as in December 2009 4.
The Architectural Profession in Europe 2012
 The Architectural Profession in Europe 2012 - A Sector Study Commissioned by the Architects Council of Europe Chapter 2: Architecture the Market December 2012 2 Architecture - the Market The Construction
Eurofound in-house paper: Part-time work in Europe Companies and workers perspective
 Eurofound in-house paper: Part-time work in Europe Companies and workers perspective Presented by: Eszter Sandor Research Officer, Surveys and Trends 26/03/2010 1 Objectives Examine the patterns of part-time
Social Situation Monitor - Glossary
 Social Situation Monitor - Glossary Active labour market policies Measures aimed at improving recipients prospects of finding gainful employment or increasing their earnings capacity or, in the case of
The Swedish approach to capital requirements in CRD IV
 The Swedish approach to capital requirements in CRD IV State Secretary Johanna Lybeck Lilja The aim of capital requirements Enhancing growth creating potential of a integrated, stable financial system
COVER NOTE The Employment Committee Permanent Representatives Committee (Part I) / Council EPSCO Employment Performance Monitor - Endorsement
 / Council EPSCO Employment Performance Monitor - Endorsement") COUNCIL OF THE EUROPEAN UNION Brussels, 15 June 2011 10666/1/11 REV 1 SOC 442 ECOFIN 288 EDUC 107 COVER NOTE from: to: Subject: The Employment Committee Permanent Representatives Committee (Part I) / Council
COUNCIL OF THE EUROPEAN UNION Brussels, 15 June 2011 10666/1/11 REV 1 SOC 442 ECOFIN 288 EDUC 107 COVER NOTE from: to: Subject: The Employment Committee Permanent Representatives Committee (Part I) / Council
October 2010 Euro area unemployment rate at 10.1% EU27 at 9.6%
 STAT//180 30 November 20 October 20 Euro area unemployment rate at.1% EU27 at 9.6% The euro area 1 (EA16) seasonally-adjusted 2 unemployment rate 3 was.1% in October 20, compared with.0% in September 4.
Consumer Credit. Introduction. June, the 6th (2013)
") Consumer Credit in Europe at end-2012 Introduction Crédit Agricole Consumer Finance has published its annual survey of the consumer credit market in 27 European Union countries (EU-27) for the sixth year
Consumer Credit in Europe at end-2012 Introduction Crédit Agricole Consumer Finance has published its annual survey of the consumer credit market in 27 European Union countries (EU-27) for the sixth year
PROGRESS TOWARDS THE LISBON OBJECTIVES 2010 IN EDUCATION AND TRAINING
 PROGRESS TOWARDS THE LISBON OBJECTIVES IN EDUCATION AND TRAINING In 7, reaching the benchmarks for continues to pose a serious challenge for education and training systems in Europe, except for the goal
11 th Economic Trends Survey of the Impact of Economic Downturn
 11 th Economic Trends Survey 11 th Economic Trends Survey of the Impact of Economic Downturn 11 th Economic Trends Survey COUNTRY ANSWERS Austria 155 Belgium 133 Bulgaria 192 Croatia 185 Cyprus 1 Czech
Claim form for Winter Fuel Payment for past winters 1998/99, 1999/00, 2000/01, 2001/02, 2002/03 and 2003/04
 Winter Fuel Payment If you get in touch with us, please tell us this reference number Our phone number is Code Number Ext If you have a textphone, you can call on Code Number Date Claim form for Winter
European Advertising Business Climate Index Q4 2016/Q #AdIndex2017
 European Advertising Business Climate Index Q4 216/Q1 217 ABOUT Quarterly survey of European advertising and market research companies Provides information about: managers assessment of their business
Is the Danish working time short?
 06 March 2018 2018:5 Is the Danish working time short? By Sofie Valentin Weiskopf, Michèle Naur, Michael Drescher and Mathilde Lund Holm From a European perspective, the Danish working time is often described
Updates and revisions of national SUTs for the November 2013 release of the WIOD
 Updates and revisions of national SUTs for the November 2013 release of the WIOD Edited by Marcel Timmer (University of Groningen) With contributions from: Abdul A. Erumban, Reitze Gouma and Gaaitzen J.
Rozvoj zam stnanosti v sociálních slu bách: klí ové faktory a perspektivy. Shaping employment in social services: key factors and future perspectives
 Rozvoj zam stnanosti v sociálních slu bách: klí ové faktory a perspektivy Shaping employment in social services: key factors and future perspectives T. Sirovátka and O. Hora Focus Development of health
education (captured by the school leaving age), household income (measured on a ten-point
, household income (measured on a ten-point") A Web-Appendix A.1 Information on data sources Individual level responses on benefit morale, tax morale, age, sex, marital status, children, education (captured by the school leaving age), household income
A Web-Appendix A.1 Information on data sources Individual level responses on benefit morale, tax morale, age, sex, marital status, children, education (captured by the school leaving age), household income
Raising the retirement age is the labour market ready for active ageing: evidence from EB and Eurofound research
 Raising the retirement age is the labour market ready for active ageing: evidence from EB and Eurofound research Robert Anderson, EUROFOUND, Dublin Reforming pension systems in Europe and Central Asia
Statistical annex. Sources and definitions
 Statistical annex Sources and definitions Most of the statistics shown in these tables can be found as well in several other (paper or electronic) publications or references, as follows: the annual edition
Flash Eurobarometer 408 EUROPEAN YOUTH REPORT
 Flash Eurobarometer EUROPEAN YOUTH REPORT Fieldwork: December 2014 Publication: April 2015 This survey has been requested by the European Commission, Directorate-General for Education and Culture and co-ordinated
Social Determinants of Health: employment and working conditions
 Social Determinants of Health: employment and working conditions Michael Marmot UCL Institute of Health Equity 3 rd Nordic Conference in Work Rehabilitation 7 th May 2014 Fairness at the heart of all policies.
Financial wealth of private households worldwide
 Economic Research Financial wealth of private households worldwide Munich, October 217 Recovery in turbulent times Assets and liabilities of private households worldwide in EUR trillion and annualrate
Widow s, Widower s or Surviving Civil Partner s Contributory Pension. Frequently Asked Questions
 Widow s, Widower s or Surviving Civil Partner s Contributory Pension Frequently Asked Questions 1. What is Widow s, Widower s or Surviving Civil Partner s Contributory Pension? Widow s, Widower s or Surviving
3 Labour Costs. Cost of Employing Labour Across Advanced EU Economies (EU15) Indicator 3.1a
 Indicator 3.1a") 3 Labour Costs Indicator 3.1a Indicator 3.1b Indicator 3.1c Indicator 3.2a Indicator 3.2b Indicator 3.3 Indicator 3.4 Cost of Employing Labour Across Advanced EU Economies (EU15) Cost of Employing Labour
3 Labour Costs Indicator 3.1a Indicator 3.1b Indicator 3.1c Indicator 3.2a Indicator 3.2b Indicator 3.3 Indicator 3.4 Cost of Employing Labour Across Advanced EU Economies (EU15) Cost of Employing Labour
PROGRESS TOWARDS THE LISBON OBJECTIVES 2010 IN EDUCATION AND TRAINING
 PROGRESS TOWARDS THE LISBON OBJECTIVES IN EDUCATION AND TRAINING In, reaching the benchmarks for continues to pose a serious challenge for education and training systems in Europe, except for the goal
Council conclusions on "First Annual Report to the European Council on EU Development Aid Targets"
 COUNCIL OF THE EUROPEAN UNION Council conclusions on "First Annual Report to the European Council on EU Development Aid Targets" 3091st FOREIGN AFFAIRS Council meeting Brussels, 23 May 2011 The Council
FCCC/SBI/2010/10/Add.1
 United Nations Framework Convention on Climate Change Distr.: General 25 August 2010 Original: English Subsidiary Body for Implementation Contents Report of the Subsidiary Body for Implementation on its
THE IMPACT OF THE PUBLIC DEBT STRUCTURE IN THE EUROPEAN UNION MEMBER COUNTRIES ON THE POSSIBILITY OF DEBT OVERHANG
 THE IMPACT OF THE PUBLIC DEBT STRUCTURE IN THE EUROPEAN UNION MEMBER COUNTRIES ON THE POSSIBILITY OF DEBT OVERHANG Robert Huterski, PhD Nicolaus Copernicus University in Toruń Faculty of Economic Sciences
TRENDS IN THE DEVELOPMENT OF INDIRECT TAXES IN THE MEMBER STATES OF THE EUROPEAN UNION
 Annals of the University of Petroşani, Economics, 15(1), 2015, 71-80 71 TRENDS IN THE DEVELOPMENT OF INDIRECT TAXES IN THE MEMBER STATES OF THE EUROPEAN UNION MARIA FELICIA CHIRCULESCU * ABSTRACT: In this
2017 Figures summary 1
 Annual Press Conference on January 18 th 2018 EIB Group Results 2017 2017 Figures summary 1 European Investment Bank (EIB) financing EUR 69.88 billion signed European Investment Fund (EIF) financing EUR
JOINT STATEMENT. The representatives of the governments of the Member States, meeting within the Council of
 JOINT STATEMENT The representatives of the governments of the Member States, meeting within the Council of the EU, and The Swiss Federal Council, Have drawn up the following Joint Statement on company
GOVERNMENT PAPER. There are some signs that these views are changing with new generations.
 Older people on the labour market in Iceland Public policy and measures within continuing education Gissur Pétursson Directorate of Labour 1. Conditions on the labour market Employment participation among
Threats in Latin American and Caribbean countries: How do inequality and the asymmetries of rules affect tax morale?
 Working Paper Series Threats in Latin American and Caribbean countries: How do inequality and the asymmetries of rules affect tax morale? Mariana Gerstenblüth Natalia Melgar Juan Pablo Pagano Máximo Rossi
Socioeconomic inequalities in mortality and longevity
 Socioeconomic inequalities in mortality and longevity Peter Goldblatt Taking action on the Social Determinants of Health 12 March 2013 Thanks to Ruth Bell www.instituteofhealthequity.org 1 Review of Social
Gender pension gap economic perspective
 Gender pension gap economic perspective Agnieszka Chłoń-Domińczak Institute of Statistics and Demography SGH Part of this research was supported by European Commission 7th Framework Programme project "Employment
CFA Institute Member Poll: Euro zone Stability Bonds
 CFA Institute Member Poll: Euro zone Stability Bonds I. About the Survey... 2 a. Background... 2 b. Purpose and Methodology... 2 II. Full Results... 2 Q1: Requirement of common issuance of sovereign bonds...
IZMIR UNIVERSITY of ECONOMICS
 IZMIR UNIVERSITY of ECONOMICS Department of International Relations and the European Union TURKEY EU RELATIONS ( EU308) FOREIGN DIRECT INVESTMENT IN THE EUROPEAN UNION AND TURKEY Prepared By: Büke OŞAFOĞLU
CANADA EUROPEAN UNION
 THE EUROPEAN UNION S PROFILE Economic Indicators Gross domestic product (GDP) at purchasing power parity (PPP): US$20.3 trillion (2016) GDP per capita at PPP: US$39,600 (2016) Population: 511.5 million
NOTE. for the Interparliamentary Meeting of the Committee on Budgets
 NOTE for the Interparliamentary Meeting of the Committee on Budgets THE ROLE OF THE EU BUDGET TO SUPPORT MEMBER STATES IN ACHIEVING THEIR ECONOMIC OBJECTIVES AS AGREED WITHIN THE FRAMEWORK OF THE EUROPEAN
Developments for age management by companies in the EU
 Developments for age management by companies in the EU Erika Mezger, Deputy Director EUROFOUND, Dublin Workshop on Active Ageing and coping with demographic change Prague, 6 September 2012 12/09/2012 1
Size and Development of Tax Evasion in 38 OECD countries: What do we (not) know?
 know?") November 2012 Pfusch_neu/taxevasion_38OECD.doc Size and Development of Tax Evasion in 38 OECD countries: What do we (not) know? Andreas Buehn* and Friedrich Schneider ** (This version: November 7, 2012)
November 2012 Pfusch_neu/taxevasion_38OECD.doc Size and Development of Tax Evasion in 38 OECD countries: What do we (not) know? Andreas Buehn* and Friedrich Schneider ** (This version: November 7, 2012)
Low employment among the 50+ population in Hungary
 Low employment among the + population in Hungary The role of incentives, health and cognitive capacities Janos Divenyi (Central European University) and Gabor Kezdi (Central European University and IE-CRSHAS)
The EFTA Statistical Office: EEA - the figures and their use
 The EFTA Statistical Office: EEA - the figures and their use EEA Seminar Brussels, 13 September 2012 1 Statistics Comparable, impartial and reliable statistical data are a prerequisite for a democratic
Budget repair and the size of Australia s government. Melbourne Economic Forum John Daley, Grattan Institute December 2015
 Budget repair and the size of Australia s government Melbourne Economic Forum John Daley, Grattan Institute December 2015 Budget repair and the size of Australia s government Attitudes to the best approach
EIOPA Statistics - Accompanying note
 EIOPA Statistics - Accompanying note Publication references: Published statistics: [Balance sheet], [Premiums, claims and expenses], [Own funds and SCR] Disclaimer: Data is drawn from the published statistics
Electricity & Gas Prices in Ireland. Annex Business Electricity Prices per kwh 2 nd Semester (July December) 2016
 2016") Electricity & Gas Prices in Ireland Annex Business Electricity Prices per kwh 2 nd Semester (July December) 2016 ENERGY POLICY STATISTICAL SUPPORT UNIT 1 Electricity & Gas Prices in Ireland Annex Business
Electricity & Gas Prices in Ireland Annex Business Electricity Prices per kwh 2 nd Semester (July December) 2016 ENERGY POLICY STATISTICAL SUPPORT UNIT 1 Electricity & Gas Prices in Ireland Annex Business
WHAT WOULD THE NEIGHBOURS SAY?
 WHAT WOULD THE NEIGHBOURS SAY? HOW INEQUALITY MEANS THE UK IS POORER THAN WE THINK High Pay Centre About the High Pay Centre The High Pay Centre is an independent non-party think tank established to monitor
3 Labour Costs. Cost of Employing Labour Across Advanced EU Economies (EU15) Indicator 3.1a
 Indicator 3.1a") 3 Labour Costs Indicator 3.1a Indicator 3.1b Indicator 3.1c Indicator 3.2a Indicator 3.2b Indicator 3.3 Indicator 3.4 Cost of Employing Labour Across Advanced EU Economies (EU15) Cost of Employing Labour
3 Labour Costs Indicator 3.1a Indicator 3.1b Indicator 3.1c Indicator 3.2a Indicator 3.2b Indicator 3.3 Indicator 3.4 Cost of Employing Labour Across Advanced EU Economies (EU15) Cost of Employing Labour
Social Protection and Social Inclusion in Europe Key facts and figures
 MEMO/08/625 Brussels, 16 October 2008 Social Protection and Social Inclusion in Europe Key facts and figures What is the report and what are the main highlights? The European Commission today published
Empirical appendix of Public Expenditure Distribution, Voting, and Growth
 Empirical appendix of Public Expenditure Distribution, Voting, and Growth Lorenzo Burlon August 11, 2014 In this note we report the empirical exercises we conducted to motivate the theoretical insights
Tax morale, Occupation and Income Level: An Analysis of Portuguese Taxpayers
 Tax morale, Occupation and Income Level: An Analysis of Portuguese Taxpayers C. Sá, A. Martins, and C. Gomes Abstract Tax morale is recognized as one of the most important variables to understand the levels
Lowest implicit tax rates on labour in Malta, on consumption in Spain and on capital in Lithuania
 STAT/13/68 29 April 2013 Taxation trends in the European Union The overall tax-to-gdp ratio in the EU27 up to 38.8% of GDP in 2011 Labour taxes remain major source of tax revenue The overall tax-to-gdp
Index. tax evasion ethics in tax system change in Bureaucracy 3-11 Canada
 Ability to pay principle 58 Administrative burden 51-79, 73-90, 430 Albania 112 Alternative Minimum Tax (AMT) 75 Anti-capitalistic mentality 318 Appeals in Armenia 317 Argentina 281-308 Armenia 113, 309-358
Spain France. England Netherlands. Wales Ukraine. Republic of Ireland Czech Republic. Romania Albania. Serbia Israel. FYR Macedonia Latvia
 Germany Belgium Portugal Spain France Switzerland Italy England Netherlands Iceland Poland Croatia Slovakia Russia Austria Wales Ukraine Sweden Bosnia-Herzegovina Republic of Ireland Czech Republic Turkey
Consumer credit market in Europe 2013 overview
 Consumer credit market in Europe 2013 overview Crédit Agricole Consumer Finance published its annual survey of the consumer credit market in 28 European Union countries for seven years running. 9 July
International Statistical Release
 International Statistical Release This release and additional tables of international statistics are available on efama s website (www.efama.org). Worldwide Investment Fund Assets and Flows Trends in the
Borderline cases for salary, social contribution and tax
 Version Abstract 1 (5) 2015-04-21 Veronica Andersson Salary and labour cost statistics Borderline cases for salary, social contribution and tax (Workshop on Labour Cost Survey, Rome, Italy 5-6 May 2015)
Remuneration Systems of Civil Servants: Member States of the European Union and Georgia. (Comparative analysis)
") Remuneration Systems of Civil Servants: Member States of the European Union and Georgia (Comparative analysis) April, 2013 Author: Nino Tsukhishvili IDFI Legal Expert/ Recipient of the Open Society Human
Remuneration Systems of Civil Servants: Member States of the European Union and Georgia (Comparative analysis) April, 2013 Author: Nino Tsukhishvili IDFI Legal Expert/ Recipient of the Open Society Human
Corrigendum. OECD Pensions Outlook 2012 DOI: ISBN (print) ISBN (PDF) OECD 2012
 ISBN (PDF) OECD 2012") OECD Pensions Outlook 2012 DOI: http://dx.doi.org/9789264169401-en ISBN 978-92-64-16939-5 (print) ISBN 978-92-64-16940-1 (PDF) OECD 2012 Corrigendum Page 21: Figure 1.1. Average annual real net investment
OECD Pensions Outlook 2012 DOI: http://dx.doi.org/9789264169401-en ISBN 978-92-64-16939-5 (print) ISBN 978-92-64-16940-1 (PDF) OECD 2012 Corrigendum Page 21: Figure 1.1. Average annual real net investment
Shadow Economy in Austria the Latest Developments up to 2016
 ShadEc_Austria.doc 28 July 2016 Prof. Dr. Friedrich Schneider Johannes Kepler University Linz Department of Economics Altenbergerstraße 69 A-4040 Linz Phone: 0043-732-2468-7340, Fax: -7341 E-mail: friedrich.schneider@jku.at
Poverty and social inclusion indicators
 Poverty and social inclusion indicators The poverty and social inclusion indicators are part of the common indicators of the European Union used to monitor countries progress in combating poverty and social
Maintaining Adequate Protection in a Fiscally Constrained Environment Measuring the efficiency of social protection systems
 Maintaining Adequate Protection in a Fiscally Constrained Environment Measuring the efficiency of social protection systems May 27, 2013 Brussels, Belgium Ramya Sundaram. rsundaram@worldbank.org The World
A. INTRODUCTION AND FINANCING OF THE GENERAL BUDGET. EXPENDITURE Description Budget Budget Change (%)
") DRAFT AMENDING BUDGET NO. 2/2018 VOLUME 1 - TOTAL REVENUE A. INTRODUCTION AND FINANCING OF THE GENERAL BUDGET FINANCING OF THE GENERAL BUDGET Appropriations to be covered during the financial year 2018
DRAFT AMENDING BUDGET NO. 2/2018 VOLUME 1 - TOTAL REVENUE A. INTRODUCTION AND FINANCING OF THE GENERAL BUDGET FINANCING OF THE GENERAL BUDGET Appropriations to be covered during the financial year 2018
Aging with Growth: Implications for Productivity and the Labor Force Emily Sinnott
 Aging with Growth: Implications for Productivity and the Labor Force Emily Sinnott Emily Sinnott, Senior Economist, The World Bank Tallinn, June 18, 2015 Presentation structure 1. Growth, productivity
united kingdom Statistical Profile introduction to united kingdom united kingdom statistical profile no.18 january 2010
 united kingdom united kingdom united kingdom Statistical Profile Matt Flynn introduction to united kingdom Ireland Since 1992, the has had a relatively long period of economic growth and stability. However,
Dividends from the EU to the US: The S-Corp and its Q-Sub. Peter Kirpensteijn 23 September 2016
 Dividends from the EU to the : The S-Corp and its Q-Sub Peter Kirpensteijn 23 September 2016 The Inc: large multinational manufacturing company residents The LLC: holding company owned by tax residents
A GER AMWAY GLOBAL ENTREPRENEURSHIP REPORT WHAT DRIVES THE ENTREPRENEURIAL SPIRIT
 A GER 2018 AMWAY GLOBAL ENTREPRENEURSHIP REPORT WHAT DRIVES THE ENTREPRENEURIAL SPIRIT S U R V E Y D E S I G N KEY FACTS OF THIS YEAR S SURVEY EDITION PARTNER RESEARCH INSTITUTE 8 th edition FIELDWORK
SELECTED MAJOR SOCIAL SECURITY PENSION REFORMS IN EUROPE, Source: ISSA Databases
 SELECTED MAJOR SOCIAL SECURITY PENSION REFORMS IN EUROPE, 1995-2014 Source: ISSA Databases COUNTRY AREA YR SUMMARY OBJECTIVE POSSIBLE EVALUATION CRITERIA* United Kingdom Pensions 2014 Replacing public
November 5, Very preliminary work in progress
 November 5, 2007 Very preliminary work in progress The forecasting horizon of inflationary expectations and perceptions in the EU Is it really 2 months? Lars Jonung and Staffan Lindén, DG ECFIN, Brussels.
Flash Eurobarometer 398 WORKING CONDITIONS REPORT
 Flash Eurobarometer WORKING CONDITIONS REPORT Fieldwork: April 2014 Publication: April 2014 This survey has been requested by the European Commission, Directorate-General for Employment, Social Affairs
Statistical Annex. Sources and definitions
 Statistical Annex Sources and definitions Most of the statistics shown in these tables can also be found in two other (paper or electronic) publication and data repository, as follows: The annual edition
Figures of Catalonia Generalitat de Catalunya Government of Catalonia
 www.idescat.cat Figures of Generalitat de Catalunya Government of POPULATION Population (1 000) 7 479 46 704 505 730 49.3 49.3 48.8 51.0 50.8 51.2 Structure () 0-14 years 15.9 15.2 15.6 15-24 years 9.4
Sustainability and Adequacy of Social Security in the Next Quarter Century:
 Sustainability and Adequacy of Social Security in the Next Quarter Century: Balancing future pensions adequacy and sustainability while facing demographic change Krzysztof Hagemejer (Author) John Woodall
Study on the framework conditions for High Growth Innovative Enterprises (HGIEs)
") Study on the framework conditions for High Growth Innovative Enterprises : framework conditions selected, measurement, data availability and contingency measures : Innovation, high-growth and internationalization
Study on the framework conditions for High Growth Innovative Enterprises : framework conditions selected, measurement, data availability and contingency measures : Innovation, high-growth and internationalization