Trading Systems. Jerzy Korczak
|
|
|
- Jeffery Geoffrey Barber
- 6 years ago
- Views:
Transcription
1 Trading Systems Jerzy Korczak 1
2 What is a trading systems? A trading system is a group of specific rules, or parameters, that determine entry and exit points for a given equity. These points, known as signals, are often marked on a chart in real time and prompt the immediate execution of a trade. Here are some of the most common technical analysis tools used to construct the parameters of trading systems: Moving averages Stochastic Oscillators Relative strength Bollinger bands 2

3 Trading rule combination Often, two or more of these forms of indicators will be combined in the creation of a rule. Average Cross-Over System Using 5 and 20 Moving Averages 3
4 Comment "anyone with average intelligence can learn to trade, however, it is much easier to learn what you should do in trading than to do it. Developing an effective trading system is by no means an easy task. It requires a solid understanding of the many parameters available, the ability to make realistic assumptions and the time and dedication to develop the system. The main markets for which trading systems are suitable are the equity, forex and futures markets. 4
 Indexes NASDAQ Composite NASDAQ-100 NASDAQ Biotechnology Index Trading schedule NASDAQ has a pre-market session from 7:00am to 9:30am, a normal trading session from 9:30am to 4:00pm and a")
5 NASDAQ National Association of Securities Dealers Automated Quotations Stock exchange Location New York City, United States Founded February 4, 1971 Owner NASDAQ OMX Group MarketCap US$8trillion (2016) Indexes NASDAQ Composite NASDAQ-100 NASDAQ Biotechnology Index Trading schedule NASDAQ has a pre-market session from 7:00am to 9:30am, a normal trading session from 9:30am to 4:00pm and a post-market session from 4:00pm to 8:00pm 5

 Xavier Rolet (CEO) Pound sterling 2,292 (as of September 2016) 6.06 trillion GBP (De c 2014) [1] 1.")
6 Normal trading sessions on the main orderbook (SETS) are from 08:00 to 16:30 local time every day of the week except Saturdays, Sundays and holidays. Type Location Founded Owner Key people Currency No. of listings Market cap Volume Indices Website Stock exchange London, United Kingdom 1801; 215 years ago London Stock Exchange Group Donald Brydon (Chairman) Xavier Rolet (CEO) Pound sterling 2,292 (as of September 2016) 6.06 trillion GBP (De c 2014) [1] 1.16 trillion GBP (Dec 2014) FTSE 100 Index FTSE 250 Index FTSE 350 Index FTSE SmallCap Index FTSE All-Share Index change.com 6

7 LSE 7
8 STOCK MARKET Google Finance Yahoo Finance ETRADE Thinkorswim TradeKing Stock Assault Volcone Analyzer Pro Virtual trading Investools JStock Trading Tools FOREX MetaTrader Signal Software TradeStation Ninja Trader FibonacciKiller 8
9 Constructing a trading system 1. Setup- data, software 2. Design models, algorithms, trading rules 3. Decision making 4. Testing 5. Trading 6. Troubleshooting and evolution Your trading system must make money, limit risk, be robust 9
10 Stock Screeners A stock screener is a tool that investors and traders can use to filter stocks based on user-defined metrics. Stock screeners are offered on many websites and trading platforms, and they allow users to select trading instruments that fit a certain profile set of criteria. Some trading platforms and software allow users to screen using technical indicator data. For example, one could filter for stocks that are trading above their 200- day moving average or whose Relative Strength Index (RSI) values are between a specified range. 10

11 JStock Stock market data 11


12 JStock Time series visualization 12

13 JStock - Indicators 13

14 JStock - Indicators Downward trend Upward trend MACD = EMA[12] of price - EMA[26] of price where: EMA[12] = 12 days exponential moving average, EMA[24] = 24 days EMA Interpretation When MACD is positive, the stock is moving in upward trend. When MACD is negative, the stock is moving in downward trend. 14
15 JStock - Oscillator RSI = [100/(1 + RS)] where: RS = (Avg. of n-day up closes)/(avg. of n-day down closes), n= days (most analysts use 9-15 day RSI) Interpretation The RSI ranges from 0 to 100. If the RSI approaches 30 a stock is considered oversold. A stock is considered overbought around the 70 level and you should consider selling. 15


16 JStock - Candlestick 16

17 JStock - Download Indicators 17

18 JStock Editing of stock indicators Logical operation Equality Arithmetic operation Constant Stock relative history Stock history Real time stock information Alert Text Text 18
19 JStock Editing... 19

20 JStock Editing... 20

21 JStock Editing... 21

22 JStock Simulation 22

23 JStock Simulation of indicators 23
24 JStock Simulation 24

25 JStock Stock of Interest 25

26 JStock Scanning 26

27 JStock Portfolio Management 27

28 JStock Portfolio Management 28

29 JStock Portfolio Management 29

30 Google Finance 30

31 Google Finance 31

32 Google Finance - Technicals 32

33 Google Finance Stock Screener 33

34 Google Finance Stock Screener 34

35 Yahoo Finance Stock Screener 35

36 Yahoo Finance Stock Screener 36

37 Quandl Service for professionals 37

38 Quandl 38

39 Quandl 39
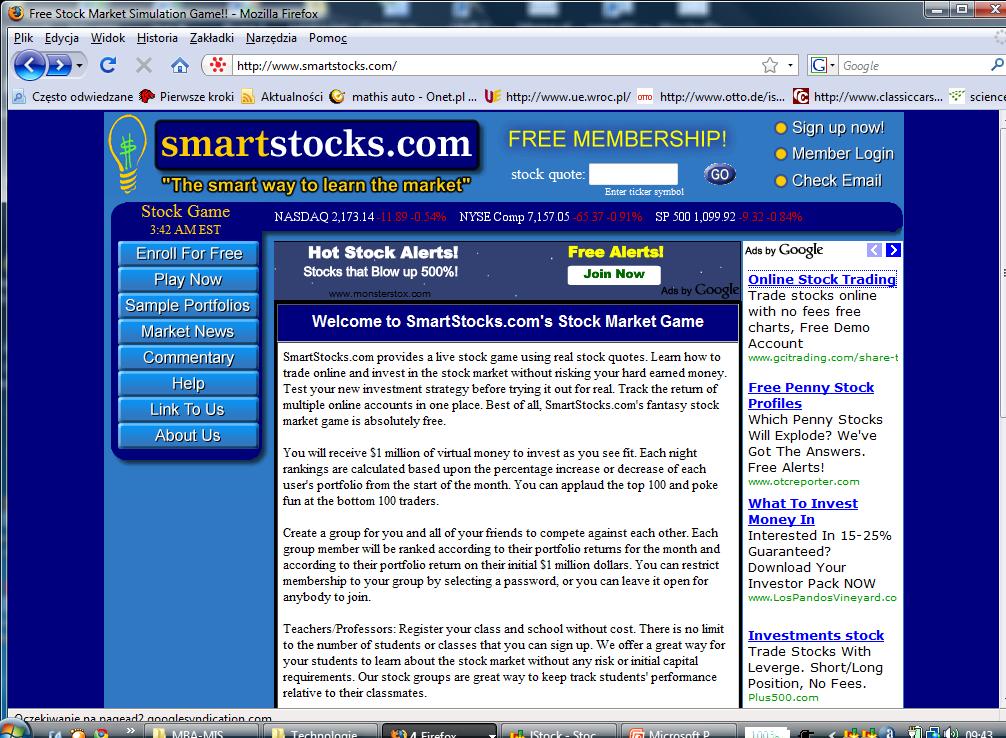
40 SmartStocks.com 40
41 SmartStocks.com SmartStocks.com provides a live stock game using real stock quotes. Learn how to trade online and invest in the stock market without risking your hard earned money. Test your new investment strategy before trying it out for real. Track the return of multiple online accounts in one place. You will receive $1 million of virtual money to invest as you see fit. Each night rankings are calculated based upon the percentage increase or decrease of each user's portfolio from the start of the month. Create a group for you and all of your friends to compete against each other. Each group member will be ranked according to their portfolio returns for the month and according to their portfolio return on their initial $1 million dollars. 41
42 SmartStocks.com How to Play: 1. Sign up for an account 2. Login to your account 3. Join up to 4 groups (a password may be required for some groups) 4. Identify ticker symbols of stocks to trade by reviewing sample portfolios or by using the ticker lookup function 5. Begin trading Teachers/Professors and Group Leaders 1. Sign up for an account 2. Login to your account 3. Create a group with an optional password 4. Invite others (students) to create their own accounts and join your group (distribute group name and password if applicable) 5. View group members' rankings, portfolios, and trading history 42

43 SmartStocks- Portfolio 43

44 SmartStocks Portfolio example 44

45 SmartStocks Stock Chart 45

46 SmartStocks Stock Portfolio 46

47 FOREX Contests & Competitions in
48 48
INDICATORS. The Insync Index
 INDICATORS The Insync Index Here's a method to graphically display the signal status for a group of indicators as well as an algorithm for generating a consensus indicator that shows when these indicators
Ez Trading Platform. Alltogether, traders are able to perform a more comprehensive probability analysis of their trades.
 Ez Trading Platform The Ez Trading Platform contains a robust set of tools built from the ground up to allow traders to take advantage of a new methodology in calculating probability that we call Probability
ZNET Android Manual for SmartPhone
 ZNET Android Manual for SmartPhone ZNET Android OS Real-Time Trading Program "ZNET Android" is the stock real time trading program developed by KTZMICO Company limited. You are able to view real time stock
Technical Analysis. Dealing Room Peter Leonidou. Peter Leonidou
 Technical Analysis Dealing Room Questions Traders Should Ask What is the trend? What is the pivot point? What is the support levels? What is the resistance levels? Strong or weaker USD? What 1. Trade
AUTHOR: NG EE HWA, TRAINER, CHARTNEXUS TRADING WITH RSI
 AUTHOR: NG EE HWA, TRAINER, CHARTNEXUS TRADING WITH RSI While the use of Relative Strength Index (RSI) to get technical buy and sell signals in a range-bound market is well understood, the use of this
Stock Trading Following Stock Price Index Movement Classification Using Machine Learning Techniques
 Stock Trading Following Stock Price Index Movement Classification Using Machine Learning Techniques 6.1 Introduction Trading in stock market is one of the most popular channels of financial investments.
MYAITREND. The World s First Free AI Stock Analyst. User Guide
 MYAITREND The World s First Free AI Stock Analyst User Guide MYAITREND User Guide MyAiTrend LLC E-Mail: support@myaitrend.com Table of Contents The First Free AI Stock Analyst... 2 Three Important Principles
Schwab Investing Insights Trading Edition Text Close Window Size: November 15, 2007
 Schwab Investing Insights Trading Edition Text Close Window Size: from TheStreet.com November 15, 2007 ON TECHNIQUES Two Indicators Are Better Than One The Relative Strength Index works well but it s better
FREE FOREX SIGNALS BY
 page 1 / 6 page 2 / 6 free forex signals by pdf Forex for Dummies Free Ebook: How to Succeed in Forex Trading. Here's How You Can Succeed in Forex Currency Trading. The purpose of this book is to show
NinjaTrader: A Beginner's Guide To Trade Management, Strategy Testing And Automated Trading With NinjaTrader [Kindle Edition] By Frederick Morales
![NinjaTrader: A Beginner's Guide To Trade Management, Strategy Testing And Automated Trading With NinjaTrader [Kindle Edition] By Frederick Morales](/thumbs/89/98093566.jpg "NinjaTrader: A Beginner's Guide To Trade Management, Strategy Testing And Automated Trading With NinjaTrader [Kindle Edition] By Frederick Morales") NinjaTrader: A Beginner's Guide To Trade Management, Strategy Testing And Automated Trading With NinjaTrader [Kindle Edition] By Frederick Morales If searching for a ebook NinjaTrader: A Beginner's Guide
NinjaTrader: A Beginner's Guide To Trade Management, Strategy Testing And Automated Trading With NinjaTrader [Kindle Edition] By Frederick Morales If searching for a ebook NinjaTrader: A Beginner's Guide
META TRADER 5 MOBILE (iphone/ipad)
") (iphone/ipad) USER GUIDE www.fxbtrading.com 1 CONTENTS Getting started...4 Quotes...6 Depth of market...9 Chart...11 How to trade...13 History...19 2 The world s most popular forex trading platform MetaTrader
(iphone/ipad) USER GUIDE www.fxbtrading.com 1 CONTENTS Getting started...4 Quotes...6 Depth of market...9 Chart...11 How to trade...13 History...19 2 The world s most popular forex trading platform MetaTrader
Gtrade manual version 2.04 updated
 Gtrade manual version 2.04 updated 9.30.2016 Table of Contents Contents Table of Contents2 Getting started, Logging in and setting display language in TurboTick Pro3 Level 25 Order Entry8 Streamlined Order
VERY IMPORTANT Before you start you have to follow these instructions to insure that the strategy is working properly:
 Volatility Pivots User Guide help@volatilitypivots.com VERY IMPORTANT Before you start you have to follow these instructions to insure that the strategy is working properly: 1. This strategy works with
Chapter 2.3. Technical Analysis: Technical Indicators
 Chapter 2.3 Technical Analysis: Technical Indicators 0 TECHNICAL ANALYSIS: TECHNICAL INDICATORS Charts always have a story to tell. However, from time to time those charts may be speaking a language you
Trading Platforms-Liquidity-White Label-Management Systems
 Trading Platforms-Liquidity-White Label-Management Systems WORLD CLASS TRADING PLATFORM PROVIDER Brokers Introducing Brokers Forex Training Schools Hedge Funds & Money Managers PROVIDING OPPORTUNITY INTRODUCTION
SWITCHBACK (FOREX) V1.4
 V1.4") SWITCHBACK (FOREX) V1.4 User Manual This manual describes all the parameters in the ctrader cbot. Please read the Switchback Strategy Document for an explanation on how it all works. Last Updated 11/11/2017
SWITCHBACK (FOREX) V1.4 User Manual This manual describes all the parameters in the ctrader cbot. Please read the Switchback Strategy Document for an explanation on how it all works. Last Updated 11/11/2017
Advanced Trading Systems Collection MACD DIVERGENCE FOREX TRADING SYSTEM
 MACD DIVERGENCE FOREX TRADING SYSTEM 1 This system will cover the MACD divergence. With this forex trading system you can trade any currency pair (I suggest EUR/USD and GBD/USD when you start), and you
RSI 2 System. for Shorter term SWING trading and Longer term TREND following. Dave Di Marcantonio 2016
 RSI 2 System for Shorter term SWING trading and Longer term TREND following Dave Di Marcantonio 2016 ddimarc@gmail.com Disclaimer Dave Di Marcantonio Disclaimer & Terms of Use All traders and self-directed
Table of Contents. Risk Disclosure. Things we will be going over. 2 Most Common Chart Layouts Anatomy of a candlestick.
 Table of Contents Risk Disclosure Things we will be going over 2 Most Common Chart Layouts Anatomy of a candlestick Candlestick chart Anatomy of a BAR PLOT Indicators Trend-Lines Volume MACD RSI The Stochastic
CHAPTER V TIME SERIES IN DATA MINING
 CHAPTER V TIME SERIES IN DATA MINING 5.1 INTRODUCTION The Time series data mining (TSDM) framework is fundamental contribution to the fields of time series analysis and data mining in the recent past.
Compiled by Timon Rossolimos
 Compiled by Timon Rossolimos - 2 - The Seven Best Forex Indicators -All yours! Dear new Forex trader, Everything we do in life, we do for a reason. Why have you taken time out of your day to read this
Copyright Alpha Markets Ltd. Page 1
 Copyright Alpha Markets Ltd. Page 1 Financial Industry - Module 1 Welcome to this unit on the Financial Industry. In this module we will be explaining the various aspects of the Financial Industry as well
TECHNICAL INDICATORS
 TECHNICAL INDICATORS WHY USE INDICATORS? Technical analysis is concerned only with price Technical analysis is grounded in the use and analysis of graphs/charts Based on several key assumptions: Price
Your Guide to Schwab.com. How to make the most of Schwab s online client center.
 Your Guide to Schwab.com How to make the most of Schwab s online client center. Welcome to Schwab.com With the Schwab.com client center, it s easier than ever to access all your accounts as well as our
MAGIC FOREX DIVERGENCE Trading Guide
 Tim Trush & Julie Lavrin Introducing MAGIC FOREX DIVERGENCE Trading Guide Your guide to financial freedom. Tim Trush, Julie Lavrin, T&J Profit Club, 2017, All rights reserved www.forexmystery.com Table
TD AMERITRADE TDA 1899: NYC Tradeshow Demo. 2/06/12 Storyboard v 1.0
 TD AMERITRADE TDA 1899: NYC Tradeshow Demo 2/06/12 Storyboard v 1.0 1. On-Screen Text: Expect More. Do More. Serious tools for serious traders. : Title slide 2. On-Screen Text: You re a serious trader
Technical Analysis. A Language of the Market
 Technical Analysis A Language of the Market Acknowledgement: Most of the slides were originally from CFA Institute and I adapted them for QF206 https://www.cfainstitute.org/learning/products/publications/inv/documents/forms/allitems.aspx
Understanding Oscillators & Indicators March 4, Clarify, Simplify & Multiply
 Understanding Oscillators & Indicators March 4, 2015 Clarify, Simplify & Multiply Disclaimer U.S. Government Required Disclaimer Commodity Futures Trading Commission Futures and Options trading has large
Table Of Contents. Introduction. When You Should Not Use This Strategy. Setting Your Metatrader Charts. Free Template 15_Min_Trading.tpl.
 Table Of Contents Introduction When You Should Not Use This Strategy Setting Your Metatrader Charts Free Template 15_Min_Trading.tpl How To Trade 15 Min. Trading Strategy For Long Trades 15 Min. Trading
Charting And Technical Analysis By Fred Mcallen
 Charting And Technical Analysis By Fred Mcallen My 10 Favorite Technical Analysis Books - All Star Charts - - It feels like almost every day someone asks me what books I recommend reading if they're trying
Presents FOREX ALPHA CODE
 Presents FOREX ALPHA CODE Forex Alpha Code Published by Alaziac Trading CC Suite 509, Private Bag X503 Northway, 4065, KZN, ZA www.tradeology.com Copyright 2014 by Alaziac Trading CC, KZN, ZA Reproduction
COMMODITIES CORNER. Gold prices slip as Dollar recover. Synopsis
 COMMODITIES CORNER December 21, 2018 Synopsis Gold (Play the Range) US$1,278 US$1,266 US$1,255 US$1,240 Silver (Play the Range) US$15.00 US$14.85 US$14.70 US$14.30 WTI (Play the Range) US$47.85 US$46.90
GuruFocus User Manual: Interactive Charts version
 GuruFocus User Manual: Interactive Charts 2018 version 1 Contents: 0. Introduction and Overview a. Accessing Interactive Charts b. Interactive Chart Layout 1. Adding Stocks to the Chart 2. Graphing Financial
Welcome to FOREX e-book
 Welcome to FOREX e-book Table of Contents 1. Trading platforms... 2 2. What is traded in the Forex Market?... 3 3. What is Forex?... 3 4. Advantages of the Forex Market... 4 5. How to read currency quotes...
Applying fundamental & technical analysis in stock investing
 Applying fundamental & technical analysis in stock investing 2017 Live demonstration of research and trading tools Develop an Ongoing Strategy with Fidelity Software and mobile apps to enhance your trading
charts to also be in the overbought area before taking the trade. If I took the trade right away, you can see on the M1 chart stochastics that the
 When you get the signal, you first want to pull up the chart for that pair and time frame of the signal in the Web Analyzer. First, I check to see if the candles are near the outer edge of the Bollinger
GUIDE TO STOCK trading tools
 P age 1 GUIDE TO STOCK trading tools VI. TECHNICAL INDICATORS AND OSCILLATORS I. Introduction to Indicators and Oscillators Technical indicators, to start, are data points derived from a specific formula.
Technical Indicators that Really Work
 Technical Indicators that Really Work TECHNICAL INDICATORS Technical indicators have become more important than Fundamentals. With the proper use of technical indicators investors are able to determine
INTERMEDIATE EDUCATION GUIDE
 INTERMEDIATE EDUCATION GUIDE CONTENTS Key Chart Patterns That Every Trader Needs To Know Continution Patterns Reversal Patterns Statistical Indicators Support And Resistance Fibonacci Retracement Moving
Sunny s Dynamic Moving Average
 20120510 Sunny s Dynamic Moving Average SunnyBands Today We Will Compare and Contrast Simple Moving Averages Exponential Moving Averages Bollinger Bands Keltner Channels SunnyBands Introduction After 30
Using Oscillators & Indicators Properly May 7, Clarify, Simplify & Multiply
 Using Oscillators & Indicators Properly May 7, 2016 Clarify, Simplify & Multiply Disclaimer U.S. Government Required Disclaimer Commodity Futures Trading Commission Futures and Options trading has large
COMMODITIES CORNER. Gold prices hold steady amid easing dollar. Synopsis Gold (Play the Range) 2nd Resistance
 2nd Resistance") COMMODITIES CORNER November 05, 2018 Synopsis Gold (Play the Range) US$1,245 US$1,235 US$1,225 US$1,210 Silver (Play the Range) US$15.00 US$14.90 US$14.50 US$14.30 WTI (Play the Range) US$64.90 US$63.90
COMMODITIES CORNER November 05, 2018 Synopsis Gold (Play the Range) US$1,245 US$1,235 US$1,225 US$1,210 Silver (Play the Range) US$15.00 US$14.90 US$14.50 US$14.30 WTI (Play the Range) US$64.90 US$63.90
Level I Learning Objectives by chapter
 Level I Learning Objectives by chapter 1. Introduction to the Evolution of Technical Analysis Describe the development of modern technical analysis Describe the origins of technical analysis 2. A New Age
The Schaff Trend Cycle
 The Schaff Trend Cycle by Brian Twomey This indicator can be used with great reliability to catch moves in the currency markets. Doug Schaff, president and founder of FX Strategy, created the Schaff trend
COMMODITIES CORNER. Gold inches up as retreat of bond yields weigh on dollar. Synopsis Gold (Play the Range) 2nd Resistance
 2nd Resistance") COMMODITIES CORNER October 10, 2018 Synopsis Gold (Play the Range) US$1,200 US$1,195 US$1,185 US$1,180 Silver (Play the Range) US$14.80 US$14.60 US$14.30 US$14.10 WTI (Play the Range) US$75.90 US$74.90
COMMODITIES CORNER October 10, 2018 Synopsis Gold (Play the Range) US$1,200 US$1,195 US$1,185 US$1,180 Silver (Play the Range) US$14.80 US$14.60 US$14.30 US$14.10 WTI (Play the Range) US$75.90 US$74.90
Advanced Technical Analysis (Chart and Non-Chart Based) Program for Brokers / Retail Clients / Day Traders / Positional Traders
 Program for Brokers / Retail Clients / Day Traders / Positional Traders") National Stock Exchange of India Limited Advanced Technical Analysis (Chart and Non-Chart Based) Program for Brokers / Retail Clients / Day Traders / Positional Traders OBJECTIVE The 1 day training session
National Stock Exchange of India Limited Advanced Technical Analysis (Chart and Non-Chart Based) Program for Brokers / Retail Clients / Day Traders / Positional Traders OBJECTIVE The 1 day training session
Risk Disclosure and Liability Disclaimer:
 Risk Disclosure and Liability Disclaimer: The author and the publisher of the information contained herein are not responsible for any actions that you undertake and will not be held accountable for any
TD AMERITRADE TDA 1817: Trade Expo Demo - Las Vegas. 5/1/11 Storyboard v 4.0
 TD AMERITRADE TDA 1817: Trade Expo Demo - Las Vegas 5/1/11 Storyboard v 4.0 1. Expect More. Do More. Serious tools for serious traders. : Title slide 2. You re a serious trader : Transition title slide
Chapter 2.3. Technical Indicators
 1 Chapter 2.3 Technical Indicators 0 TECHNICAL ANALYSIS: TECHNICAL INDICATORS Charts always have a story to tell. However, sometimes those charts may be speaking a language you do not understand and you
Bitcoin Ninjas 'Ninja Signals' Buy/Sell Alerts & Backtesting TradingView Script
 Bitcoin Ninjas 'Ninja Signals' Buy/Sell Alerts & Backtesting TradingView Script (for Cryptocurrencies, Forex, GunBot, ProfitTrailer, Autoview, manual or automatic trading, and more) Allows users to easily
Quantitative Trading System For The E-mini S&P
 AURORA PRO Aurora Pro Automated Trading System Aurora Pro v1.11 For TradeStation 9.1 August 2015 Quantitative Trading System For The E-mini S&P By Capital Evolution LLC Aurora Pro is a quantitative trading
Real-time Analytics Methodology
 New High/Low New High/Low alerts are generated once daily when a stock hits a new 13 Week, 26 Week or 52 Week High/Low. Each second of the trading day, the stock price is compared to its previous 13 Week,
Alpesh s guide to using the Alpesh Patel Special Edition Section 4
 Alpesh s guide to using the Alpesh Patel Special Edition Section 4 How to use my technical Radars Alpesh Patel s Momentum Radar This radar is for people who want to analyse stocks the way I do. It is the
Star Search Strategy. Barbara Star, PhD. Wednesday 07/11/2018
 Learn a strategy for finding profitable trades in stocks and commodities using a variation of Bollinger Bands and another, less well-known, indicator that is available on most charting software. Both conservative
Class 8: Trading Neutral. I. Learning to Trade Neutral. Today s Class
 Today s Class Psychology of Trading Neutral Anatomy of a trade Bracket trading/trading neutral Determining stops Journaling Class 8: Trading Neutral I. Learning to Trade Neutral Learning to Trade Neutral/Psychology
Forex Ultimate Trend Signals Indicator - MT4
 Forex Ultimate Trend Signals Indicator - MT4 Enjoy Forex Trading with this awesome Trend Signals Indicator (Ultimate Trend Signals Indicator with BUY/SELL Alerts) (Upgraded for new MT4-Build 600 Platform)
OSCILLATORS. TradeSmart Education Center
 OSCILLATORS TradeSmart Education Center TABLE OF CONTENTS Oscillators Bollinger Bands... Commodity Channel Index.. Fast Stochastic... KST (Short term, Intermediate term, Long term) MACD... Momentum Relative
Chapter 3.1. Capital and Trade Flow Drive Currency Values
 Chapter 3.1 Capital and Trade Flow Drive Currency Values 0 Contents CAPITAL AND TRADE FLOW DRIVE CURRENCY VALUES Supply and demand are the simple concepts behind all price movement in the forex market,
Applying fundamental & technical analysis in stock investing
 Applying fundamental & technical analysis in stock investing Today s Agenda Fundamental Analysis Topics include a basic overview, a discussion on ways to use it, and hands on tool demonstrations Trading
IVolatility.com E G A R O N E S e r v i c e
 IVolatility.com E G A R O N E S e r v i c e Stock Sentiment Service User Guide The Stock Sentiment service is a tool equally useful for both stock and options traders as it provides you stock trend analysis
Robert Roy's Power Hour Indicator Applied to TradeStation
 Author: Rick Maus Date: March 18, 2017 Version: 1.0 Version Description 1.0 Initial document. Robert Roy's Power Hour Indicator Applied to TradeStation Table of Contents Table of Contents... 1 Overview...
Top Down Analysis Success Demands Singleness of Purpose
 Chapter 9 Top Down Analysis Success Demands Singleness of Purpose Armed with a little knowledge about the stock and options market as well as a desire to trade, many new traders are faced with the daunting
FOREX TRADING STRATEGIES.
 FOREX TRADING STRATEGIES www.ifcmarkets.com www.ifcmarkets.com 2 One of the most powerful means of winning a trade is the portfolio of Forex trading strategies applied by traders in different situations.
An informative reference for John Carter's commonly used trading indicators.
 An informative reference for John Carter's commonly used trading indicators. At Simpler Options Stocks you will see a handful of proprietary indicators on John Carter s charts. This purpose of this guide
COMMODITIES CORNER. Gold nudges up amid looming U.S. tariffs on China. Synopsis Gold (Play the Range) 2nd Resistance
 2nd Resistance") COMMODITIES CORNER September 17, 2018 Synopsis Gold (Play the Range) US$1,210 US$1,200 US$1,190 US$1,185 Silver (Play the Range) US$14.50 US$14.30 US$14.00 US$13.80 WTI (Play the Range) US$71.40 US$70.20
COMMODITIES CORNER September 17, 2018 Synopsis Gold (Play the Range) US$1,210 US$1,200 US$1,190 US$1,185 Silver (Play the Range) US$14.50 US$14.30 US$14.00 US$13.80 WTI (Play the Range) US$71.40 US$70.20
FOREX PROFITABILITY CODE
 FOREX PROFITABILITY CODE Forex Secret Protocol Published by Old Tree Publishing CC Suite 509, Private Bag X503 Northway, 4065, KZN, ZA www.oldtreepublishing.com Copyright 2013 by Old Tree Publishing CC,
Course Modules and Schedules
 Course Modules and Schedules Course Modules Together with our international partners we have developed a comprehensive Forex Trading Course. Some of the highlights of our course are: Its interactive features
.. /-!"::- '..- ( \.- - '-/../ '
 ....'-/ -!"::- ' ( \.-../ ' /- Triple Shot Forex Trading System The term "Day Trading" usually refers to the act of buying and selling a financial instrument within the same day. In the Forex market, a
Class 7: Moving Averages & Indicators. Quick Review
 Today s Class Moving Averages Class 7: Moving Averages & Indicators 3 Key Ways to use Moving Averages Intro To Indicators 2 Indicators Strength of Lines Quick Review Great for establishing point of Support
The six technical indicators for timing entry and exit in a short term trading program
 The six technical indicators for timing entry and exit in a short term trading program Definition Technical analysis includes the study of: Technical analysis the study of a stock s price and trends; volume;
RISK DISCLOSURE STATEMENT / DISCLAIMER AGREEMENT
 RISK DISCLOSURE STATEMENT / DISCLAIMER AGREEMENT Trading any financial market involves risk. This report and all and any of its contents are neither a solicitation nor an offer to Buy/Sell any financial
Technical analysis & Charting The Foundation of technical analysis is the Chart.
 Technical analysis & Charting The Foundation of technical analysis is the Chart. Charts Mainly there are 2 types of charts 1. Line Chart 2. Candlestick Chart Line charts A chart shown below is the Line
IJMSS Vol.03 Issue-06, (June, 2015) ISSN: International Journal in Management and Social Science (Impact Factor )
 ISSN: International Journal in Management and Social Science (Impact Factor )") (Impact Factor- 4.358) A Comparative Study on Technical Analysis by Bollinger Band and RSI. Shah Nisarg Pinakin [1], Patel Taral Manubhai [2] B.V.Patel Institute of BMC & IT, Bardoli, Gujarat. ABSTRACT:
(Impact Factor- 4.358) A Comparative Study on Technical Analysis by Bollinger Band and RSI. Shah Nisarg Pinakin [1], Patel Taral Manubhai [2] B.V.Patel Institute of BMC & IT, Bardoli, Gujarat. ABSTRACT:
COMMODITIES CORNER. Gold slips as new U.S. tariffs on China lifts dollar. Synopsis Gold (Play the Range) 2nd Resistance
 2nd Resistance") COMMODITIES CORNER September 18, 2018 Synopsis Gold (Play the Range) US$1,210 US$1,205 US$1,190 US$1,185 Silver (Play the Range) US$14.50 US$14.30 US$14.00 US$13.80 WTI (Play the Range) US$70.20 US$69.20
COMMODITIES CORNER September 18, 2018 Synopsis Gold (Play the Range) US$1,210 US$1,205 US$1,190 US$1,185 Silver (Play the Range) US$14.50 US$14.30 US$14.00 US$13.80 WTI (Play the Range) US$70.20 US$69.20
Forex Trend Directive
 FOREX GEMINI CODE Presents Forex Trend Directive Forex Gemini Code Published by Alaziac Trading CC Suite 509, Private Bag X503 Northway, 4065, KZN, ZA www.forexgeminicode.com Copyright 2014 by Alaziac
Introduction...1 Part I: Getting Familiar with Candlestick Charting and Technical Analysis...7. Part V: The Part of Tens...315
 Contents at a Glance Introduction...1 Part I: Getting Familiar with Candlestick Charting and Technical Analysis...7 Chapter 1: Understanding Charting and Where Candlesticks Fit In...9 Chapter 2: Getting
In here, you will learn the trading rules on how to use trade teh 200 exponential moving average with the Awesome Oscillator Indicator.
 Trading Strategy / Gert.Nurme@iBrokers.ee 200 EMA with Awesome Oscillator Introduction The 200 EMA With Awesome Oscillator Forex Trading Strategy is a very simple trend trading system and therefore in
An Overview of the ZMA : The Superior Moving Average Page 2. ZMA Indicator: Infinite Flexibility and Maximum Adaptability Page 4
 An Overview of the ZMA : The Superior Moving Average Page 2 ZMA Indicator: Infinite Flexibility and Maximum Adaptability Page 4 ZMA PaintBar: Moving Average Color-Coding Page 5 Responsiveness and Inertia:
1. Introduction 2. Chart Basics 3. Trend Lines 4. Indicators 5. Putting It All Together
 Technical Analysis: A Beginners Guide 1. Introduction 2. Chart Basics 3. Trend Lines 4. Indicators 5. Putting It All Together Disclaimer: Neither these presentations, nor anything on Twitter, Cryptoscores.org,
Index. long-term 200-day, 45 market cycle, myths, very long-term, weekly-based longer-term, 46-47
 Appel_Index2.qxd 2/22/05 11:07 AM Page 229 Index Symbols 10-day rate of change, NYSE Index advance-decline line, 133-134 18-month market cycles, 104 21-day rate of change, NYSE Index advance-decline line,
IVGraph Live Service Contents
 IVGraph Live Service Contents Introduction... 2 Getting Started... 2 User Interface... 3 Main menu... 3 Toolbar... 4 Application settings... 5 Working with layouts... 5 Working with tabs and viewports...
Introduction. Technical analysis is the attempt to forecast stock prices on the basis of market-derived data.
 Technical Analysis Introduction Technical analysis is the attempt to forecast stock prices on the basis of market-derived data. Technicians (also known as quantitative analysts or chartists) usually look
COMMODITIES CORNER. Gold falls to 1-week low on stronger dollar, but holds above $1,300 level. Synopsis
 COMMODITIES CORNER February 07, 2019 Synopsis Gold (Play the Range) US$1,320 US$1,310 US$1,300 US$1,295 Silver (Play the Range) US$16.20 US$16.00 US$15.60 US$15.50 WTI (Play the Range) US$56.60 US$55.60
Introduction. Leading and Lagging Indicators
 1/12/2013 Introduction to Technical Indicators By Stephen, Research Analyst NUS Students Investment Society NATIONAL UNIVERSITY OF SINGAPORE Introduction Technical analysis comprises two main categories:
Stacking Indicators Getting a GREAT entry! TWEEZERS Tweezer top/bottom at the band The stock is trending up Gap down (against the trend) Any moving
 Any moving") Dean Storholt I am not a registered broker-dealer or investment adviser. I will mention that I consider certain securities or positions to be good candidates for the types of strategies we are discussing
Dean Storholt I am not a registered broker-dealer or investment adviser. I will mention that I consider certain securities or positions to be good candidates for the types of strategies we are discussing
Trend Channels: How to Identify Easy Profit-Making Opportunities Using Simple Chart Analysis
 Trend Channels: How to Identify Easy Profit-Making Opportunities Using Simple Chart Analysis Trend channels produce a very powerful trading technique. They are very visible, which makes them easy to utilize
Top 10 BEST Forex Trading Strategies PDF Report Ebook Author
 Top 10 BEST Forex Trading Strategies PDF Report Ebook Author Top 10 Best Forex Trading Strategies PDF Report If you re in the pursuit of nding the Best Forex trading Strategy and the keys to choosing a
Forex Analysis And Trading Effective Top Down Strategies Combining Fundamental Position And Technical Analyses
 Forex Analysis And Trading Effective Top Down Strategies Combining Fundamental Position And Technical We have made it easy for you to find a PDF Ebooks without any digging. And by having access to our
CHAMELEON INDICATORS. A new way to view the markets. Alex Cole 05/10/17
 CHAMELEON INDICATORS A new way to view the markets. Alex Cole 05/10/17 THE CHAMELEON TREND AND CHAMELEON OSCILLATOR STUDIES One of the most important benefits of visualization is that it allows us visual
How I Trade Profitably Every Single Month without Fail
 How I Trade Profitably Every Single Month without Fail First of all, let me take some time to introduce myself to you. I am Koon Hwee (KH Lee) and I am a full time currency trader. I have a passion for
Technical Analysis. Used alone won't make you rich. Here is why
 Technical Analysis. Used alone won't make you rich. Here is why Roman sadowski The lesson to take away from this part is: Don t rely too much on your technical indicators Keep it simple and move beyond
Go No Go Indicators: Part 2
 Go No Go Indicators: Part 2 March 22, 2017 Dennis W. Wilborn Active Trend Trading Disclaimer U.S. Government Required Disclaimer Commodity Futures Trading Commission Futures and Options trading has large
COMMODITIES CORNER. Gold set for biggest weekly loss since August as dollar weighs. Synopsis Gold (Play the Range) 2nd Resistance
 2nd Resistance") COMMODITIES CORNER Synopsis Gold (Play the Range) US$1,230 US$1,225 US$1,215 US$1,210 Silver (Play the Range) US$14.70 US$14.60 US$14.30 US$14.20 WTI (Play the Range) US$61.80 US$60.80 US$58.30 US$57.00
COMMODITIES CORNER Synopsis Gold (Play the Range) US$1,230 US$1,225 US$1,215 US$1,210 Silver (Play the Range) US$14.70 US$14.60 US$14.30 US$14.20 WTI (Play the Range) US$61.80 US$60.80 US$58.30 US$57.00
COMMODITIES CORNER. Gold subdued ahead of Fed Chair speech, G20 summit. Synopsis
 COMMODITIES CORNER November 27, 2018 Synopsis Gold (Play the Range) US$1,236 US$1,228 US$1,218 US$1,210 Silver (Play the Range) US$14.70 US$14.60 US$14.30 US$14.20 WTI (Play the Range) US$53.30 US$52.30
MagicBreakout Forex Trading Strategy
 Tim Trush & Julie Lavrin introduce MagicBreakout Forex Trading Strategy Your guide to financial freedom. Tim Trush, Julie Lavrin, T&J Profit Club, 2007, All rights reserved www.magicbreakout.com Table
ModeX V1.6 User Guide to Installation and Operation
 ModeX V1.6 User Guide to Installation and Operation A TradeStation Trading System for liquid futures contracts This electronic book is Copyright PMKing Trading 2005. Any unauthorized distribution, copying,
Swing Trading Strategies that Work
 Swing Trading Strategies that Work Jesse Livermore, one of the greatest traders who ever lived once said that the big money is made in the big swings of the market. In this regard, Livermore successfully
Options Mastery Day 1 System Training
 Options Mastery Day 1 System Training Day 1 Agenda 10:00-10:15 - Intro & Course Outline 10:15-11:00 Indicator Overview and Setup 11:00-11:15 - Break 11:15-12:15 - Active Swing Trader Training 12:15-12:30
Instruction (Manual) Document
 Document") Instruction (Manual) Document This part should be filled by author before your submission. 1. Information about Author Your Surname Your First Name Your Country Your Email Address Your ID on our website
Instruction (Manual) Document This part should be filled by author before your submission. 1. Information about Author Your Surname Your First Name Your Country Your Email Address Your ID on our website
Technical Analysis. Used alone won't make you rich. Here is why
 Technical Analysis. Used alone won't make you rich. Here is why Roman Sadowski The lesson to take away from this part is: Don t rely too much on your technical indicators Keep it simple and move beyond