GuruFocus User Manual: Interactive Charts version
|
|
|
- Polly Sherman
- 5 years ago
- Views:
Transcription
1 GuruFocus User Manual: Interactive Charts 2018 version 1
2 Contents: 0. Introduction and Overview a. Accessing Interactive Charts b. Interactive Chart Layout 1. Adding Stocks to the Chart 2. Graphing Financial Metrics on the Chart 3. Changing the Date Range of the Chart 4. The Chart Window 5. Miscellaneous Header Options 6. Saving the Chart and Full Screen option 7. The Drawing Toolbox 8. Predefined Charts 9. Creating Custom Series and User-defined Charts 10. Adding Economic and Technical Indicators to Charts 11. The Switch Ticker Option 12. Miscellaneous 13. FAQs 2

3 0. Introduction and Overview As discussed in his best-seller, One Up on Wall Street, legendary investor Peter Lynch compared the company s price line to its earnings line to determine if a company is undervalued. Buying growth stocks at deeply undervalued prices and selling them when the price rose sharply above the earnings line generally leads to good returns. GuruFocus s Interactive Chart feature allows you to construct charts including the famous Peter Lynch Chart. However, you can construct an eclectic variety of charts and do many other cool things with the Interactive Charts feature. This manual will highlight some of the key features. Accessing Interactive Charts You can access the Interactive Charts in several ways, as described in Figures 0.1 to 0.3: 1. On the Search box located underneath the blue GuruFocus ribbon, type in a company s ticker symbol, and choose the one with Interactive Chart. 2. On a company s summary page, scroll down until you see Peter Lynch Chart. Click on the Interactive Charts link in the upper-right corner. 3. Click on Interactive Chart among the tabs listed in the gray ribbon near the top of the page. Figures 0.1 to 0.3 show how to access the interactive charts feature for Apple Inc. (AAPL), one of several companies that we will discuss throughout this user manual. 3

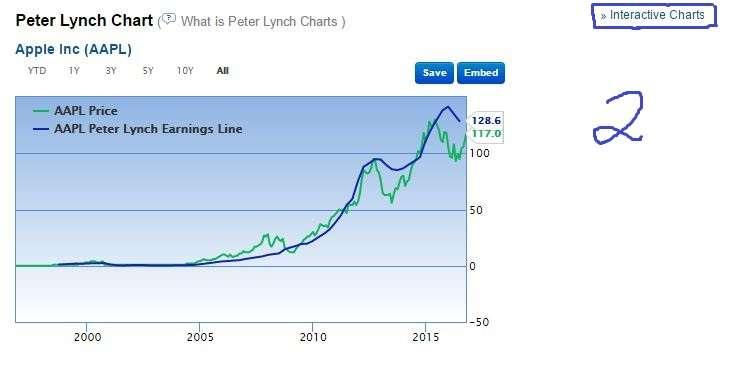
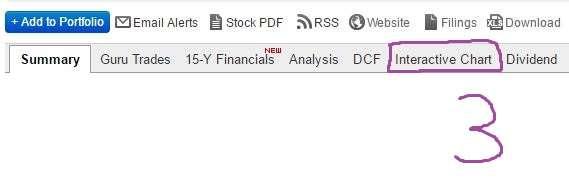
4 Figure 0.1 Figure 0.2 Figure 0.3 4

5 The Interactive Chart interface layout Figure 0.4 shows a sample screen shot with numbers illustrating key features of the Interactive Chart interface. This user manual will discuss each of the features in a separate section. 1. Adding stocks to the chart Figure 0.4: The Interactive Chart interface Figure 1.1 shows a sample chart containing the historical price trend of three airline companies: United, American and Delta. (Note that Figure 1.1 replicates Figure 0.4 without the position numbers.) Figure 1.1 5

6 You can add a company stock to the chart by entering the desired company name or ticker symbol in the Ticker or company name box and then clicking on the Add button. (You can easily select the desired company stock using the drop-down menu that pops up while to enter the stock name / ticker. Figure 1.2 illustrates this by adding Southwest Airlines to the Chart.) The Interactive Chart will then add the stock to the row of stocks in the header section as illustrated in Figure 1.3. Figure 1.2 Figure 1.3 You can remove a stock from the chart by clicking the button containing the desired company stock ticker. Figure 1.4 shows the result after removing United from the chart. 6

7 Figure 1.4 7
8 2. Graphing financial series on the chart The Interactive Charts feature allows you to graph the historical trendline of a company s financials, ranging from the stock price and revenue to the company s operating margin or days sales outstanding. You can view all available financial metrics by clicking the tabs located in Position 2 of Figure 2 (on Page 5). We have organized the financial metrics into the following tabs: Most Popular: This tab contains the most popular financial metrics, including the share price, revenue, net income, price-valuation ratios and price-valuation bands. Valuation and Quality: This tab contains financial metrics related to financial strength and profitability. You will find metrics like the Yacktman forward rate of return, the Piotroski F-score and the operating margin underneath this tab. Income Statement: This tab contains financial metrics that appear on a company s income statement, which includes revenue, cost of goods sold, SGA expenses and operating income. Balance Sheet: This tab contains financial metrics that appear on a company s balance sheet, which includes cash (and cash equivalents), accounts receivable, inventories, long-term debt and total equity. Cash Flow Statement: This tab contains financial metrics that appear on a company s cash flow statement, which includes depreciation, change in working capital, cash flow for dividends, capital expenditures and free cash flow. Economic Indicators: This tab allows you to add economic indicators to the chart. We will discuss this further in Section 10. Customized Series: This tab lists the series that you defined through the Build Your Own Series feature. We will discuss this in Section 9. Technical Indicators: This tab allows you to add indicators like the simple moving average (SMA), the exponential moving average (EMA) and the relative strength index (RSI). We will discuss this further in Section 10. You can search for a financial series using the Search series name bar. For example, you can (easily) find operating margin by typing oper in the search bar. Figure 2.1 shows a sample screen shot illustrating the search series feature. 8

9 Figure 2.1 You can add financial series to the Chart by checking the box next to the desired series. The red numbers next to each tab header indicate the number of active financial series for that tab. For example, Figure 2.2 shows the price-sales valuation bands chart for Southwest Airlines. The red (3) next to the Most Popular tab indicates that we have three active financial series under this tab. Figure 2.2 You can remove a financial series from the chart by unchecking the box next to the desired series. Figure 2.3 shows the result after removing the Price at Max PS Ratio and Price at Min PS Ratio series from Figure

10 Figure 2.3 There is a not so obvious new feature regarding the Financial Metrics pane. See that small little arrow near the bottom-right corner of the Technical Indicators tab? (Please see Figure 2.4 for a screen shot that zooms in on this feature.) You can drag this arrow to change the size of the Financial Metrics pane. Figure

11 3. Change the date range of the chart By default, the Chart graphs the historical financial information for all years, i.e. all available years up to (Note that we now give a maximum of 30 years of historical data for U.S. companies as of the writing of this user manual.) You can change the date range of the chart either by clicking one of the date buttons or setting a customized range using the From and To boxes. These options are located at Position 3 in Figure 0.4 on Page 5. (New feature) Clicking on the From or To box reveals a calendar that allows you to select the desired dates. The drop-down calendar also contains two menus that allow you to select the desired month and year. You can also click the left and right arrows to scroll by the month. Please see Figure 3.1 for a sample screen shot of the calendar. Figure 3.1 The date buttons allow you to choose one of the following predefined time periods from the current date: three months, six months, year to date, one year, three years, five years, 10 years, 15 years and all years. Figure 3.2 shows the historical price-earnings and price-sales ratios of Southwest for the past 15 years while Figure 3.3 shows the historical share prices of American, United and Delta since Jan. 2,

12 Figure 3.2 Figure
13 4. The Chart window The body of the Chart graphs all selected financial series selected in Section 2 above. You will see the legend in the upper-left corner and the Drawing Toolbox (more detail about this in Section 7) in the upper-right corner. You can also change the scale of the Y-axis by clicking it on the Chart. Figure 4.1 shows the pop-up window once you do so. Please click the blue Change button to save the settings. Figure 4.1 If you wish to remove a series from the chart but do not want to delete it altogether, you can deactivate it by clicking the series name from the legend. Figure 4.2 replicates the chart shown in Figure 3.3 but with the NYSE:DAL Price series grayed out. Notice that NYSE:DAL is still listed in the header row of stocks although the financial series does not show in the Chart window. Figure
14 5. The Interactive Chart header buttons You will notice a row of options above the date range buttons as Position 5 of Figure 0.4 illustrates. The first three options allow you to graph annual, quarterly or trailing-12-month (TTM) data. Figures 5.1 to 5.3 show American s revenue and net income graphed on an annual, quarterly and TTM basis. Figure 5.1: American s Revenue and Net Income for the past 15 years, annual values Figure 5.2: American s Revenue and Net Income for the past 15 years, quarterly values 14
15 Figure 5.3: American s Revenue and Net Income for the past 15 years, TTM values (July 2017 new layout update) Note that GuruFocus has consolidated the list of Chart Options into a drop-down menu. These features allow you to graph the values as a percent change, percent year over year (YOY) or logarithmic values as illustrated in Figures Figure 5.6 also illustrates the US Recession feature, which highlights the years where the U.S. stock market fell into a recession. You can also change the chart to a bar graph or add industry-median and growth trendlines as illustrated in Figures Figure 5.4: American s Revenue and Net Income for the past 15 years, annual, percent change 15
16 Figure 5.5: American s Revenue and Net Income for the past 15 years, annual, percent YOY Figure 5.6: American s Annual Revenue and Net Income, log values, US Recession years highlighted 16


17 Figure 5.7: American s Revenue and Net Income for past 15 years as bar graphs, with revenue growth trendline Figure 5.8: Price-Sales Ratio of United, American and Delta for past 15 years, with industry median price-sales 17
18 6. Saving the Chart You can save the Chart in three ways as illustrated in Figure 0.4, Position 6. Click the Excel button to download the financial data points to Excel, the Save Image button to save the chart as a PNG file or the Embed button to obtain the embed link for the chart. Figures 6.1 to 6.3 show sample screenshots for each of the three actions. (We will illustrate the three save chart actions using the gross margin for Nike and Adidas, two major sports apparel companies.) Figure 6.1: Nike and Adidas Gross Margin Chart as Excel output (Excel Download Feature) 18

19 Figure 6.2: Nike and Adidas Gross Margin Chart as a PNG (Save Chart Feature) <a href=" n,s:xter:ads"><img src=" /></a> Figure 6.3: Nike and Adidas Gross Margin Chart Embed Code (Embed Chart Feature) 19
20 7. The Drawing Toolbox Position 7 of Figure 0.4 points to four square buttons with the following symbols: T for text A square \ for line A circle These four buttons make up the Drawing Toolbox feature that allows you to add text and shapes to the chart. For example, consider Figure 7.1, which shows Apple s Peter Lynch Chart for the past 15 years. This chart utilizes the Text and Square drawing features. (Note: we will discuss the Peter Lynch Chart and other predefined charts in more detail in Section 8.) Figure 7.1 Figure 7.1 highlights two time periods where Apple traded below its Peter Lynch earnings line. The Cupertino, California tech giant likely offered good value potential from late 2012 to early 2014 and then from late 2015 to Unfortunately, Apple s share price is significantly overvalued and near a 15-year high as of the writing of this user manual. One major use of the Line tool is to draw a historical median value on the chart. For example, consider Figure 7.2, which shows the cyclically-adjusted price-earnings ratio (also known as the Shiller PE) of the Standard & Poor s 500 index (S&P 500) since
21 Figure 7.2 Figure 7.2 contains a black line around 16.8, the historical mean Shiller PE ratio of the S&P 500. The graph also highlights the U.S. recession years and marks the peaks and troughs with circles. Note that the Shiller PE tumbled during a U.S. recession, including the Great Depression of 1929 and the early 2000s recession. These sharp declines followed two major peaks: one toward the end of the Roaring 20s and the second one around the 2000 dot-com bubble. The Shiller PE nosedived once more during the 2008 financial crisis. 21
22 8. Predefined and User-defined Charts GuruFocus constructed several predefined charts, including the Peter Lynch Chart, the Price-Sales Valuation Bands Chart, the Income Statement Chart and the Balance Sheet Chart. Selecting a Predefined Chart You can select a predefined chart from the drop-down menu illustrated in Figure 8.1. Figure 8.1 GuruFocus provides an eclectic variety of predefined charts. The following section briefly discusses each of them: Peter Lynch Chart As mentioned in Section 0, Peter Lynch constructed a simple chart to determine the relative valuation of a company s stock. The legendary investor set the earnings line at 15 times the company s priceearnings without nonrecurring items. Figure 8.2 replicates the chart in Figure 7.1 without the Drawing Toolbox text and shapes. Figure 8.2 Unfortunately, there are two drawbacks in using the Peter Lynch chart. Some companies, like Amazon and Google, have significantly high price-earnings ratios. A Peter Lynch chart at 15 times earnings would severely overvalue these companies share price (especially Amazon!) as illustrated in Figure
23 (Amazon s price-earnings ratio is over 180 as of the writing of this user manual. Figure 8.4 shows Amazon s Peter Lynch Chart at 180 times earnings. ) Figure 8.3: Amazon s Peter Lynch Chart Figure 8.4: Amazon s Peter Lynch Chart with price at PE (nri) = 180 Peter Lynch noted that the price-earnings ratio can give misleading results, especially for cyclical companies like American Airlines ( full-fare airlines) and Royal Caribbean (luxury cruises). Such companies usually have higher profit margins at the peaks of business cycles and poor profit margins during recessions. Figure 8.5 illustrates this by looking at the two companies price and operating margin. 23
24 Figure 8.5: Price and Operating Margin for American Airlines and Royal Caribbean with U.S. Recession years highlighted Notice how the companies price and operating margin tumbled during the U.S. recessions in 1991, 2001 and Price-Sales Valuation Bands Unlike the price-earnings ratio, the price-sales ratio can give more accurate valuation comparisons among stocks within a single industry. (Please refer to Figure 5.8 on Page 16 for a sample chart showing the price-sales ratio of three airline companies and the industry-median price-sales ratio.) The price-sales ratio works the best when comparing current valuations with the historical valuations as company profit margins tend to revert to the mean over time (approximately every eight years). Due to this, the price-sales valuation bands chart can identify when the stock is likely undervalued and when the stock is likely overvalued. Figure 8.6 shows the price-sales valuation chart for American Airlines while Figure 8.7 shows the respective chart for Royal Caribbean. 24
25 Figure 8.6: Price-Sales Valuation Bands Chart for American Airlines, past 15 years Income Statement Figure 8.7: Price-Sales Valuation Bands Chart for Royal Caribbean, past 15 years The Income Statement predefined chart graphs the company s revenue, gross profit, operating income and net income on the same chart. This chart allows you to look for trends in the company s revenue and earnings. Figure 8.8 shows a sample Income Statement chart for American Airlines. 25
26 Figure 8.8: Income Statement Chart for American Airlines since 1987 Balance Sheet The Balance Sheet predefined chart graphs the company s cash, total assets, total equity, long-term debt and capital lease obligation and PP&E assets. This chart allows you to look at the company s cash trends to the company s debt trends, which can give you a sense of the company s historical leverage. Figure 8.9 shows a sample Balance Sheet chart for American Airlines. Figure 8.9: Balance Sheet Chart for American Airlines, all years since 1987 GDP and GNP 26

27 The GDP and GNP predefined chart simply graphs the gross domestic product and the gross national product on the same graph. Dividend Yield The Dividend Yield predefined chart simply graphs the company s historical dividend yield on the Chart. Price and Revenue The Price and Revenue predefined chart graphs the company s price and revenue trend on the same graph. Peter Lynch Chart with Estimates This version of the Peter Lynch Chart includes a yellow section labeled Analyst Estimates as Figure 8.10 illustrates. The Analyst Estimates section sheds light on how analysts expect the company s share price to trend in the upcoming years based on earnings estimates. CTAS Figure 8.10: American s Peter-Lynch Chart with Analyst Estimates, all years since 1973 The CTAS predefined chart simply graphs the company s price and median price-sales valuation line. CTAS most likely stands for Central Tendency Average Sales as this predefined chart compares a company s share price to its intrinsic value based on its 10-year median price-sales ratio as Figure 8.11 illustrates. 27
28 (New Feature for July 2017) Other predefined charts Figure 8.11: CTAS Chart for American Airlines, all years since 1973 We also added the Default Price Chart, a Net Income Chart and a Price-Earnings Valuation Bands chart to the list of predefined charts. The Default Price Chart simply graphs the company s price trend while the Net Income Chart simply graphs the company s net income trend. As illustrated in Figure 8.12, the Price-Earnings Valuation Bands chart is similar to the Price-Sales Valuation Bands chart, but with Price at Max P/E and Price at Min P/E instead. The graph also includes Price at Median P/E. Figure 8.12: Price-Earnings Valuation Bands Chart for American Airlines, past 10 years 28
29 We also include a PS Bands chart that also includes Price at Median P/S as well as Price at Min P/S and Price at Max P/S. Figure 8.13 illustrates a sample PS Bands chart. Note that this chart is like Figure 8.5 on Page 25 but with the Price at Median P/S line added. Figure 8.13: PS Bands Chart for American Airlines, past 10 years 29
30 9. Creating custom series and custom charts One key feature of Interactive Charts is that you can build your own financial series and charts. To create a custom series, first click on the Customized Series tab on the left (see Position 9 from Figure 0.4). You should see a Build Your Own Series button as Figure 9.1 illustrates. Figure 9.1 Click on Build Your Own Series to pop up a window like the one in Figure 9.2. Figure 9.2 Please enter the formula for your customized series, e.g., Price / Median PS Value. Click on the blue Next Step button to display a screen like Figure

31 Figure 9.3 You can then enter a name for your custom series in the box given and select the appropriate Y-axis from the radio buttons. Please click on the blue Finish button to save the custom series. To edit or delete a series, first highlight the desired series. You should then see a pencil with clipboard icon and an X as Figure 9.4 illustrates. You will also see the formula for that series. Figure 9.4 You can click on the pencil with clipboard to edit a series formula. Please follow the steps outlined in Figures 9.1 to 9.3 to edit the series. 31
32 To delete a custom series, click on the X symbol. You will see a dialog box like the one in Figure 9.5. Please click the OK button to confirm deleting the series. Saving a custom chart Figure 9.5 As of the writing of this manual, the Save settings button is located below the Predefined Charts drop-down menu discussed in Section 8. (Please see Figure 8.1 for reference.) Clicking on the Save settings button pops up a window like the one in Figure 9.6. Please enter the name of your custom chart as prompted and then click the Save button to save the settings. You will then see a dialog box indicating your settings have been saved. Figure 9.6 You can access your list of custom charts by opening the Predefined Charts drop-down menu and scrolling down until you see --- User Defined Charts ---. Click on the desired chart to view it in the Chart window. (New July 2017 Feature Alert) You can set a saved chart as the default chart by opening it from the Predefined Charts list and clicking the Set as default button (the rightmost button in Figure 8.1 on Page 22 above). The website will display a dialog box confirming your settings. Going forward, whichever chart you set as default will display each time you click the Reset all button. 32
 share price Crude oil prices, WTI (economic indicator 108) Figure 10.")
33 10. Incorporating economic and technical indicators in Interactive Charts You can add economic and technical indicators to the Interactive Chart by clicking on the Economic Indicators and Technical Indicators tabs. For example, you can create a chart containing the following series: Exxon Mobil Corp. (XOM) share price Crude oil prices, WTI (economic indicator 108) Figure 10.1 shows a screen shot of the above chart. Figure 10.1: XOM Share Prices and Crude Oil Prices, Past 15 Years You search for economic indicators the same way as you do for financial series as discussed in Section 3 above. If you enter Crude in the Search series bar, you should see the Crude Oil Prices: West Texas Intermediate (WTI) filter underneath the Economic Indicators tab. You can also include technical indicators like the simple moving average and the relative strength index by opening the Technical Indicators tab. The Technical Charts tab contains three sections: Chart Type, Overlays and Indicators. (New Feature Announcement: The Chart Types) GuruFocus added several options for the price chart: the standard line chart, candlestick chart, OHLC (open-high-low-close) chart and the area chart. The candlestick chart is like a series of box and whisker plots as follows: 33
34 The box ranges from the opening and closing share prices of the stock for a particular day. This box gets filled in if the opening price is higher or stays white if the closing price is higher. Figure 10.2 shows a sample candlestick chart for XOM. Figure 10.2: XOM s candlestick chart for the past three months While the open-high-low-close (OHLC) chart works like a candlestick chart, each bar on the OHLC chart instead has two branches: the left branch indicates the opening share price while the right branch indicates the closing share price. Figure 10.3 shows a sample OHLC chart for XOM. Figure 10.3: XOM s OHLC chart for the past two months 34

35 The standard line chart is the same chart you are used to seeing while the area chart makes the price chart resemble a mountain. Figure 10.4 shows a sample area chart for XOM. Overlays Figure 10.4: XOM s Area Chart, all years since 1973 You can add up to three overlays on the Chart at one time. We offer four types of overlays: Simple moving average (SMA): An arithmetic moving average calculated by adding the closing price of a stock for a specific number of days (please enter this in the box to the right) and then dividing the total by the number of days. (Source: Investopedia) Exponential moving average (EMA): The EMA is like the SMA, but puts more weight on the more recent data. (Investopedia) Figure 10.5 shows a sample SMA chart while Figure 10.6 shows a sample EMA chart for XOM. 35
36 Figure 10.5: Sample SMA Chart for XOM, past 10 years Figure 10.6: Sample EMA Chart for XOM, past 10 years The Bollinger bands are usually graphed two standard deviations away from a simple moving average. Consider Figure 10.7, which shows XOM s SMA 200 line with the Bollinger bands. 36
37 Figure 10.7: Sample SMA 200 Chart with Bollinger Bands for XOM, past 10 years Keltner channels, like Bollinger bands, are volatility-based envelopes set above and below an EMA. (Source: Investopedia) Unlike Bollinger bands, Keltner channels are not based on the SMA or standard deviations. Instead, Keltner channels use the average true range and are based on exponential moving average (EMA). Figure 10.8 shows a sample Keltner channels chart for XOM. Figure 10.8: Sample Keltner Channel Chart for XOM, past 10 years 37
38 Indicators The MACD (moving average converge / diverge), according to Investopedia, is a trend-following momentum indicator that shows the relationship between two moving averages of prices. Figure 10.9 shows a sample MACD chart for XOM. Figure 10.9: Sample MACD Chart for XOM, past 10 years The relative strength index (RSI) is primarily used to determine whether a stock is overbought or oversold. Usually, RSI readings above 70 indicate overbought while RSI readings under 30 indicate oversold. Figure shows a sample RSI chart for XOM. 38
39 Figure 10.10: Sample RSI Chart for XOM, past 10 years The money flow index (MFI) incorporates the stock s price and volume to the RSI according to the Investopedia definition. Like the RSI, the MFI can also determine whether a stock is overbought (MFI above 80) or oversold (MFI below 20). Figure shows a sample MFI chart for XOM. Figure 10.11: Sample Money Flow Index Chart for XOM, past 10 years 39

40 According to Investopedia, the stochastic oscillator computes the %K using the following formula: %K = 100*(closing price minus lowest price) all over (highest price minus lowest price) The %D is simply the three-period moving average of %K. Figure shows a sample stochastic oscillator chart for XOM. Figure 10.12: Sample Stochastic Oscillator chart for XOM, past 10 years The on balance volume (OBV) has the most complicated calculations among the four indicators according to Investopedia. This indicator depends on the day-to-day changes in the share price: if the share price increases, the OBV increases by the day s volume. A decline in share price drops the OBV by the day s volume. If the share price remains the same from the prior day, the OBV stays put for that day. Figure shows a sample OBV chart for XOM. 40
41 Figure 10.13: Sample OBV Chart for XOM, past 10 years 41
42 11. The Switch Ticker feature GuruFocus relocated the Switch Ticker above the Chart but below the gray ribbon as illustrated in Position 11 of Figure 0.4 above. The feature remains the way you expect: when you enter a ticker in the Switch Ticker and click Go, the website reloads the chart with the new ticker. Figures 11.1 and 11.2 illustrate this with Apple and Google. Figure 11.1: The Screen before I click the Go button next to the Switch Ticker feature Figure 11.2: The Screen after I click the said Go button 42
43 12. Miscellaneous Interactive Chart features We are always open to suggestions on how to improve the Interactive Chart. Please click on the red Help us improve the Interactive Chart button between the Tutorial and Switch Ticker items to open a survey like the one shown in Figure Figure
44 13. Interactive Chart FAQs Do I need a Premium membership to use Interactive Charts? o Although you can access Interactive Charts with a free membership, you do need Premium to save and create custom series and charts. o You also need a Premium membership to download Interactive Chart outputs to Excel. My chart looks weird. What should I do? o If you feel like one series is off the charts, i.e., it is too far away from the other series, you can deselect the series by clicking it from the legend. o Please refer to Figure 4.2 on Page 13 for an illustration. How can I delete the shapes I create using the Drawing Toolbox? Do I have to reset the chart? o Try selecting the shapes you wish to delete and then drag them to the bottom-right corner of the Chart. o You can always delete all shapes created by clicking the Reset all. However, this will also reset the chart to the default chart (you can control which chart to display by default using the Set as default button as illustrated in Figure 8.1 on Page 22.) What do the Interest Coverage values mean? o You should see a note below the chart like the one in Figure o o Figure 13.1 o The following bullet points decode the information in Figure 13.1: A value of 0 means that the company was at loss for the respective period. The company did not have the earnings to cover its interest expense. A value of 9999 means that the interest coverage produced a #N/A error for the respective period. Perhaps the company had long-term debt, but we did not have interest expense data for that period. A value of means that the company had zero long-term debt for the respective period. Otherwise, the interest coverage is -1 times the ratio between operating income and interest expense. What happens if I enter an invalid custom series? o Figure 13.2 shows a sample screen shot when you enter an invalid custom series like Price Q : 44
45 o o Figure 13.2 o You can try to choose the Y-axis for your invalid series and click the blue Finish button. However, you will then see an error message like the one shown in Figure o o Figure 13.3 o If you compare Figure 13.2 to Figure 9.3 on Page 33, you will notice that the Name your customized series box does not appear unless you enter a valid series formula. o Please click on the blue Back button and examine your formula. Make sure that all financial calculations have single quotes and your syntax is correct. Are you still taking suggestions on how to improve the Interactive Chart? o Yes! You can always leave us feedback on the Interactive Chart as discussed in Section 12 of the user manual. o Please click on the red Help us improve the Interactive Chart to access the survey. 45
GuruFocus User Manual: Interactive Charts
 GuruFocus User Manual: Interactive Charts Contents: 1. Introduction and Overview a. Accessing Interactive Charts b. Using the Interactive Chart Interface 2. Basic Features a. Financial Metrics b. Graphing
GuruFocus User Manual: My Portfolios
 GuruFocus User Manual: My Portfolios 2018 version 1 Contents 1. Introduction to User Portfolios a. The User Portfolio b. Accessing My Portfolios 2. The My Portfolios Header a. Creating Portfolios b. Importing
GuruFocus User Manual: All-in-One Guru Screener and Backtesting
 GuruFocus User Manual: All-in-One Guru Screener and Backtesting 2018 version 1 Contents One. Two. Three. Four. All-in-One Guru Screener: Basic Features 1. Introduction and Access a. Introduction to the
GuruFocus User Manual: New Guru Pages
 GuruFocus User Manual: New Guru Pages September 2018 version Contents: 0. Introduction a. What is a guru? b. New Guru Pages Overview 1. Key Guru Statistics 2. The Flash Chart 3. The Portfolio Composition
CFD Marketmaker v5.0 New Charting User Guide. 7 th June 2005 v1.2
 CFD Marketmaker v5.0 New Charting User Guide 7 th June 2005 v1.2 Contents Page Introduction...3 Charting...4 How to View a Chart... 4 Main Chart Window... 6 Date/Time & Value where the mouse is... 6 Value
IVGraph Live Service Contents
 IVGraph Live Service Contents Introduction... 2 Getting Started... 2 User Interface... 3 Main menu... 3 Toolbar... 4 Application settings... 5 Working with layouts... 5 Working with tabs and viewports...
StockFinder Workbook. Fast and flexible sorting and rule-based scanning. Charting with the largest selection of indicators available
 StockFinder Workbook revised Apr 23, 2009 Charting with the largest selection of indicators available Fast and flexible sorting and rule-based scanning Everything you need to make your own decisions StockFinder
META TRADER 5 MOBILE (iphone/ipad)
") (iphone/ipad) USER GUIDE www.fxbtrading.com 1 CONTENTS Getting started...4 Quotes...6 Depth of market...9 Chart...11 How to trade...13 History...19 2 The world s most popular forex trading platform MetaTrader
(iphone/ipad) USER GUIDE www.fxbtrading.com 1 CONTENTS Getting started...4 Quotes...6 Depth of market...9 Chart...11 How to trade...13 History...19 2 The world s most popular forex trading platform MetaTrader
Morningstar Office Academy Day 4: Research and Workspace
 Morningstar Office Academy Day 4: Research and Workspace - - - - - - - - - - - - - - - - - - - - - - - - - - - - - - - - - - - - - - 1 Lesson 1: Modifying Research Settings.......................................
Money Management (MX) Frequently Asked Question s
 Frequently Asked Question s") Money Management (MX) Frequently Asked Question s Account Maintenance How do I get rid of duplicate accounts? How do I permanently delete an account? How do I hide/exclude an account? How do I rename my
Money Management (MX) Frequently Asked Question s Account Maintenance How do I get rid of duplicate accounts? How do I permanently delete an account? How do I hide/exclude an account? How do I rename my
Creating a Standard AssetMatch Proposal in Advisor Workstation 2.0
 Creating a Standard AssetMatch Proposal in Advisor Workstation 2.0 - - - - - - - - - - - - - - - - - - - - - - - - - - - - - - - - - - - - - - 1 What you will learn - - - - - - - - - - - - - - - - - -
Investoscope 3 User Guide
 Investoscope 3 User Guide Release 3.0 Copyright c Investoscope Software Contents Contents i 1 Welcome to Investoscope 1 1.1 About this User Guide............................. 1 1.2 Quick Start Guide................................
StockFinder 5 Workbook
 StockFinder 5 Workbook Updated Februar y 2010 STOCKFINDER 5 WORKBOOK Worden Brothers, Inc. www.worden.com Five Oaks Office Park 4905 Pine Cone Drive Durham, NC 27707 STOCKFINDER 5 WORKBOOK 2010 Worden
Using the Clients & Portfolios Module in Advisor Workstation
 Using the Clients & Portfolios Module in Advisor Workstation Disclaimer - - - - - - - - - - - - - - - - - - - - - - - - - - - - - - - - - - - - - 1 Overview - - - - - - - - - - - - - - - - - - - - - -
Table of Contents. Risk Disclosure. Things we will be going over. 2 Most Common Chart Layouts Anatomy of a candlestick.
 Table of Contents Risk Disclosure Things we will be going over 2 Most Common Chart Layouts Anatomy of a candlestick Candlestick chart Anatomy of a BAR PLOT Indicators Trend-Lines Volume MACD RSI The Stochastic
Gtrade manual version 2.04 updated
 Gtrade manual version 2.04 updated 9.30.2016 Table of Contents Contents Table of Contents2 Getting started, Logging in and setting display language in TurboTick Pro3 Level 25 Order Entry8 Streamlined Order
PFM MoneyMobile. Product Overview Guide. August 2013
 PFM MoneyMobile Product Overview Guide August 2013 1 Contents MoneyMobile iphone App... 3 New Navigation Menu... 5 Accounts... 6 Transactions... 13 Excluded Transactions... 16 Spending Wheel... 17 Bubble
Spreadsheet Directions
 The Best Summer Job Offer Ever! Spreadsheet Directions Before beginning, answer questions 1 through 4. Now let s see if you made a wise choice of payment plan. Complete all the steps outlined below in
Principia Research Mode Online Basics Training Manual
 Principia Research Mode Online Basics Training Manual Welcome to Principia Research Mode Basics Course, designed to give you an overview of Principia's Research Mode capabilities. The goal of this guide
Dealing Software User Guide Version 4.1
 Main Client Screen Dealing Software User Guide Version 4.1 1 2 3 4 5 6 7 8 The main client screen of the dealing software is intuitive and ergonomic. All trading functions can be performed from the main
SINGLE-YEAR LINE-ITEM BUDGETING
 SINGLE-YEAR LINE-ITEM BUDGETING TABLE OF CONTENTS OPENING A PLAN FILE... 2 GENERAL NAVIGATION... 4 ENTERING NEW YEAR LINE-ITEM BUDGETS... 5 VIEWING HISTORICAL DATA... 6 ADDING, DELETING & MODIFYING CHARTSTRINGS...
Getting Ready to Trade
 Section VI. Getting Ready to Trade In This Section 1. Adding new securities 78 2. Updating your data 79 3. It's important to keep your data clean 80 4. Using Real-Time Alerts 81 5. Monitoring your tickers
Directions to build Stochastics & EMA Crossover search
 Directions to build Stochastics & EMA Crossover search 1. Click the UniSearch tab at the top of the program. 2. Click the drop down arrow next to the New icon. 3. Click on New Search. 4. Click in the empty
Any symbols displayed within these pages are for illustrative purposes only, and are not intended to portray any recommendation.
 PortfolioAnalyst Users' Guide October 2017 2017 Interactive Brokers LLC. All Rights Reserved Any symbols displayed within these pages are for illustrative purposes only, and are not intended to portray
Creating and Monitoring Defined Contribution Plans in Advisor Workstation
 Creating and Monitoring Defined Contribution Plans in Advisor Workstation Disclaimer - - - - - - - - - - - - - - - - - - - - - - - - - - - - - - - - - - - - - 1 Overview - - - - - - - - - - - - - - - -
An informative reference for John Carter's commonly used trading indicators.
 An informative reference for John Carter's commonly used trading indicators. At Simpler Options Stocks you will see a handful of proprietary indicators on John Carter s charts. This purpose of this guide
Notices and Disclaimer
 Part 2 March 14, 2013 Saul Seinberg Notices and Disclaimer } This is a copyrighted presentation. It may not be copied or used in whole or in part for any purpose without prior written consent from the
BUY SELL PRO. Improve Profitability & Reduce Risk with BUY SELL Pro. Ultimate BUY SELL Indicator for All Time Frames
 BUY SELL PRO Improve Profitability & Reduce Risk with BUY SELL Pro Ultimate BUY SELL Indicator for All Time Frames Risk Disclosure DISCLAIMER: Crypto, futures, stocks and options trading involves substantial
Policy. Chapter 6. Accessing the Policy. Nexsure Training Manual - CRM. In This Chapter
 Nexsure Training Manual - CRM Policy In This Chapter Accessing the Policy Adding a Thank You Letter Editing the Policy Adding, Editing and Removing Assignments Admitted Carrier Identification Summary of
Merrill Edge MarketPro Alerts
 Merrill Edge MarketPro Alerts Alerts provide notifications when market activity meets the defined criteria. TOOLBAR GUIDE 1 2 3 4 1 2 3 4 Add add a new alert Action allows an action (edit, reactivate,
+44 (0)
") FXCM Inc., a publicly traded company listed on the New York Stock Exchange (NYSE: FXCM), is a holding company and its sole asset is a controlling equity interest in FXCM Holdings, LLC. Forex Capital Markets
FXCM Inc., a publicly traded company listed on the New York Stock Exchange (NYSE: FXCM), is a holding company and its sole asset is a controlling equity interest in FXCM Holdings, LLC. Forex Capital Markets
1.1 Installation from the Web 1.2 Logging On
 1 1.1 Installation from the Web 1.2 Logging On 2.1 WH Expert Elite Display and Menu Bars 2.2 The Icon Bar 2.2.1 Icon Bar Type 1 2.2.2 Icon Bar Type 2 2.2.3 Icon Bar Type 3 2.3 Right Mouse Click Support
Top-Down Approach to Stock Selection Using AIQ's Group/Sector Capabilities
 Section III. Top-Down Approach to Stock Selection Using AIQ's Group/Sector Capabilities In This Section TradingExpert provides the tools 54 View Market Log for sector rotation 54 Next: view Group Analysis
And Training Manual. Version 1.1. P a g e 1 22
 And Training Manual Version 1.1 P a g e 1 22 Contents 1 Workspaces 3 2 Watchlist.. 5 3 Graphs.. 8 4 Order Entry 11 5 Linking Panels Together 16 6 Blotter (Positions, Trades, Orders, Order Book).. 17 7
Tutorial. Morningstar DirectSM. Quick Start Guide
 April 2008 Software Tutorial Morningstar DirectSM Quick Start Guide Table of Contents Quick Start Guide Getting Started with Morningstar Direct Defining an Investment Lineup or Watch List Generating a
Generating Defined Contribution Plan Reports in Advisor Workstation 2.0
 Generating Defined Contribution Plan Reports in Advisor Workstation 2.0 - - - - - - - - - - - - - - - - - - - - - - - - - - - - - - 1 Generating the DC Plan Status Report..............................
TELEMET ORION. Real-Time and Historic Market Data, Charts, News, Research and Portfolio Analytics. TipSheets V8.0
 TELEMET ORION Real-Time and Historic Market Data, Charts, News, Research and Portfolio Analytics TipSheets V8.0 By Telemet America, Inc. 325 First Street Alexandria, Virginia 22314 Partners with professional
INTRODUCTION CHAPTER 1
 INTRODUCTION CHAPTER 1 Autochartist offers traders automated market-scanning tools that highlight trade opportunities based on support and resistance levels. Autochartist products include: Chart pattern
Finance. Training Manual
 Finance Training Manual Introduction to Finance Module Shepherd s Staff Finance module lets you keep track of your church s financial information. This manual will walk you through setting up a chart of
Budget - By Salesperson
 Budget - By Salesperson Entering a budget is easy. Follow these five steps to get started. Version 2013.12.21.01 1 Create a template. Before you can enter a budget, you first need to create a template.
You should already have a worksheet with the Basic Plus Plan details in it as well as another plan you have chosen from ehealthinsurance.com.
 In earlier technology assignments, you identified several details of a health plan and created a table of total cost. In this technology assignment, you ll create a worksheet which calculates the total
INTERMEDIATE EDUCATION GUIDE
 INTERMEDIATE EDUCATION GUIDE CONTENTS Key Chart Patterns That Every Trader Needs To Know Continution Patterns Reversal Patterns Statistical Indicators Support And Resistance Fibonacci Retracement Moving
UBS Quotes Broad financial information and news
 UBS Online Services UBS Quotes Broad financial information and news What is UBS Quotes? UBS Quotes provides wide-ranging data and information on the global financial markets. You will find information
Contents 1. Introduction 6 2. User interface 8 General features 8 Editing your strategy 10 Context menu 13 Backtesting 15 Backtest report view 17 3.
 Contents 1. Introduction 6 2. User interface 8 General features 8 Editing your strategy 10 Context menu 13 Backtesting 15 Backtest report view 17 3. Model elements / language 19 Market information 20 Instrument
DUS DocWay TM Loan Documents User Guide. January 2019
 DUS DocWay TM Loan Documents User Guide January 2019 Table of Contents Getting Started with DUS DocWay... 1 Welcome Page Navigation... 3 Loan Documents Navigation... 6 Update Document Category and Type...
Chapter 18. Indebtedness
 Chapter 18 Indebtedness This Page Left Blank Intentionally CTAS User Manual 18-1 Indebtedness: Introduction The Indebtedness Module is designed to track an entity s indebtedness. By entering the principal
RELATIVE CURRENCY STRENGTH -ADDON-
 RELATIVE CURRENCY STRENGTH -ADDON- TABLE OF CONTENTS INSTRUCTIONS FOR PACKAGE INSTALLATION 3 USING RELATIVE CURRENCY STRENGTH (RCS) 4 PARAMETERS 4 SIGNALS 5 2 INSTRUCTIONS FOR PACKAGE INSTALLATION 1. As
QUICK START. Your Guide to Using Telemet Orion
 QUICK START Your Guide to Using Telemet Orion 1 Your Telemet investment platform is organized into Workspaces and component displays. Component displays are individual windows with market data, charts,
MYAITREND. The World s First Free AI Stock Analyst. User Guide
 MYAITREND The World s First Free AI Stock Analyst User Guide MYAITREND User Guide MyAiTrend LLC E-Mail: support@myaitrend.com Table of Contents The First Free AI Stock Analyst... 2 Three Important Principles
Central Budget Entry Munis - Financials: Central Budget Entry
 MU-FN-8-F, MU-FN-14-C Central Budget Entry Munis - Financials: Central Budget Entry CLASS DESCRIPTION This class will provide an overview of the Central Budget Entry program that is new to Munis version
Introduction to Basic Excel Functions and Formulae Note: Basic Functions Note: Function Key(s)/Input Description 1. Sum 2. Product
/Input Description 1. Sum 2. Product") Introduction to Basic Excel Functions and Formulae Excel has some very useful functions that you can use when working with formulae. This worksheet has been designed using Excel 2010 however the basic
Introduction to Basic Excel Functions and Formulae Excel has some very useful functions that you can use when working with formulae. This worksheet has been designed using Excel 2010 however the basic
Maintaining Budget Change Requests
 Maintaining Budget Change Requests This document describes the functions used in TEAMS to enter and approve requests to move funds from one General Ledger account to another. In this document: Request
Dealing Software User Guide Version 5.2
 Dealing Software User Guide Version 5.2 Main Client Screen 1 2 3 4 9 10 11 12 13 14 5 6 7 8 Main Screen - Quick Key 1. Dealing Boxes: one per currency pair; view real time bid/ask rates; click on the BUY
Any symbols displayed within these pages are for illustrative purposes only, and are not intended to portray any recommendation.
 WebTrader Users Guide December 2010 WebTrader Release 5.3 2010 Interactive Brokers LLC. All rights reserved. Any symbols displayed within these pages are for illustrative purposes only, and are not intended
The claims will appear on the list in order of Date Created. The search criteria at the top of the list will assist you in locating past claims.
 P r a c t i c e M a t e M a n u a l 63 CLAIMS/BILLING TAB Your claim submissions are managed in the Claims/Billing Tab. Claims can be printed, deleted, submitted or unsubmitted here, and rejected or failed
Fannie Mae Connect Release Notification
 Fannie Mae Connect Release Notification June 26, 2017 During the weekend of June 24, 2017, Fannie Mae will implement Fannie Mae Connect Version 7.0, which will provide a new, easy-to-use design and layout.
How to Create a Spreadsheet With Updating Stock Prices Version 2, August 2014
 How to Create a Spreadsheet With Updating Stock Prices Version 2, August 2014 by Fred Brack NOTE: In December 2014, Microsoft made changes to their portfolio services online, widely derided by users. My
BudgetPak User Guide. Lewis & Clark College. October 2016
 BudgetPak User Guide Lewis & Clark College October 2016 Contents Overview... 2 Definitions and Set Up... 2 Logging In to BudgetPak... 3 Reviewing Current and Historical Budget and Actual Information...
Client Software Feature Guide
 RIT User Guide Build 1.01 Client Software Feature Guide Introduction Welcome to the Rotman Interactive Trader 2.0 (RIT 2.0). This document assumes that you have installed the Rotman Interactive Trader
Applying fundamental & technical analysis in stock investing
 Applying fundamental & technical analysis in stock investing 2017 Live demonstration of research and trading tools Develop an Ongoing Strategy with Fidelity Software and mobile apps to enhance your trading
Trading Diary Manual. Introduction
 Trading Diary Manual Introduction Welcome, and congratulations! You ve made a wise choice by purchasing this software, and if you commit to using it regularly and consistently you will not be able but
Main Client Screen. Main Screen - Quick Key
 Main Client Screen 1 2 3 4 5 6 7 8 9 10 11 12 13 Main Screen - Quick Key 1. Dealing Boxes: one per currency pair; view real time bid/ask rates; click on the BUY or SELL to instantaneously execute a trade.
Benefit Elections Guide
 Benefit Elections Guide Revised: October 2017 Workday version 29 Note: Workday provides two updates per year and there may be slight differences between the screen shots in this guide and the actual Production
Quick Topic - Project Management Reference Guide
 Quick Topic - Project Management Reference Guide Title: Project Management Reference Guide Brief description: The purpose of this document is to act as a reference for the most common project management
GRANTEE PORTAL: Working with Proposal Budgets, to Submit
 GRANTEE PORTAL: Working with Proposal Budgets, to Submit The following will show you how to create a proposal budget and submit it to the Foundation. LOG IN TO THE GRANTEE PORTAL Please note that the Foundation
This document will provide a step-by-step tutorial of the RIT 2.0 Client interface using the Liability Trading 3 Case.
 RIT User Guide Client Software Feature Guide Rotman School of Management Introduction Welcome to Rotman Interactive Trader 2.0 (RIT 2.0). This document assumes that you have installed the Rotman Interactive
Dear Client, We appreciate your business!
 FTJ FundChoice Website Guide Page 1 Dear Client, Thank you for choosing FTJ FundChoice. This guide will assist you in managing your online account at: www.portfoliologin.com. In keeping with our mission
FMS View Expense Budget Information
 FMS View Expense Budget Information Budget Information Queries To view your operating expense budget (Fund 110) in the Financial Management System (FMS), you create a budget query with specific criteria;
Autochartist User Manual
 Autochartist User Manual compliance@ifxbrokers.com www.ifxbrokers.com +27 42 293 0353 INTRODUCTION Chapter 1 Autochartist offers traders automated market-scanning tools that highlight trade opportunities
Learning TradeStation. News, Time & Sales, Research, Browser, and Ticker Bar
 Learning TradeStation News, Time & Sales, Research, Browser, and Ticker Bar Important Information No offer or solicitation to buy or sell securities, securities derivative or futures products of any kind,
BY JIM PRINCE
 No part of this publication may be reproduced, stored in a retrieval system, or transmitted in any form or by any means electronic, mechanical, photocopying, recording, or otherwise without the prior permission
Quick Reference Guide: General Budget Change
 Quick Reference Guide: General Budget Change In the USC Kuali system, every type of transaction is created and submitted in the form of an electronic document referred to as an edoc. The Kuali Financial
Contents. Introduction
 Getting Started Introduction O&M Profiler User Guide (v6) Contents Contents... 1 Introduction... 2 Logging In... 2 Messages... 3 Options... 4 Help... 4 Home Screen... 5 System Navigation... 5 Dashboard...
OSCILLATORS. TradeSmart Education Center
 OSCILLATORS TradeSmart Education Center TABLE OF CONTENTS Oscillators Bollinger Bands... Commodity Channel Index.. Fast Stochastic... KST (Short term, Intermediate term, Long term) MACD... Momentum Relative
Contents 1. Login Layout Settings DEFAULTS CONFIRMATIONS ENVIRONMENT CHARTS
 USER GUIDE Contents 1. Login... 3 2. Layout... 4 3. Settings... 5 3.1. DEFAULTS... 5 3.2. CONFIRMATIONS... 6 3.3. ENVIRONMENT... 6 3.4. CHARTS... 7 3.5. TOOLBAR... 10 3.6. DRAWING TOOLS... 10 3.7. INDICATORS...
2002 Thomson Financial
 2002 Thomson Financial TABLE OF CONTENTS INTRODUCTION... 1 Welcome... 1 How Thomson ONE Analytics is Used... 1 Contacting Thomson Financial... 2 Getting Started... 2 Manual Conventions... 2 Logging on
StuckyNet-Link.NET User Interface Manual
 StuckyNet-Link.NET User Interface Manual Contents Introduction Technical Information General Information Logging In & Out Session Timeout Changing Your Password Working with the Borrowing Base Creating
Module 2. Dealing online
 Dealing online Module 2 Dealing online In this module we look at how to place a trade online, how to create your own price lists and other basic features of our dealing platform. TradeSense US, April 2010,
MIRROR TRADER PLATFORM FREQUENTLY ASKED QUESTIONS
 MIRROR TRADER PLATFORM FREQUENTLY ASKED QUESTIONS Page 1 FAQ Contents Questions Regarding Semi Automatic Mirroring Questions Regarding Manual Trading Questions Regarding The Automatic Mirroring General
Research Wizard: UPGRADE (March 2006) Descriptions and Screenshots
 Descriptions and Screenshots") Research Wizard: UPGRADE (March 2006) Descriptions and Screenshots Once a backtest report is run, one of the first new things you ll see is an Automatically Generated Performance Chart in the bottom right
Research Wizard: UPGRADE (March 2006) Descriptions and Screenshots Once a backtest report is run, one of the first new things you ll see is an Automatically Generated Performance Chart in the bottom right
Insurer User Manual Chapter 9: Insurer Management
 Insurer User Manual Chapter 9: Insurer Management 2017 HCAI Communications Table of Contents Chapter 9: Insurer Management General Business Rules... 4 Insurer Branch Management... 4 Adding a Branch...
MMF Investment Policy Management
 MMF Investment Policy Management Citibank Online Investments Transaction Services MMF Investment Policy Management Table of Contents Table of Contents Money Market Funds Investment Policy Management...2
TRAVEL PORTAL INSTRUCTIONS
 TRAVEL PORTAL INSTRUCTIONS Date: June 22, 2018 Version: Version 3.1 Prepared By: Berkley Canada Table of Contents 1 ACCESSING THE PORTAL... 3 1.1 LOGIN & LOGOUT... 3 1.2 RESET YOUR PASSWORD... 3 2 THE
TAA Scheduling. User s Guide
 TAA Scheduling User s Guide While every attempt is made to ensure both accuracy and completeness of information included in this document, errors can occur, and updates or improvements may be implemented
COUNT ONLINE BROKING USER GUIDE
 Welcome to the Count Online Broking website, offering market-leading functionality to help you get more from your online trading and investing: Powerful charting giving you valuable insight into client
Bethesda Training Class Notes Julia Ormond
 Bethesda Training Class Notes Julia Ormond Helpful StockFinder Keyboard Shortcuts... Keep These in Mind (Page 1 of 1) Chart Shortcuts 1 1 Day Chart TimeFrame 2 2 Day Chart TimeFrame 3 3 Day Chart TimeFrame
3. Entering transactions
 3. Entering transactions Overview of Transactions functions When you place an order to buy or short sell, you should immediately enter the transaction into the appropriate portfolio account so that the
ShelbyNext Financials: Credit Card Tracking (Course #N211)
") ShelbyNext Financials: Credit Card Tracking (Course #N211) Presented by: Dave Heston Shelby Consultant 2017 Shelby Systems, Inc. Other brand and product names are trademarks or registered trademarks of
ShelbyNext Financials: Credit Card Tracking (Course #N211) Presented by: Dave Heston Shelby Consultant 2017 Shelby Systems, Inc. Other brand and product names are trademarks or registered trademarks of
BudgetPak User Guide FY1718
 BudgetPak User Guide FY1718 Contents Overview... 2 About Your FY1718 Budget... 2 Logging In to BudgetPak... 3 Reviewing Current and Historical Budget and Actual Information... 4 Creating Your FY1718 Budget...
INVESTOR360 USER GUIDE
 INVESTOR360 USER GUIDE TABLE OF CONTENTS Logging In to Investor360 1 First-time user 1 Existing user 2 Resetting your password 3 Portfolio Tab 5 Overview 5 Holdings 9 Activity 13 Account Profile 15 Statements
Using the Merger/Exchange Wizard in Morningstar Office
 in Morningstar Office Overview - - - - - - - - - - - - - - - - - - - - - - - - - - - - - - - - - - - - - - 1 Can I use the Merger Wizard for all security types? - - - - - - - - - - - - - - - - - - 1 Can
FMS Account Summary Inquiry View Budget Information
 FMS Account Summary Inquiry View Budget Information Account Summary Inquiry The Account Summary Inquiry (ASI) in our Financial Management System (FMS) displays budget, expenditure, encumbrance, and available
SYMBOL INFO INDICATOR
 fxbluelabs.com 1. Overview... 2 2. Using the Symbol Info indicator... 3 2.1 Adding the indicator to a chart... 3 2.2 Choosing the symbol... 3 2.3 % change... 3 2.3.1 Change in pips... 4 2.4 High-low range...
How to Use Fundamental Data in TradingExpert Pro
 Chapter VII How to Use Fundamental Data in TradingExpert Pro In this chapter 1. Viewing fundamental data on the Fundamental Report 752 2. Viewing fundamental data for individual stocks 755 3. Building
User Guide to the Budget Process
 User Guide to the Budget Process 2/22/2018 Contents 1. Adaptive Insights... 2 2. Browsers... 2 3. Nomenclature... 2 4. User Security - Roles and Levels... 2 5. Logging into Adaptive Insights... 3 6. Budget
META TRADER 4 MOBILE (ANDROID) USER GUIDE MOBILE (ANDROID) USER GUIDE.
 USER GUIDE MOBILE (ANDROID) USER GUIDE.") MOBILE (ANDROID) USER GUIDE www.fxbtrading.com 1 CONTENTS Download and installation...3 Quotes...5 Chart...8 Type of orders...10 History...13 Indicators for technical analysis...14 2 MetaTrader 4 for Android
MOBILE (ANDROID) USER GUIDE www.fxbtrading.com 1 CONTENTS Download and installation...3 Quotes...5 Chart...8 Type of orders...10 History...13 Indicators for technical analysis...14 2 MetaTrader 4 for Android
Product Eligibility and Pricing Services. Loan Originator User Guide
 Product Eligibility and Pricing Services Loan Originator User Guide Table of Contents Table of Contents Log In... 1 Enter New Loan Data... 1 Evaluate Products... 6 Analyze Search Results... 6 Update Search
ZNET Android Manual for SmartPhone
 ZNET Android Manual for SmartPhone ZNET Android OS Real-Time Trading Program "ZNET Android" is the stock real time trading program developed by KTZMICO Company limited. You are able to view real time stock
HPE Project and Portfolio Management Center
 HPE Project and Portfolio Management Center Software Version: 9.41 Financial Management User's Guide Go to HELP CENTER ONLINE http://ppm-help.saas.hpe.com Document Release Date: March 2017 Software Release
Part 5. Quotes Application. Quotes 691
 Part 5. Quotes Application Quotes 691 692 AIQ TradingExpert Pro User Manual Quotes Application In This Section Overview 694 Getting Started 695 News headline monitor 696 The quotes monitor 697 Quotes 693