MYAITREND. The World s First Free AI Stock Analyst. User Guide
|
|
|
- Matthew Brett Hardy
- 5 years ago
- Views:
Transcription
1 MYAITREND The World s First Free AI Stock Analyst User Guide
2 MYAITREND User Guide MyAiTrend LLC
3 Table of Contents The First Free AI Stock Analyst... 2 Three Important Principles when using MyAiTrend... 2 MyAiTrend Application... 4 MyAiTrend Main Screen... 4 Recent Viewed Quote... 6 Stock Lookup... 6 The Stock and Quote Screen... 7 Mouse Overlay to View Historical Data... 8 MyAiTrend Indicators... 9 MyAiTrend Indicator... 9 MyAiTrend Color Indicator Momentum Performance Meter MyAiTrend Historical Data Power of MyAiTrend Chart Analysis Made Simple Create Custom Portfolios Creating a Custom Portfolio Creating a Portfolio Name and Funding How to Add Stocks to MyAiTrend How to Add Shares to the Symbol in your Portfolio How to View and Delete a Portfolio Create Custom Watchlist Login or Create a MyAiTrend Account How to Add a Stock to your Watchlist How to Access the Watchlist How to Delete a Stock from Watchlist... 29
4 Chapter 1 The First Free Stock Analyst F or more than a century, ever since Charles Dow created the Dow Jones Industrial Index and the Dow Theory. People have been trying to perfect a unique method to stock analysis using various methodology, theories and indicators such as RSI, MACD, Stochastic oscillator, Bollinger Bands, Fibonacci retracement, and etc. Up until now, a new and unique methodology was created, the MyAiTrend (MAT) Methodology. MyAiTrend's (MAT) Methodology is focuses on technical analysis utilizing a proprietary methodology which analyzes all stocks using Artificial Intelligence to systematically perform a predictive analysis on the historical, current and future trend of the stock. Using a rigorous analytics process, MyAiTrend creates an easy to read graph comprised of the stock's current and future development stages with technical and fundamental indicators, highlighting optimal entry and exit points, allowing the user to capture the most alpha in every stock. The MAT Methodology's proprietary algorithm/theory is what sets MyAiTrend apart from the rest of the stock analysis applications. We believe we have found "the algorithm" for autonomous stock analysis. MyAiTrend understands the obstacles each retail investor faces when they have no direct access to professional technical analysis nor do they have the time and resources to learn how to read the dozens of chart, technical indicators and patterns. With MyAiTrend, you will be able to quickly learn how to analyze stocks and reach your own conclusion similar to professional analysts. MyAiTrend is simple to use. The goal is to help you make smarter choices and invest more intelligently. 2
5 Three Important Principles when using MyAiTrend Spot and Follow the Trends MyAiTrend does all the heavy lifting and helps you map out the trends in three different color schemas: Green - Down Trend, Yellow - Sideway and Red - Up Trend. Make sure you trade in the direction of that trend. Please note, since MyAiTrend is unique, our trend colors are different then what you may have accustom to. Look for the Up and Down Arrow Indicator Look and follow the indicators for optimal entry and exit points. For example if you want to buy, look for stocks that have the up arrow and a sideway trend, this indicates the stock is "likely" to gain momentum and a rise in price. The best place to buy is when you see the Up Arrow and sell when you see the Down Arrow. The arrows and color backdrop shades shows you the overall trend of the stock and the "likely" direction it is heading. A Game Plan It is important to develop your own strategy or game plan that is consistent with your goals (goals should center on risk and return). The penultimate goal is to make money, but how much or what percentage do you have in mind? What make a successful trader are discipline and patience, the expected return and desired risk. MyAiTrend can provide the ability to manage your expectations and can provide you the informed insights to help make your smarter and invest intelligently. 3
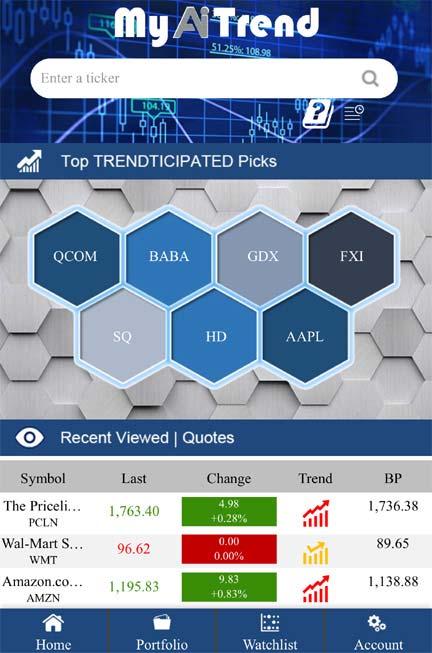
6 Chapter 2 MyAiTrend Application How to use MyAiTrend M yaitrend is simple to use, users can access MyAiTrend from any device which has a web browser, soon MyAiTrend can be directly accessible from WeChat and Facebook. MyAiTrend is optimized for mobile devices given that people are always on the go and mobility is an important part of their daily lives. MyAiTrend Main Screen The main screen of MyAiTrend has three sections: The Search Bar Top TRENDTICIPATED Picks Recent Viewed Quotes Search Bar: The Search Bar appears in every MyAiTrend Screens, it is where you can search up a stock. Top TRENDTICIPATED Picks: The TRENDTICIPATED Picks are hot picks selected by MyAiTrend; these are the stocks which MyAiTrend believe has the optimum momentum to move higher. Recent Viewed Quotes: The Recent View Quotes are a list of stocks which you have recently viewed and can store up to 8 stocks and will subsequently delete the last one when new stocks are viewed. The list will be saved to your account and when you login it will retrieve the last 8 stocks which you have looked at. 4
7 5
 Change - On the top is the change amount and the bottom the percentage change for the day Trend - The current trend of the stock BP - The Break Point price")
8 Recent Viewed Quote In the Recent Viewed Quotes dialog box you will see the following columns: Symbol - The name of the company on top and the symbol/ticker on the bottom Last - Last Price of the Stock (This will refresh every 20 seconds) Change - On the top is the change amount and the bottom the percentage change for the day Trend - The current trend of the stock BP - The Break Point price Stock Lookup To search for a stock, all you need to do is to enter the symbol or the name of the company and a list of stocks will appear. Select the one you want to retrieve. 6
9 The Stock and Quote Screen When you select a stock to view, the following dataset are available. The market data updates automatically every 20 seconds in real-time Market Data Company Name - Below the company name is the last price along with the day's dollar change and percentage change Open - Day's Opening Price High - Day's High Low - Day's Low Date - Trade Date Volume - Day's Trading Volume Overall Trend Green Shades - Down Trend Yellow Shades - Sideway (Gradual start of the uptrend) Red Shades - Up Trend 7
10 Mouse Overlay to View Historical Data To view the historical data of the stock, click on the volume bar below the trade date and an overlay will appear with the historical pricing. 8
11 M YAITREN D USER GUIDE Chapt ter 3 MyAiT Trend Indicators How to read and use the MyAiTrend indicators T he MyAiTrend (MAT) Methodology is a method of stock analysis which utilizes a proprietary algorithm/ /theory and Artificial Intelligence to predict the movement of stocks. In this section, we will show you how to read the MyAiTrend indicators. The Indicators are designed to be easy to read and interpreted. By the end of this section, you should have a good sense on how to form your own analysis on the charts and datasets, keep in mind thatt it takes practice to confidently understand the MyAiTrend (MAT) Methodology. However, MyAiTrend is designed to be ease of use, if you don't want to get into the technical details, just follow the indicators. In MyAiTrend, there are two indicators and 3 color patterns which predict the trend of the stock. The indicators and color patterns provides the indicative status of the stock and predictive future movement. MyAiTre end Indicator The down blue arrow indicator signals the start of the down trend of the stock or the end of the uptrend, when this indicator appears, MyAiTrend is signaling the start of the down trend of the stock or the decrease in stock price. In the free version of MyAiTrend, where applicable, the indicator will appear at the end of the trading day signaling the change in trend. Down Trend Indicator 9
12 M YAITREN D USER GUIDE The Up yellow arrow indicator signals the start of the uptrend of the stock, when this indicator appears; MyAiTrend is signaling the start of the uptrend of the stock or the gradual rise in stock price. In the free version of MyAiTrend, where applicable, the indicator will appear at the end of the trading day signaling the change in trend. Up Trend Indicator MyAiTre end Colo or Indicator In each stock chart, there are 3 color indicators embedded into the chart, each color indicator signals the trend of the price. Please note, since MyAiTrend is unique, the color patterns are different than most common charting software. Green Shades - Down Trend Yellow Shades - Sideway (Gradual start of the uptrend) Red Shades - Up Trend Unlike other commonly used theories or methodologies whereby pattern formation in different degrees represents a specific trend or wave structure. MyAiTrend made it simple for users to understand and interpret. For example, the chart below shows the various indicator and momentum shades of the stock. In this example, on October 12th 2018, a yellow uptrend indicatorr appears along with the yellow shades, this indicates the end of the downtrend of the stock and the start of the sideway or gradual increase the stock price. At this point the user who wants to purchase the stock can start thinking about the entry point or wait for further price movements and signals from MyAiTrend. 10

13 To help better understand the current momentum of the trend, MyAiTrend provides 2 additional indicators which will help guide you through the stock momentum process and enable you to make a better investment decision. The Overall Trend or MyAiTrend Momentum Indicator indicates the current momentum of the stock, this indicator coincides with the momentum performance meter on the top right of the stock price Down Trend - When the momentum performance meter points to green, this indicates the stock is in a down trend and the stock price is starting to fall. Sideway - When the momentum performance meter points to yellow, this indicates the end of the down trend and that the stock is starting or about to rise. Up Trend - When the momentum performance meter points to red, this indicates the stock is in an uptrend and have surpassed the sideway stage and is in a stage whereby the prices will increase. 11


14 M YAITREN D USER GUIDE Moment tum Perf formanc ce Meter The Momentum Performance Meter onn the upper right hand corner of the daily stock price indicates the current momentum/t trend of the stock. Green Shades - Down Trend Yellow Shades - Sideway (Gradual start of the uptrend) Red Shades - Up Trend MyAiTre end Histo orical Data Using MyAiTrend, you can also look up the stocks historical data so that you can analyze the various price points for eachh respective trade date. Simply click on the bar below the trade date in the chart and it will display the trade date, open, high, low, close and trading volume. 12
15 M YAITREN D USER GUIDE Chapt ter 4 Power of MyAiTre end Unleash the power of MyAiTrend M yaitrend made it simple forr users to read and interpret charts and trend of the stocks, it's like havingg your own personal technical analyst. With MyAiTrend you do not have to understand how to read the charts and all the various technical indicators including history, formation and key patterns. MyAiTrend's proprietary methodology/algorithm and Artificial Intelligence optimizes the dataset for you, all you need to know is two indicators (Overall Trend and Up and Down Indicator) and then you can draw your own conclusion on what is best for you. Technical analysis is by no means easy. Success requires serious study, dedication, and an open mind. However with MyAiTrend, we made it simple by cutting the cords on all the nuances and provide you with the most optimized dataset. Chart Analysis Made Simple In this section we will show you how to read the chart of Amazon using the MyAiTrend indicators. In each of the Amazon stock chart, there are 3 color indicators embedded into the chart, some stocks may only have 1 color depending on the stock's trend, each color indicator signals the status of the stock price. Green Shades - Down Trend Yellow Shades - Sideway (Gradual start of the uptrend) Red Shades - Up Trend Remember the two indicators which you will need color indicator. to look for is the arrow and Using a proprietary methodology/algorithms and Artificial Intelligence, MyAiTrend can help investors anticipate what is "likely" to happen to prices over time. Below are 13
16 some examples on how MyAiTrend works and the key indicators which you should look out for. Overall Trend: The first step is to identify the overall trend of the stock. This can be accomplished by looking at the color of the backdrop. For example, the current trend for Amazon as of November 24 th 2017 is up and the color indicator is red. This means that Amazon is currently on an Up Trend and can move higher, however a pullback may be imminent depending on future advances. MyAiTrend will provide a signal utilizing the up and down arrow if it believes the trend will change using predictive analytics. In the free version of MyAiTrend, where applicable, the up and down indicator will appear after the close of the trading day The Arrows: The second step is to identify the current breakup and breakdown price of the stock. This can be accomplished by looking for the up and down arrow. For example, there is no arrow indicator for Amazon as of November 24 th This means Amazon is still in an Up Trend and the price of Amazon has a greater chance of moving higher. If a down arrow appears, then it means the stock is heading toward a down trend or decrease in stock price. Examples to follow will show you more on how this occurs. 14

17 Overall Trend: Looking at the mouse overlay on October 4 th 2017 for Amazon, the current trend is yellow or sideway (gradual start of the uptrend). This means that the price for Amazon has a high potential to rise and can move higher into an Up Trend. Look for the MyAiTrend up and down arrow to see if this is the start of the Sideway. In the free version of MyAiTrend, where applicable, the up and down indicator will appear after the close of the trading day. The Arrows: Looking at the mouse overlay on October 4 th 2017 for Amazon, the Up Arrow appears and in conjunction with the yellow color shaded backdrop, it means Amazon has moved from a Down Trend to Sideway or a gradual progression into an Up Trend state. This means Amazon's stock price is "likely" to move higher with a low risk of a pullback. Takeaway: When you see a yellow color shaded backdrop or Sideway Trend and an Up Arrow Indicator, it means that the stock is "likely" poised to move higher and is in the gradual mist of an Up Trend. If you are interested in buying Amazon, this is the optimal entry point. Looking further into the chart, we can see that Amazon's price continued to trend higher after the Up Arrow indicator and entered into an Up Trend on October 12 th
18 Overall Trend: Looking at the mouse overlay on October 18 th 2017 for Amazon, the backdrop color turned green, indicating a Down Trend for Amazon. This means that the price for Amazon has a high potential to fall. Look for the MyAiTrend up and down arrow to see if this is the start of the Down Trend. In the free version of MyAiTrend, where applicable, the up and down indicator will appear after the close of the trading day. The Arrows: Looking at the mouse overlay on October 18 th 2017 for Amazon, the Down Arrow appears and in conjunction with the green color shaded backdrop, it means Amazon has moved from an Up Trend to Down Trend or a gradual progression into a Down Trend state. This means Amazon's stock price is "likely" to move lower with a high risk of a pullback. Takeaway: When you see a green color shaded backdrop or Down Trend and a Down Arrow Indicator, it means that the stock is "likely" poised to move lower and is in the gradual mist of a Down Trend. If you previous brought Amazon and are looking to take profit or sell it, then this may be the optimum exit point. Looking further into the chart, we can see that Amazon's price continued to move lower the next couple of days after the Down Arrow indicator appeared and entered into a Down Trend on October 18 th 2017 and continue on until October 27 th 2017 until the trend changes. 16
19 Overall Trend: Looking at the mouse overlay on October 27 th 2017 for Amazon, the backdrop color turned yellow, indicating a gradual end of the Down Trend for Amazon and into a Sideway (gradual start of the uptrend) Trend. This means that the price for Amazon has a high potential to rise and can move higher into an Up Trend. Look for the MyAiTrend up and down arrow to see if this is the start of the Sideway. In the free version of MyAiTrend, where applicable, the up and down indicator will appear after the close of the trading day. The Arrows: Looking at the mouse overlay on October 27 th 2017 for Amazon, the Up Arrow appears and in conjunction with the yellow color shaded backdrop, it means Amazon has moved from a Down Trend to Sideway or a gradual progression into an Up Trend state. This means Amazon's stock price is "likely" to move higher with a low risk of a pullback. Takeaway: When you see a yellow color shaded backdrop or Sideway Trend and an Up Arrow Indicator, it means that the stock is "likely" poised to move higher and is in the gradual mist of an Up Trend. If you are interested in buying Amazon, this is the optimal entry point. Looking further into the chart, we can see that Amazon's price continued to trend higher after the Up Arrow indicator and entered into an Up Trend on November 3 rd The price of Amazon continued to trend higher over the days after it entered into an Up Trend. 17
20 Chapter 5 Create Custom Portfolios How to create custom portfolios M yaitrend enables user to create and track their own personal Portfolio, they can also use this feature to practice investing. The custom portfolio feature is designed much like a game whereby user can allocate a specific amount of money to the portfolio and track the stocks performances. Creating a Custom Portfolio How to Create a Custom Portfolio Click on the Portfolio icon on the menu bar In the Portfolio Screen, click on Add Portfolio 18

21 Creating a Portfolio Name and Funding How to Create a Portfolio Name and Funding In the Portfolio Name dialog box, enter the name of the Portfolio you want to create In the Initial Cash dialog box, enter the cash you want to setup for the portfolio, by default $1,000,000 will be set as the default Initial Cash. This is the total buying power of your portfolio Once you are done, hit Create to create the portfolio In this example, MyAiTrend will create the portfolio with an initial cash of $1,000,000 19

22 How to Add Stocks and/or your Personal Holdings from your Brokerage Account to MyAiTrend MyAiTrend allows you to manually add your stock and/or holdings from your personal brokerage accounts so that you can use MyAiTrend to track your stock performance and trends. You can create as many portfolios as you desire. To add stocks into the portfolio: Click on the green magnifying glass next to the portfolio name A drop down box will appear, from there click on Add Stock 20

23 In the Add Stock's dialog box, enter the company's ticker. In this example we enter BAC and selected Bank of America 21

24 Click on the plus sign next to BAC to add BAC Bank of America to your Portfolio To add more symbols, click on Add Symbol 22

25 How to Add Shares to the Symbol in your Portfolio Once you add the symbol to your portfolio, you will now need to state whether you bought or sold the stock. To add stock information into the portfolio: Click on the green magnifying glass next to the company name A drop down box will appear, from there click on either Buy, Sell or Remove In this example, we will be entering a Buy for Bank of America (BAC), presumably you brought it from your brokerage account A Buy Stock Detail dialog box will appear. Enter the Price which you had purchased and the number of Shares 23

26 Once the information is entered in, click on Buy to store the transaction You will be able to see the trade details along with the P&L in the stock summary 24

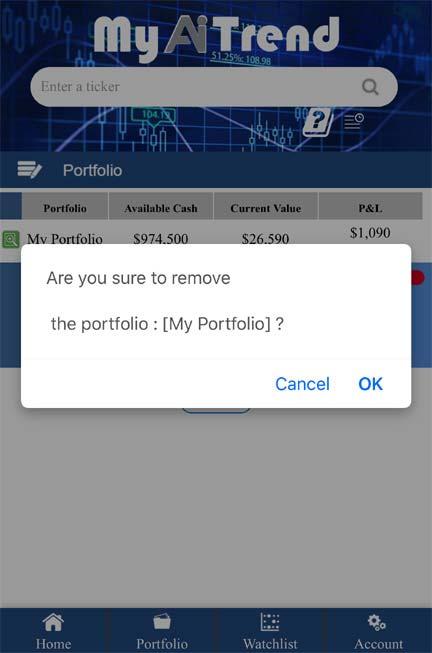
27 How to View and Delete a Portfolio How to View and Delete a Portfolio You can view the stocks in the portfolio by clicking on the View icon To delete the portfolio, click on the Remove icon and MyAiTrend will prompt you to confirm the deletion. Please note that once the portfolio is deleted, it is deleted from the system 25
28 26

29 Chapter 6 Create Custom Watchlist How to create custom watchlist M yaitrend made it simple for users to create their own personal watchlist. In this section we will show you how to create and modify your own personal watchlist. Login or Create a MyAiTrend Account Before you can create and save your own personal watchlist, you will need to create an account in MyAiTrend and then login. Follow the MyAiTrend AI Robot and it will show you how to create your own login. 27

30 How to Add a Stock to your Watchlist Once you login in to MyAiTrend, you can simply add the stock to your watchlist by pulling up the stock you want i.e. Amazon, click on the +Watch icon below the momentum performance meter to add Amazon to your watchlist. Once the symbol is added you will see a check mark next to the Watch icon. 28


31 How to Access the Watchlist You can bring up the Watchlist by either clicking on the Watchlist icon on the menu bar or click on the paper icon below the search bar. How to Delete a Stock from Watchlist To delete a stock from the Watchlist, first launch the watchlist, in the upper right hand corner click on the EDIT button. To delete the stock click on the X and it will delete the stock from your watchlist. 29
StockFinder Workbook. Fast and flexible sorting and rule-based scanning. Charting with the largest selection of indicators available
 StockFinder Workbook revised Apr 23, 2009 Charting with the largest selection of indicators available Fast and flexible sorting and rule-based scanning Everything you need to make your own decisions StockFinder
BY JIM PRINCE
 No part of this publication may be reproduced, stored in a retrieval system, or transmitted in any form or by any means electronic, mechanical, photocopying, recording, or otherwise without the prior permission
Money Management (MX) Frequently Asked Question s
 Frequently Asked Question s") Money Management (MX) Frequently Asked Question s Account Maintenance How do I get rid of duplicate accounts? How do I permanently delete an account? How do I hide/exclude an account? How do I rename my
Money Management (MX) Frequently Asked Question s Account Maintenance How do I get rid of duplicate accounts? How do I permanently delete an account? How do I hide/exclude an account? How do I rename my
Contents 1. Login Layout Settings DEFAULTS CONFIRMATIONS ENVIRONMENT CHARTS
 USER GUIDE Contents 1. Login... 3 2. Layout... 4 3. Settings... 5 3.1. DEFAULTS... 5 3.2. CONFIRMATIONS... 6 3.3. ENVIRONMENT... 6 3.4. CHARTS... 7 3.5. TOOLBAR... 10 3.6. DRAWING TOOLS... 10 3.7. INDICATORS...
Gtrade manual version 2.04 updated
 Gtrade manual version 2.04 updated 9.30.2016 Table of Contents Contents Table of Contents2 Getting started, Logging in and setting display language in TurboTick Pro3 Level 25 Order Entry8 Streamlined Order
HedgeTools User Manual
 HedgeTools User Manual A real-time monitoring and analysis of the stocks on the NYSE and NASDQ exchanges Last update: August 29, 2018 Charles Brauer Cypress Point Technologies, LLC Carmel, California 93923
Online Trading User Guide
 Online Trading User Guide Monex Securities Australia Pty Ltd AFSL No: 363972 ABN: 84 142 210 179 Registered Office: Level 2 - The Bond, 36 Hickson Road Sydney NSW 2000 About This Guide This guide takes
Dealing Software User Guide Version 4.1
 Main Client Screen Dealing Software User Guide Version 4.1 1 2 3 4 5 6 7 8 The main client screen of the dealing software is intuitive and ergonomic. All trading functions can be performed from the main
StockFinder 5 Workbook
 StockFinder 5 Workbook Updated Februar y 2010 STOCKFINDER 5 WORKBOOK Worden Brothers, Inc. www.worden.com Five Oaks Office Park 4905 Pine Cone Drive Durham, NC 27707 STOCKFINDER 5 WORKBOOK 2010 Worden
PFM MoneyMobile. Product Overview Guide. August 2013
 PFM MoneyMobile Product Overview Guide August 2013 1 Contents MoneyMobile iphone App... 3 New Navigation Menu... 5 Accounts... 6 Transactions... 13 Excluded Transactions... 16 Spending Wheel... 17 Bubble
Trading Diary Manual. Introduction
 Trading Diary Manual Introduction Welcome, and congratulations! You ve made a wise choice by purchasing this software, and if you commit to using it regularly and consistently you will not be able but
Top-Down Approach to Stock Selection Using AIQ's Group/Sector Capabilities
 Section III. Top-Down Approach to Stock Selection Using AIQ's Group/Sector Capabilities In This Section TradingExpert provides the tools 54 View Market Log for sector rotation 54 Next: view Group Analysis
Finance Manager: Budgeting
 : Budgeting Overview is a module that facilitates the preparation, management, and analysis of fiscal year budgets. Streamlined for efficiency and designed to solve the cumbersome process of budget creation,
QUICK START. Your Guide to Using Telemet Orion
 QUICK START Your Guide to Using Telemet Orion 1 Your Telemet investment platform is organized into Workspaces and component displays. Component displays are individual windows with market data, charts,
TRADE SIGNALS POWERED BY AUTOCHARTIST
 SAXO TRADER GO TRADE SIGNALS POWERED BY AUTOCHARTIST Trade Signals is a SaxoTraderGO tool that uses Autochartist technology to identify emerging and completed patterns in most leading financial markets.
TRADE SIGNALS POWERED BY AUTOCHARTIST
 SAXO TRADER GO TRADE SIGNALS POWERED BY AUTOCHARTIST Trade Signals is a SaxoTraderGO tool that uses Autochartist technology to identify emerging and completed patterns in most leading financial markets.
Learning TradeStation. Order-Entry Tools and Preferences
 Learning TradeStation Order-Entry Tools and Preferences Important Information No offer or solicitation to buy or sell securities, securities derivative or futures products of any kind, or any type of trading
ZNET Android Manual for SmartPhone
 ZNET Android Manual for SmartPhone ZNET Android OS Real-Time Trading Program "ZNET Android" is the stock real time trading program developed by KTZMICO Company limited. You are able to view real time stock
Learning TradeStation. News, Time & Sales, Research, Browser, and Ticker Bar
 Learning TradeStation News, Time & Sales, Research, Browser, and Ticker Bar Important Information No offer or solicitation to buy or sell securities, securities derivative or futures products of any kind,
The Trifecta Guide to Technical Analysis 1
 The Trifecta Guide to Technical Analysis 1 No trading system is bullet-proof. The list of factors that can impact a stock s share price is long and growing from investor sentiment to economic growth to
TRADE SIGNALS POWERED BY AUTOCHARTIST
 SAXO TRADER GO TRADE SIGNALS POWERED BY AUTOCHARTIST Trade Signals is a SaxoTraderGO tool that uses Autochartist technology to identify emerging and completed patterns in most leading financial markets.
Your Wealth Management Portal
 Your Wealth Management Portal As part of your Wealth Management Service, you have a personal secure electronic document vault located on a secure server and accessed exclusively through your Wealth Management
ENROLLMENT HELP GUIDE
 ENROLLMENT HELP GUIDE This enrollment guide will assist you through some of the navigation and selections in the enrollment system. Navigation / Help Use the Continue button in the lower right corner to
Schwab Investing Insights Trading Edition Text Close Window Size: November 15, 2007
 Schwab Investing Insights Trading Edition Text Close Window Size: from TheStreet.com November 15, 2007 ON TECHNIQUES Two Indicators Are Better Than One The Relative Strength Index works well but it s better
3. Entering transactions
 3. Entering transactions Overview of Transactions functions When you place an order to buy or short sell, you should immediately enter the transaction into the appropriate portfolio account so that the
Issue Selection The ideal issue to trade
 6 Issue Selection The ideal issue to trade has several characteristics: 1. There is enough data to allow us to model its behavior. 2. The price is reasonable throughout its history. 3. There is sufficient
Creating a Standard AssetMatch Proposal in Advisor Workstation 2.0
 Creating a Standard AssetMatch Proposal in Advisor Workstation 2.0 - - - - - - - - - - - - - - - - - - - - - - - - - - - - - - - - - - - - - - 1 What you will learn - - - - - - - - - - - - - - - - - -
END OF DAY DATA CORPORATION. Scanning the Market. using Stock Filter. Randal Harisch 2/27/2011
 END OF DAY DATA CORPORATION Scanning the Market using Stock Filter Randal Harisch 2/27/2011 EOD's Stock Filter tool quickly searches your database, identifying stocks meeting your criteria. The results
Any symbols displayed within these pages are for illustrative purposes only, and are not intended to portray any recommendation.
 PortfolioAnalyst Users' Guide October 2017 2017 Interactive Brokers LLC. All Rights Reserved Any symbols displayed within these pages are for illustrative purposes only, and are not intended to portray
Stock Forecast Toolbox
 Stock Forecast Toolbox An institutional-grade tool for the self-directed trader Overview The Stock Forecast Toolbox is at the core of our research platform. This toolset delivers highly accurate forecasts
TRADE SIGNALS POWERED BY AUTOCHARTIST
 TRADE SIGNALS POWERED BY AUTOCHARTIST Trade Signals is a powerful tool available in BiGlobal Trade for identifying trading opportunities based on chart patterns using Autochartist technology. As an introduction
Turning Points Analyzer
 Turning Points Analyzer General Idea Easy Start Going into Depth Astronomical Model Options General Idea The main idea of this module is finding the price levels where the price movement changes its trend.
Security Guessing. Custom Watchlist. Broadcasting. Other Widgets. Portfolio Summary Tab. Placing Trades. Portfolio Widget. Portfolio List View
 Table of Contents Introduction Market Summary Tab Market Summary Widgets Watchlist Widgets Explained Market Map News Chart Help Centre Stock Summary Tab Security Guessing Custom Watchlist Broadcasting
An informative reference for John Carter's commonly used trading indicators.
 An informative reference for John Carter's commonly used trading indicators. At Simpler Options Stocks you will see a handful of proprietary indicators on John Carter s charts. This purpose of this guide
PVCC S STRATEGIC PLANNING ONLINE SYSTEM (SPOL)
") PVCC S STRATEGIC PLANNING ONLINE SYSTEM (SPOL) Strategic Planning Online (SPOL) is a web based software solution specifically designed to help institutions automate the planning and budgeting process.
PVCC S STRATEGIC PLANNING ONLINE SYSTEM (SPOL) Strategic Planning Online (SPOL) is a web based software solution specifically designed to help institutions automate the planning and budgeting process.
PHILLIP FUTURES PTA. POEMS Installation and Quick Start User Guideline
 PHILLIP FUTURES PTA POEMS 1.8.3 Installation and Quick Start User Guideline NOTICE The best effort has been put in to ensure that the information given in this POEMS Professional 1.8.3 Quick Start User
IVGraph Live Service Contents
 IVGraph Live Service Contents Introduction... 2 Getting Started... 2 User Interface... 3 Main menu... 3 Toolbar... 4 Application settings... 5 Working with layouts... 5 Working with tabs and viewports...
How to Use Fundamental Data in TradingExpert Pro
 Chapter VII How to Use Fundamental Data in TradingExpert Pro In this chapter 1. Viewing fundamental data on the Fundamental Report 752 2. Viewing fundamental data for individual stocks 755 3. Building
Main Client Screen. Main Screen - Quick Key
 Main Client Screen 1 2 3 4 5 6 7 8 9 10 11 12 13 Main Screen - Quick Key 1. Dealing Boxes: one per currency pair; view real time bid/ask rates; click on the BUY or SELL to instantaneously execute a trade.
With that, let s dive into the steps. Step 1 Identify range bound markets on Daily or 4 Hour Charts
 If you have been trading for any length of time, you have probably noticed that the markets are moving sideways A LOT. Consolidation is a huge part of the market s balance and so it makes sense to learn
Adaptive Oscillator for TradeStation
 1 Adaptive Oscillator for TradeStation PZT PROOF is an adaptive oscillator based on a statistical range of price action. Similar to a stochastic indicator, it creates values by comparing the distance between
GuruFocus User Manual: My Portfolios
 GuruFocus User Manual: My Portfolios 2018 version 1 Contents 1. Introduction to User Portfolios a. The User Portfolio b. Accessing My Portfolios 2. The My Portfolios Header a. Creating Portfolios b. Importing
Individual Taxpayer Electronic Filing Instructions
 Individual Taxpayer Electronic Filing Instructions Table of Contents INDIVIDUAL TAXPAYER ELECTRONIC FILING OVERVIEW... 3 SUPPORTED BROWSERS... 3 PAGE AND NAVIGATION OVERVIEW... 4 BUTTONS AND ICONS... 5
Finance. Training Manual
 Finance Training Manual Introduction to Finance Module Shepherd s Staff Finance module lets you keep track of your church s financial information. This manual will walk you through setting up a chart of
Contents. Introduction
 Getting Started Introduction O&M Profiler User Guide (v6) Contents Contents... 1 Introduction... 2 Logging In... 2 Messages... 3 Options... 4 Help... 4 Home Screen... 5 System Navigation... 5 Dashboard...
A unique trading tool designed to help traders visualize and place orders based on market depth and order flow. DepthFinder TradingApp
 A unique trading tool designed to help traders visualize and place orders based on market depth and order flow. DepthFinder TradingApp DepthFinder Trading App for TradeStation Table of Contents Introduction
Ez Trading Platform. Alltogether, traders are able to perform a more comprehensive probability analysis of their trades.
 Ez Trading Platform The Ez Trading Platform contains a robust set of tools built from the ground up to allow traders to take advantage of a new methodology in calculating probability that we call Probability
TRADING CFDs ON THE itradego PLATFORM
 TRADING CFDs ON THE itradego PLATFORM The Vineyards Office Estate, Farm 1 99 Jip de Jager Drive, Welgemoed Cape Town 7530 Private Bag x8 / Tygervalley 7536 South Africa 0219502879 cfd@sanlamitrade.co.za
Commsec Adviser Services User Guide
 Commsec Adviser Services User Guide Welcome to the CommSec Adviser Services trading website, offering market-leading functionality to help you get more from your online trading and investing: Powerful
Aliceblue Mobile App. User Manual
 Aliceblue Mobile App User Manual Introduction Aliceblue Mobile Application gives the Investor Clients of the Brokerage House the convenience of secure and real time access to quotes and trading. The services
GL Budgets. Account Budget and Forecast. Account Budgets and Forecasts Menu
 Account Budget and Forecast The Account Budget and Forecast function allows you to enter and maintain an unlimited number of budgets and/or forecasts values and types. When setting up the account budgets
Table of Contents. Risk Disclosure. Things we will be going over. 2 Most Common Chart Layouts Anatomy of a candlestick.
 Table of Contents Risk Disclosure Things we will be going over 2 Most Common Chart Layouts Anatomy of a candlestick Candlestick chart Anatomy of a BAR PLOT Indicators Trend-Lines Volume MACD RSI The Stochastic
Data Integration with Albridge Solutions and Advisor Workstation 2.0
 Data Integration with Albridge Solutions and Advisor Workstation 2.0 This document explains how to import both portfolios and core accounts from Albridge into Morningstar s Advisor Workstation 2.0. Overview
Trader Manual Welcome to the exciting world of binary options trading!
 Trader Manual Welcome to the exciting world of binary options trading! This manual will explain exactly what binary options are, how to trade them and acquaint you with our website. If you have any questions
TRADE SIGNALS POWERED BY AUTOCHARTIST
 SAXO TRADER GO TRADE SIGNALS POWERED BY AUTOCHARTIST Trade Signals is a SaxoTraderGO tool that uses Autochartist technology to identify emerging and completed patterns in most leading financial markets.
INTRODUCTION CHAPTER 1
 INTRODUCTION CHAPTER 1 Autochartist offers traders automated market-scanning tools that highlight trade opportunities based on support and resistance levels. Autochartist products include: Chart pattern
Dear Client, We appreciate your business!
 FTJ FundChoice Website Guide Page 1 Dear Client, Thank you for choosing FTJ FundChoice. This guide will assist you in managing your online account at: www.portfoliologin.com. In keeping with our mission
Claims. Chapter 11. Adding a Claim. HOW to Add a Claim. Nexsure Training Manual - CRM. In This Chapter
 Nexsure Training Manual - CRM Claims In This Chapter Adding a Claim Populating the Claim form Tracking the Claim Delivering the Claim form Closing and Reopening the Claim Adding a Claim When a claim is
Using the Clients & Portfolios Module in Advisor Workstation
 Using the Clients & Portfolios Module in Advisor Workstation Disclaimer - - - - - - - - - - - - - - - - - - - - - - - - - - - - - - - - - - - - - 1 Overview - - - - - - - - - - - - - - - - - - - - - -
Trading the Hidden Divergence. Presented by Sunil Mangwani
 Trading the Hidden Divergence Indicators in technical analysis. Indicators along with chart patterns, trend lines, resistance / support levels etc., are an essential part of technical analysis. But there
Portfolio Manager. Chapter VI. In this Chapter
 Chapter VI. Portfolio Manager In this Chapter The Portfolio Manager is TradingExpert Pro s portfolio tracking and management application. One of its important features is an easy to use stop system. Portfolio
Qualify Your Instruments & Find High Probability Setups
 +1.888.537.0070 x 750 support@marketprofilescan.com www.marketprofilescan.com TAS knows the value of accurate and timely market generated information. Providing high probability trading setups is our business.
If you have traded forex long enough, you will notice that sometimes, price has an uncanny ability to reverse exactly at or around fibonacci levels.
 Fibonacci Forex Trading Strategy With Reversal Candlesticks The Fibonacci forex trading strategy with reversal candlesticks is simply about using fibonacci retracements in conjunction with reversal candlesticks.
+44 (0)
") FXCM Inc., a publicly traded company listed on the New York Stock Exchange (NYSE: FXCM), is a holding company and its sole asset is a controlling equity interest in FXCM Holdings, LLC. Forex Capital Markets
FXCM Inc., a publicly traded company listed on the New York Stock Exchange (NYSE: FXCM), is a holding company and its sole asset is a controlling equity interest in FXCM Holdings, LLC. Forex Capital Markets
Part 5. Quotes Application. Quotes 691
 Part 5. Quotes Application Quotes 691 692 AIQ TradingExpert Pro User Manual Quotes Application In This Section Overview 694 Getting Started 695 News headline monitor 696 The quotes monitor 697 Quotes 693
COUNT ONLINE BROKING USER GUIDE
 Welcome to the Count Online Broking website, offering market-leading functionality to help you get more from your online trading and investing: Powerful charting giving you valuable insight into client
CHONG HING SECURITIES
 CHONG HING SECURITIES NEW IWEB USER GUIDE Version 1.2 Table Of Contents 1. LOGIN... 4 2. LOGOUT... 5 3. NAVIGATION MENU... 7 3.1 Streaming Version... 7 3.2 Snapshot Version... 8 4. LANGUAGE... 9 5. ON
Technical Analysis. Dealing Room Peter Leonidou. Peter Leonidou
 Technical Analysis Dealing Room Questions Traders Should Ask What is the trend? What is the pivot point? What is the support levels? What is the resistance levels? Strong or weaker USD? What 1. Trade
TAA Scheduling. User s Guide
 TAA Scheduling User s Guide While every attempt is made to ensure both accuracy and completeness of information included in this document, errors can occur, and updates or improvements may be implemented
Insurance Tracking with Advisors Assistant
 Insurance Tracking with Advisors Assistant Client Marketing Systems, Inc. 880 Price Street Pismo Beach, CA 93449 800 643-4488 805 773-7985 fax www.advisorsassistant.com support@climark.com 2015 Client
Copyright Alpha Markets Ltd.
 Page 1 Platforms & Accounts - Module 5 Welcome to this unit on Platforms & Accounts. In this module we will be explaining what a trading account is, as well as how you can go about configuring and using
MagicBreakout Forex Trading Strategy
 Tim Trush & Julie Lavrin introduce MagicBreakout Forex Trading Strategy Your guide to financial freedom. Tim Trush, Julie Lavrin, T&J Profit Club, 2007, All rights reserved www.magicbreakout.com Table
Autochartist User Manual
 Autochartist User Manual compliance@ifxbrokers.com www.ifxbrokers.com +27 42 293 0353 INTRODUCTION Chapter 1 Autochartist offers traders automated market-scanning tools that highlight trade opportunities
BONUS. www. candlecharts.com/special/swing-trading-2/
 BONUS www. candlecharts.com/special/swing-trading-2/ 1 www. candlecharts.com/special/swing-trading-2/ www. candlecharts.com/special/swing-trading-2/ www. candlecharts.com/special/swing-trading-2/ 2 www.
IMPORTANT CHANGES TO BILLING, ONLINE PAYMENTS, AND REFUND PROCEDURES
 IMPORTANT CHANGES TO BILLING, ONLINE PAYMENTS, AND REFUND PROCEDURES Anderson University is partnering with Nelnet Business Solutions to improve your student finance experience. Students can now manage
QUICKBOOKS BY INTUIT STUDENT VERSION ACCOUNTING SOFTWARE SUPPLEMENT FOR CHAPTER 1
 THE KNOWLEDGE BUREAU 2011 QUICKBOOKS BY INTUIT STUDENT VERSION ACCOUNTING SOFTWARE SUPPLEMENT FOR CHAPTER 1 COMMONALITIES OF BOOKKEEPING FOR VARIOUS BUSINESS ENTERPRISES OUR PRACTICAL GOAL: Here is what
Getting Ready to Trade
 Section VI. Getting Ready to Trade In This Section 1. Adding new securities 78 2. Updating your data 79 3. It's important to keep your data clean 80 4. Using Real-Time Alerts 81 5. Monitoring your tickers
å Follow these steps to delete a list: å To rename a list: Maintaining your lists
 Maintaining your lists TradingExpert Pro provides a number of functions for maintaining the data contained in your Group/Sector List and all other lists that you have created. This section lists the data
You can now seize market opportunities readily wherever you go with UTRADE on iphone, the trading app optimized for your iphone.
 Online trading made easy. Overview You can now seize market opportunities readily wherever you go with UTRADE on iphone, the trading app optimized for your iphone. UTRADE on iphone is available in the
Frequently Asked Questions for Members
 Frequently Asked Questions for Members m y i n s i g h t p e r s o n a l f i n a n c i a l m a n a g e m e n t t o o l GENERAL What is MyInsight? MyInsight is an intuitive online money management tool
How To Read Charts Like A Pro Your guide to reading stock charts!
 How To Read Charts Like A Pro Your guide to reading stock charts! Courtesy of Swing-Trade-Stocks.com You may distribute this book FREELY or use it as part of a commercial package as long as this page and
TRAVEL PORTAL INSTRUCTIONS
 TRAVEL PORTAL INSTRUCTIONS Date: June 22, 2018 Version: Version 3.1 Prepared By: Berkley Canada Table of Contents 1 ACCESSING THE PORTAL... 3 1.1 LOGIN & LOGOUT... 3 1.2 RESET YOUR PASSWORD... 3 2 THE
Accounts Receivables Accruals
 Accounts Receivables Accruals For FY13 June 14, 2013 Sonoma County of Education Information Technology References: 13.02 Release: Finance Processes Year End Closing Chapter 5 AR Invoices (see pages 5-18
Intelligent Investing, LLC Major Indices Daily Update 02/28/ 19
 Elliot Wave Updates Today the S&P500 was stuck in a less than 6p range. So there s really not much we can learn. All parameters remain the same a step 2: A move below SPX2764.55 (last Thursday s low) will
1.1 Installation from the Web 1.2 Logging On
 1 1.1 Installation from the Web 1.2 Logging On 2.1 WH Expert Elite Display and Menu Bars 2.2 The Icon Bar 2.2.1 Icon Bar Type 1 2.2.2 Icon Bar Type 2 2.2.3 Icon Bar Type 3 2.3 Right Mouse Click Support
META TRADER 5 MOBILE (iphone/ipad)
") (iphone/ipad) USER GUIDE www.fxbtrading.com 1 CONTENTS Getting started...4 Quotes...6 Depth of market...9 Chart...11 How to trade...13 History...19 2 The world s most popular forex trading platform MetaTrader
(iphone/ipad) USER GUIDE www.fxbtrading.com 1 CONTENTS Getting started...4 Quotes...6 Depth of market...9 Chart...11 How to trade...13 History...19 2 The world s most popular forex trading platform MetaTrader
Any symbols displayed within these pages are for illustrative purposes only, and are not intended to portray any recommendation.
 WebTrader Users Guide December 2010 WebTrader Release 5.3 2010 Interactive Brokers LLC. All rights reserved. Any symbols displayed within these pages are for illustrative purposes only, and are not intended
TRADING FOREX ON THE FabTraderGO PLATFORM
 TRADING FOREX ON THE FabTraderGO PLATFORM WHAT IS FABTRADER GO? Designed to be fast and as easy-to-use as possible, the FabTraderGo is a web-based trading platform that can be used from any HTML5-compatible
Customer Guide. Don t just be good with money, be MoneyBrilliant
 Customer Guide Welcome to MoneyBrilliant. Your Financial Partner has invited you to use the MoneyBrilliant service and to share your MoneyBrilliant information with them. They can work with you and provide
Blackberry Trader User Guide
 Blackberry Trader User Guide Table of Contents IronForex Blackberry Trader... 3 A. How to Find and Install using Desktop Manager... 3 B. How to Find and Install using Blackberry Smartphone... 4 C. How
Projection Strategies in the PROFITstar and PROFITability Programs Using Projection Strategies to Save Time and Improve Risk Analysis
 Projection Strategies in the PROFITstar and PROFITability Programs Using Projection Strategies to Save Time and Improve Risk Analysis Last revised: July 6, 2012 Intended audience: PROFITstar and PROFITability
 1 www.candlecharts.com 2 BONUS www. candlecharts.com/special/swing-trading-2/ 3 www. candlecharts.com/special/swing-trading-2/ 4 www. candlecharts.com/special/swing-trading-2/ 5 www. candlecharts.com/special/swing-trading-2/
Student Guide: RWC Simulation Lab. Free Market Educational Services: RWC Curriculum
 Free Market Educational Services: RWC Curriculum Student Guide: RWC Simulation Lab Table of Contents Getting Started... 4 Preferred Browsers... 4 Register for an Account:... 4 Course Key:... 4 The Student
Product Eligibility and Pricing Services. Loan Originator User Guide
 Product Eligibility and Pricing Services Loan Originator User Guide Table of Contents Table of Contents Log In... 1 Enter New Loan Data... 1 Evaluate Products... 6 Analyze Search Results... 6 Update Search
StuckyNet-Link.NET User Interface Manual
 StuckyNet-Link.NET User Interface Manual Contents Introduction Technical Information General Information Logging In & Out Session Timeout Changing Your Password Working with the Borrowing Base Creating
Officeweb Adviser Charging. User Guide
 Officeweb Adviser Charging User Guide 1 INTRODUCTION... 3 PROVIDER FACILITATED CHARGE... 4 How to add a Provider Facilitated Charge Initial Fee... 4 How to add a Provider Facilitated Charge - On-Going
ULTRA II User Manual. Ultra II is a new Internet security trading system that has been developed to facilitate Bualuang i-trading's customers.
 ULTRA II User Manual Ultra II is a new Internet security trading system that has been developed to facilitate Bualuang i-trading's customers. 1. Over View Ultra II consists of 5 main category pages: 1.1
Stock Market Investor
 017 648 2029 6767 www.stockmarketinvestor.co.za Stock Market Investor is your leading stock market charting software, specifically developed for both seasoned as well as first-time investors. This programme
intalus.com TR DING Issue The todays tallest building in the UK on the scale of 310 metres high. SKYSCRAPER. The Shard, London.
 TIPS. HOW TO. SKYSCRAPER. The Shard, London. The todays tallest building in the UK on the scale of 310 metres high. 12 CONTROL AND MONITOR YOUR ASSETS BY RULE-BASED APPROACHES. How to create a portfolio
BOCI SmartXpress iphone & Android Trading Platform User Guide
 BOCI SmartXpress iphone & Android Trading Platform User Guide 1 P a g e Contents I. Start with Download P.3 P.5 II. Securities Account Login P.6 III. Quote and News P.7 P.15 IV. HK and US Securities Trading