The Technical Portfolio
|
|
|
- Andra Parrish
- 5 years ago
- Views:
Transcription

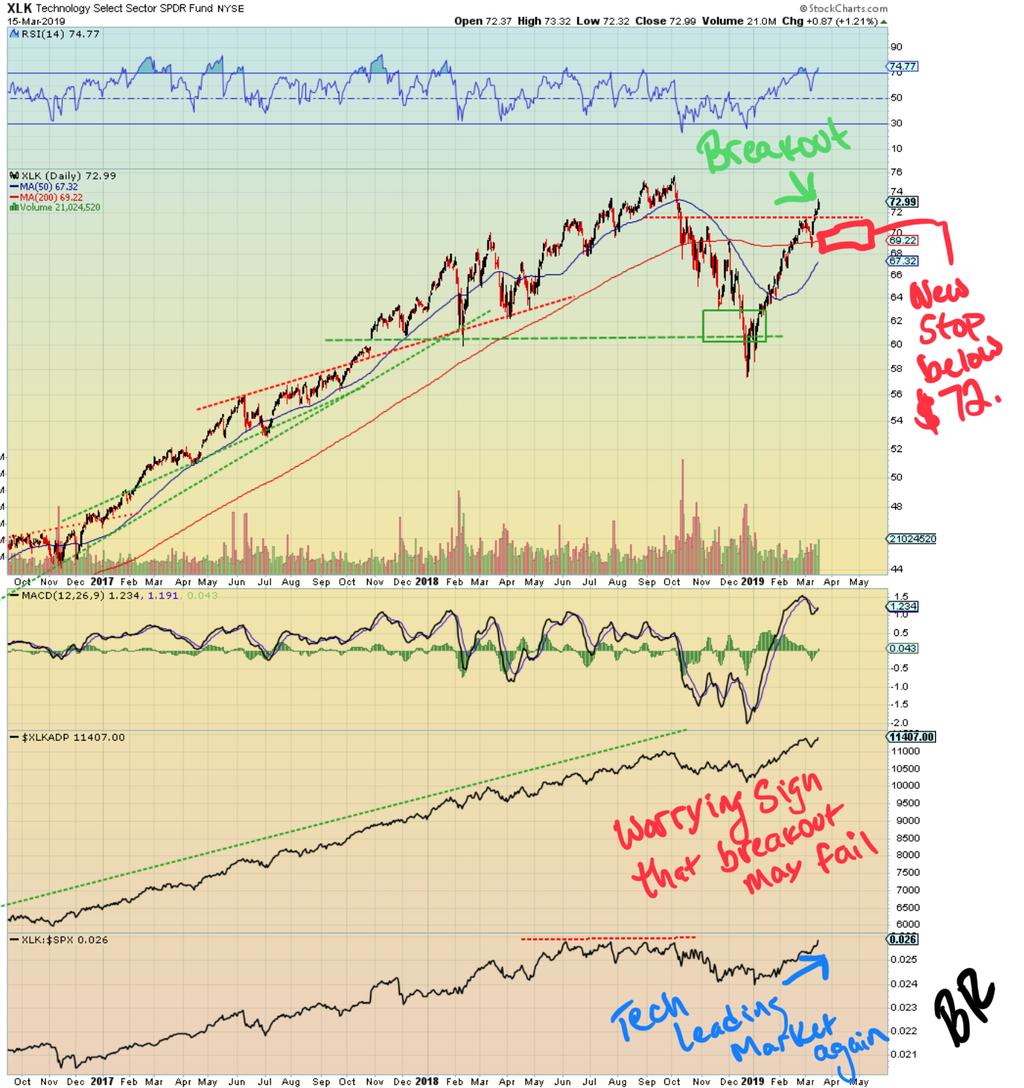
1 Volume 18 Monthly Return Comparison Regular Portfolio +2.73% Aggressive Portfolio +2.68% S&P % Dow Jones Industrial Average -0.13% Nasdaq Composite +2.89% Russell % March 17, 2019 The Technical Portfolio The Market Environment Our last index analysis showed the Russell 2000 testing its 200-day moving average, a short-term resistance, and a long-term resistance (read the analysis for members here, or the free blog here). The Russell 2000 started last year s drop from the highs because it peaked a month a month before the S&P 500 and other large cap indices. It also bottomed at a significant support level; further evidence the index is leading stocks. The S&P 500 and Dow Jones Industrial Index did not find significant reversal points, but the Nasdaq Composite did. The Russell 2000 and Nasdaq Composite are the two leaders investors should watch for technical signals. The Russell 2000 has always been a leading indicator for investor risk appetite, and a proxy on the U.S. economy. The Nasdaq Composite has a large allocation to technology stocks, and these have been driving the bull market for the last few years. Now, these two indices are diverging away from significant resistance levels. One is showing a bullish breakout, while the other is failing to advance past the resistance level. It is likely that one of these signals is false. Last week, stocks fell as the Russell 2000 failed to clear its 200 day moving average. This hurt stock momentum as there are less stocks above their 50 day and 200 day moving averages. In addition, the MACD, RSI, and MFI indicators are no longer reaching new highs, which is most concerning for the Nasdaq Composite. Sector rotation is also a problem, as the S&P 500 tests its November and October highs. Only technology, utilities, and real estate are above their November highs. The rest of the sectors are still below them, with materials currently testing its November peak. If the S&P 500 and the rest of stocks are going to continue higher, the major sectors need to break past the resistance with the index.
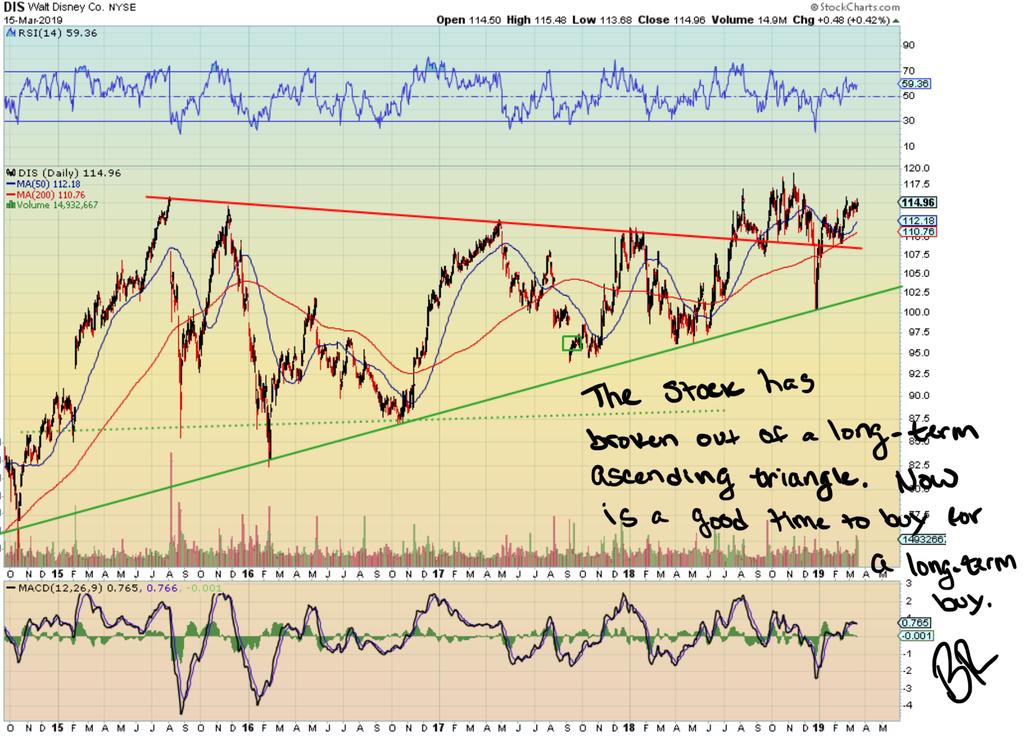
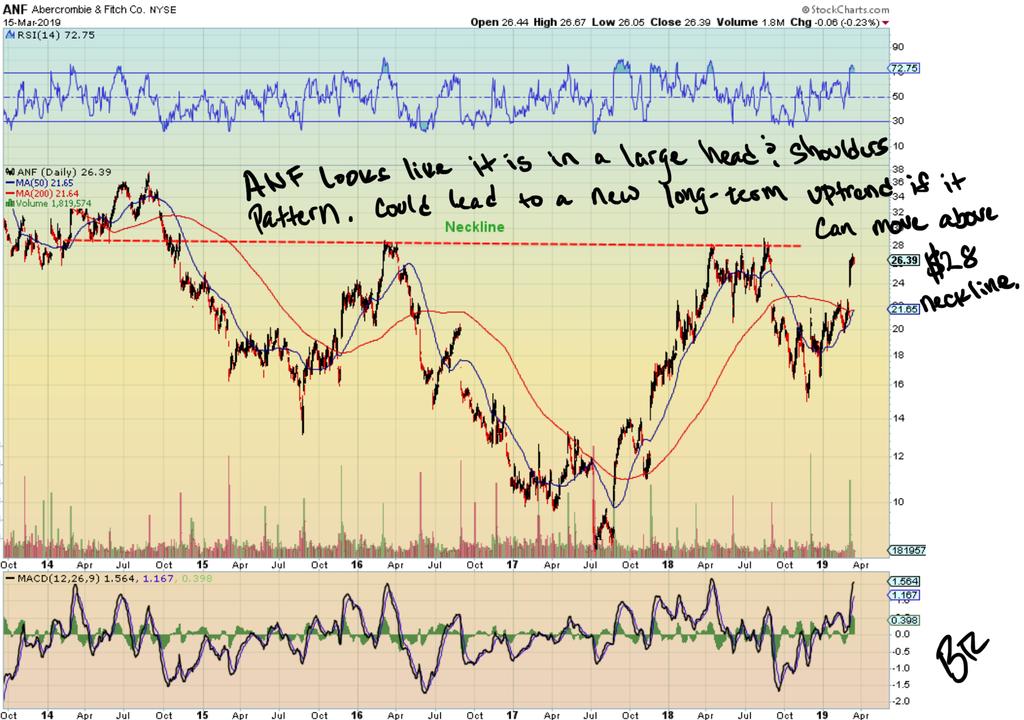
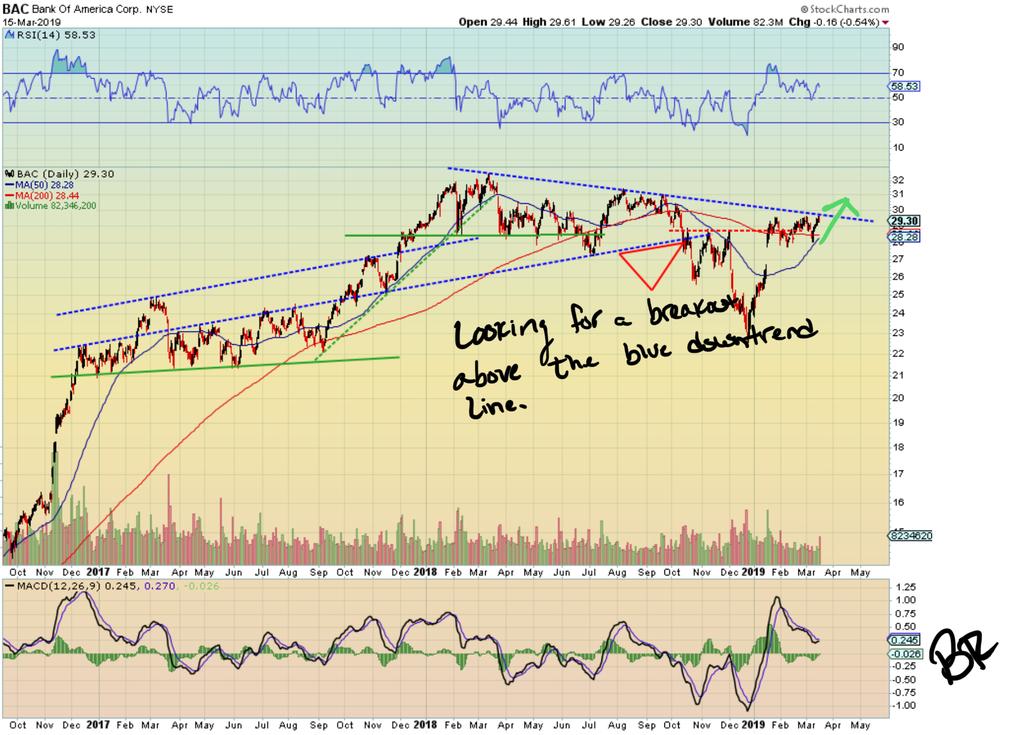
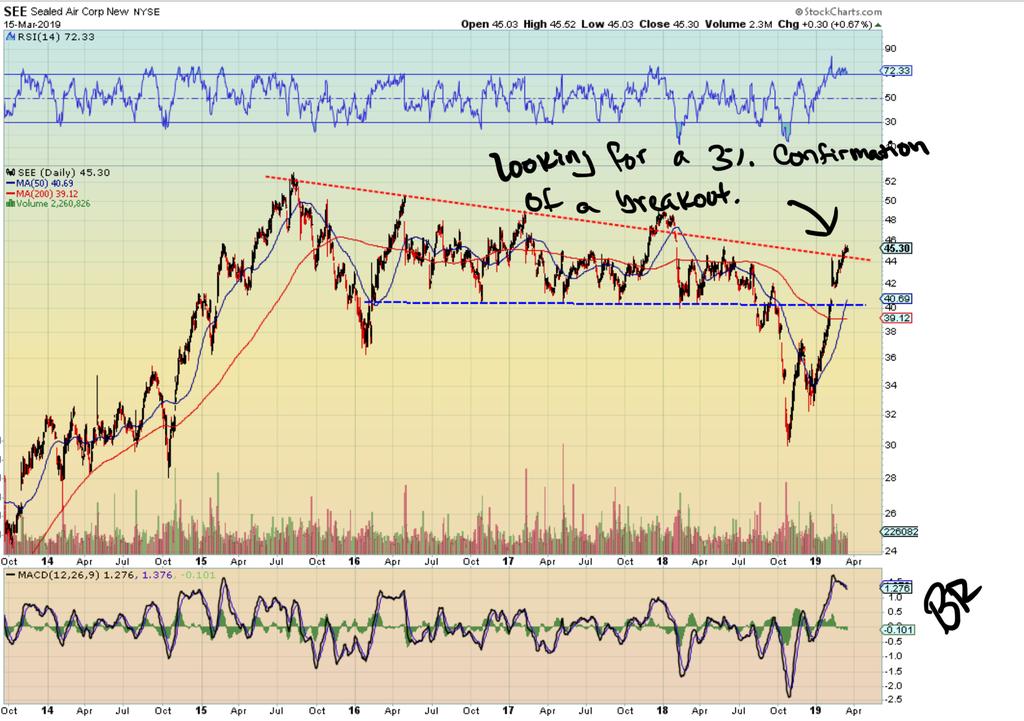
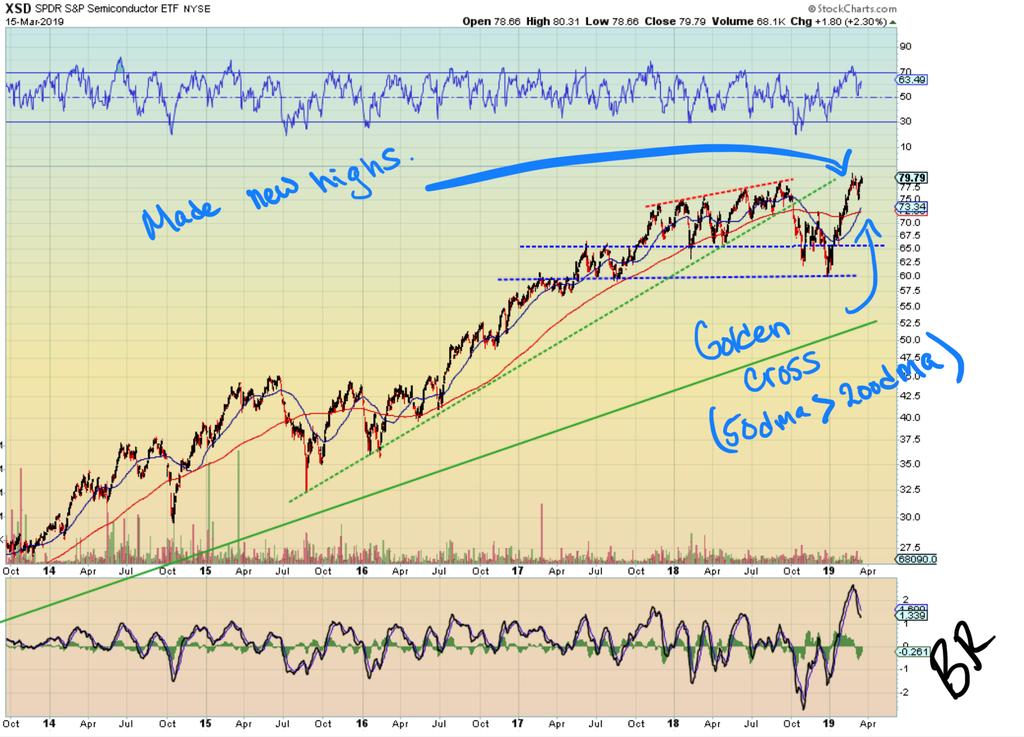
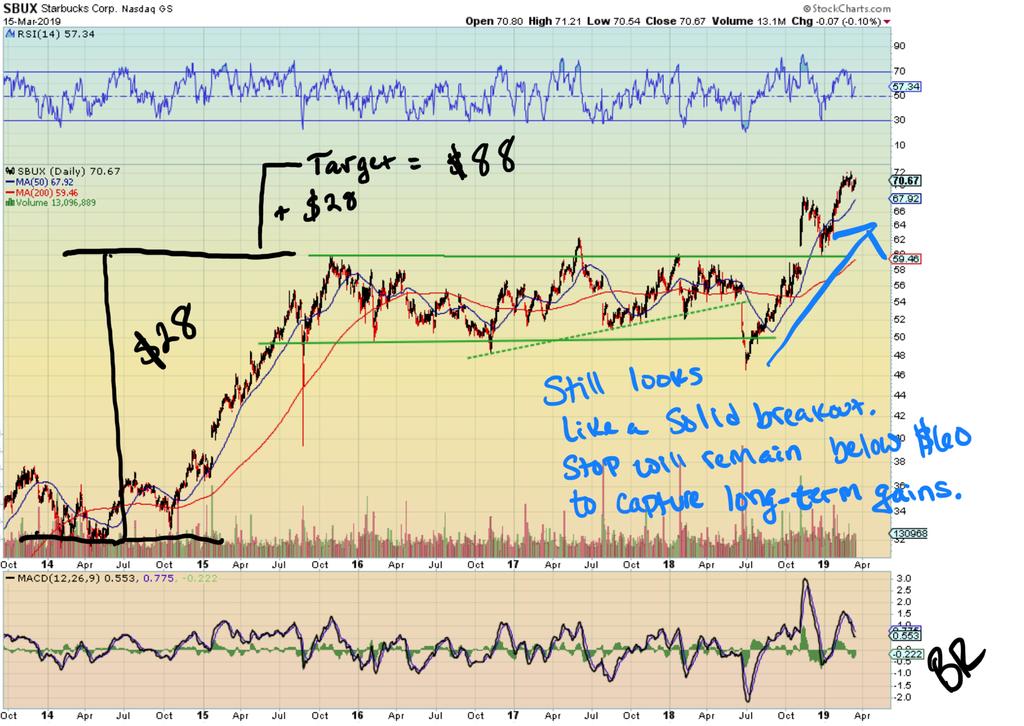
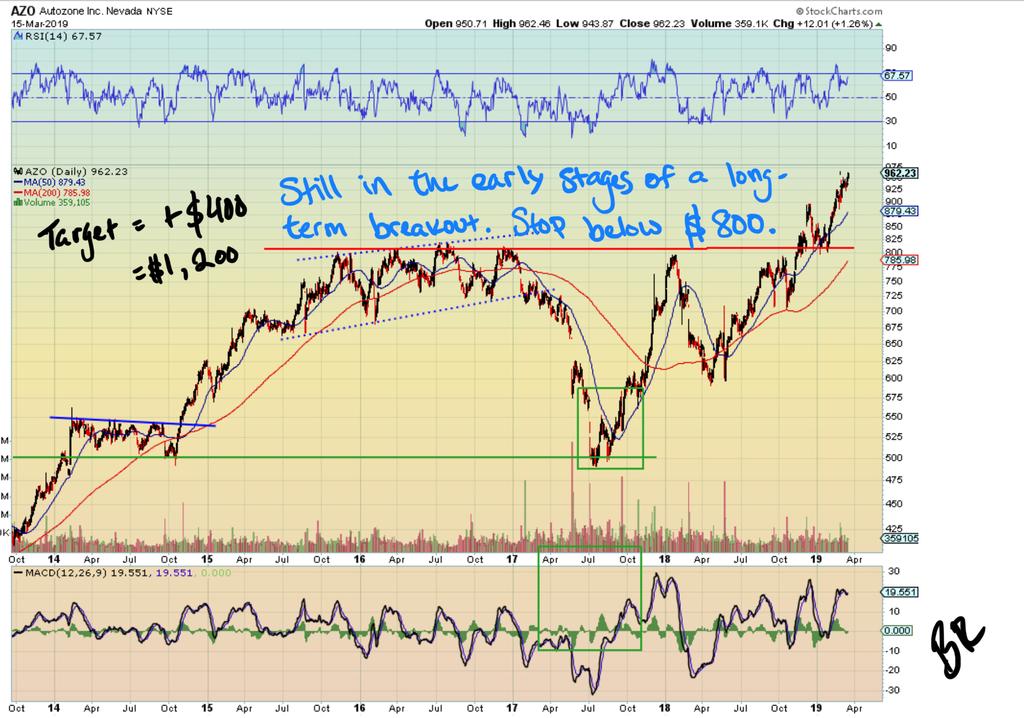
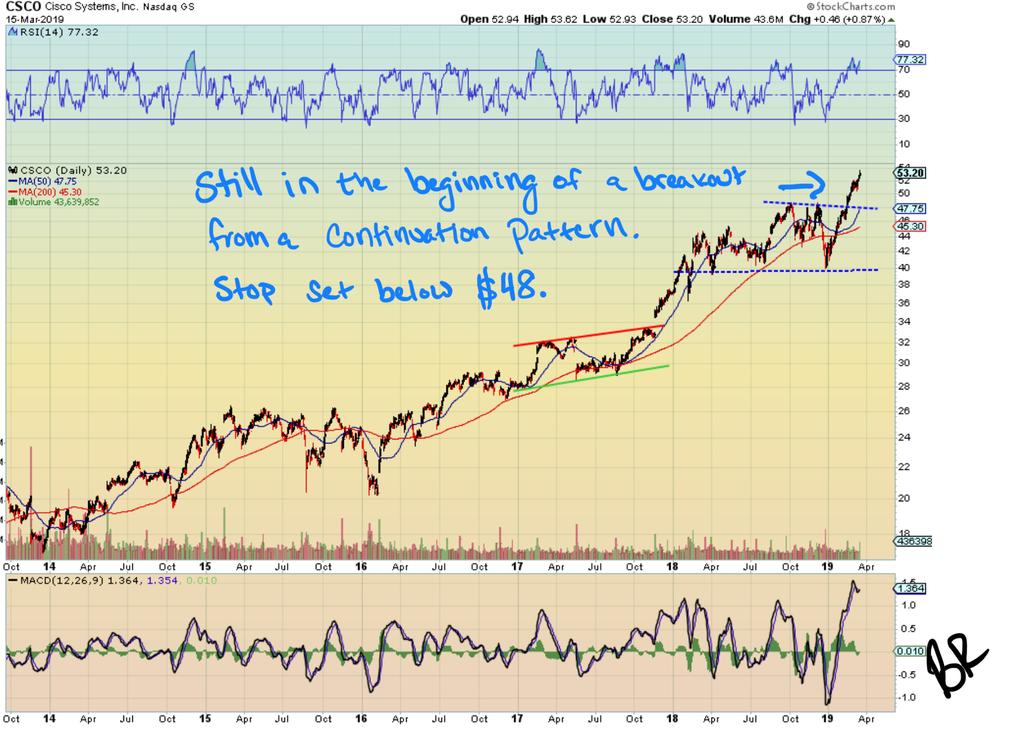
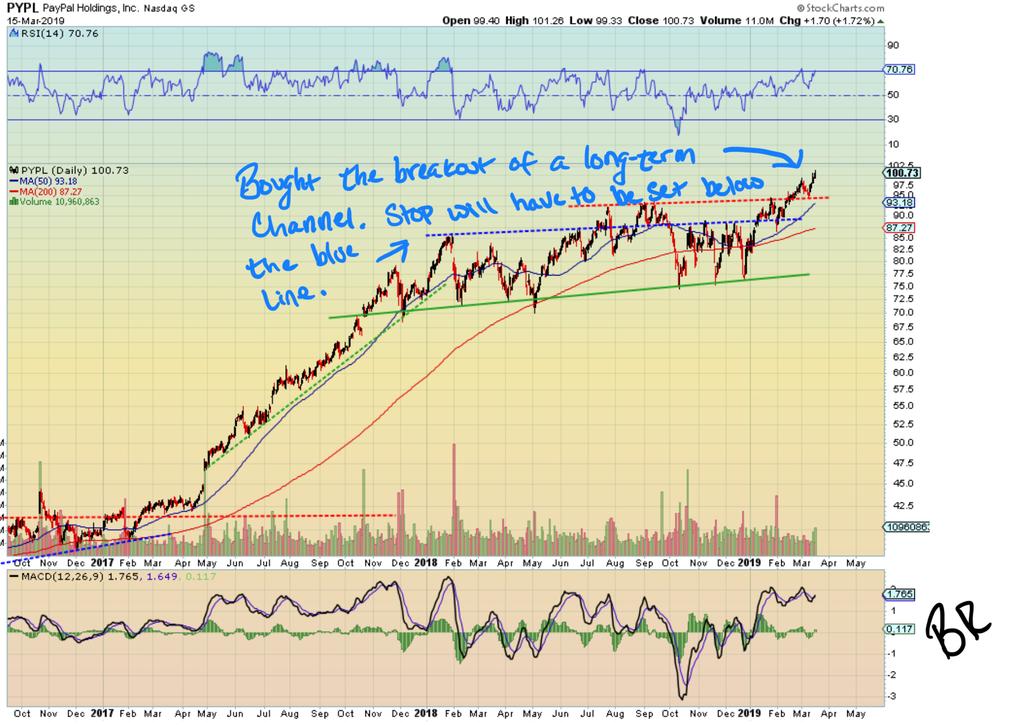
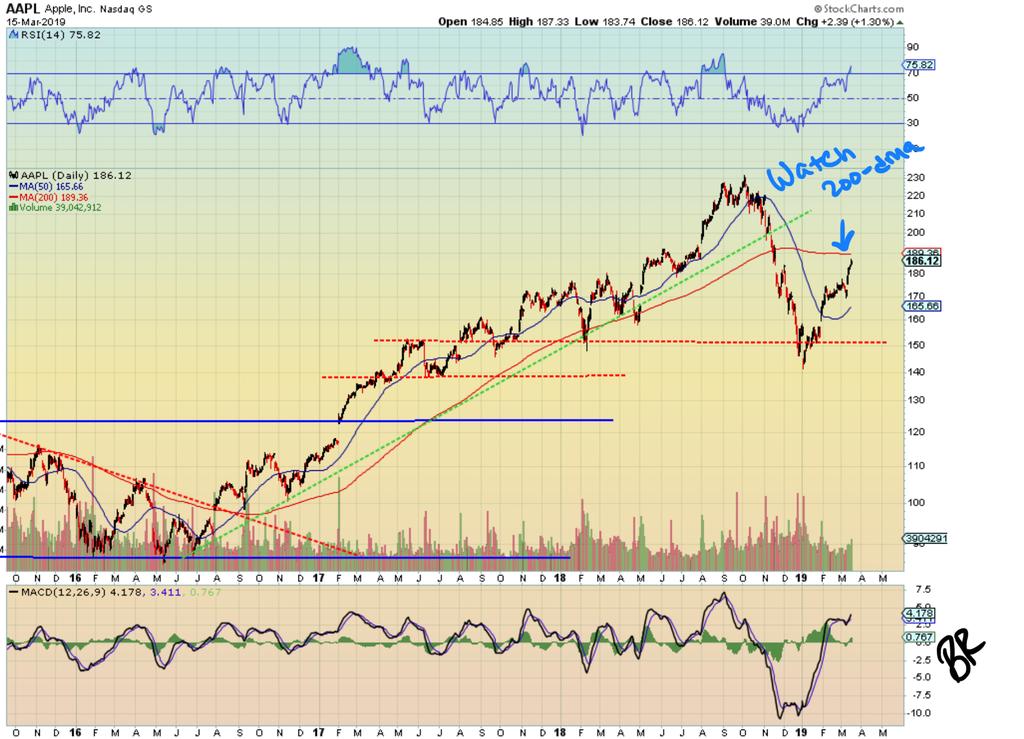
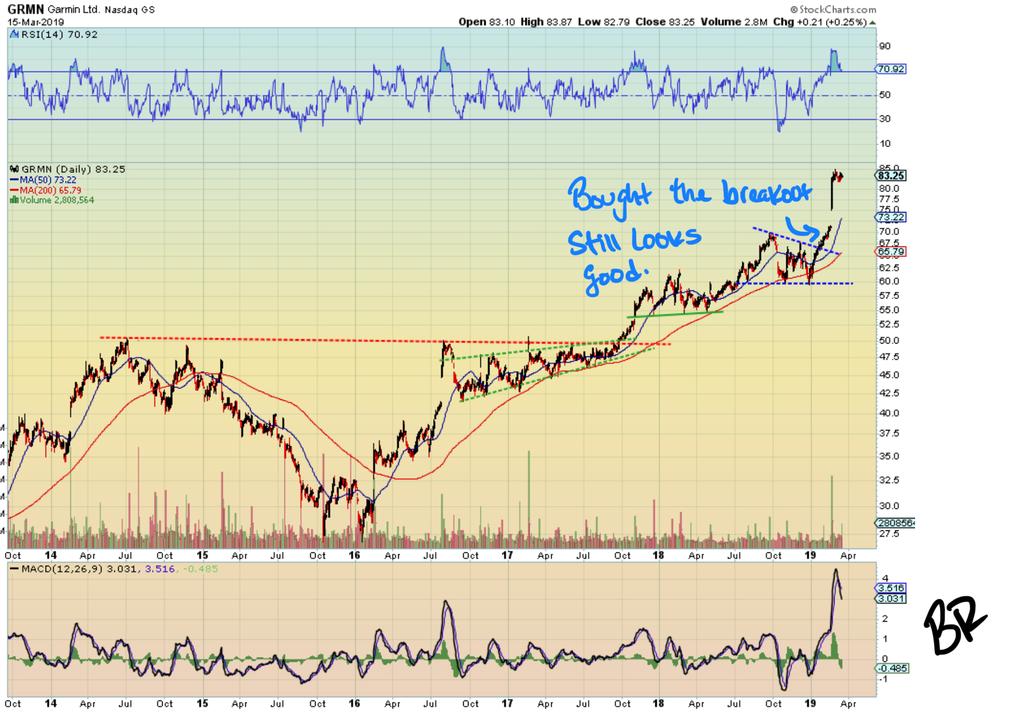
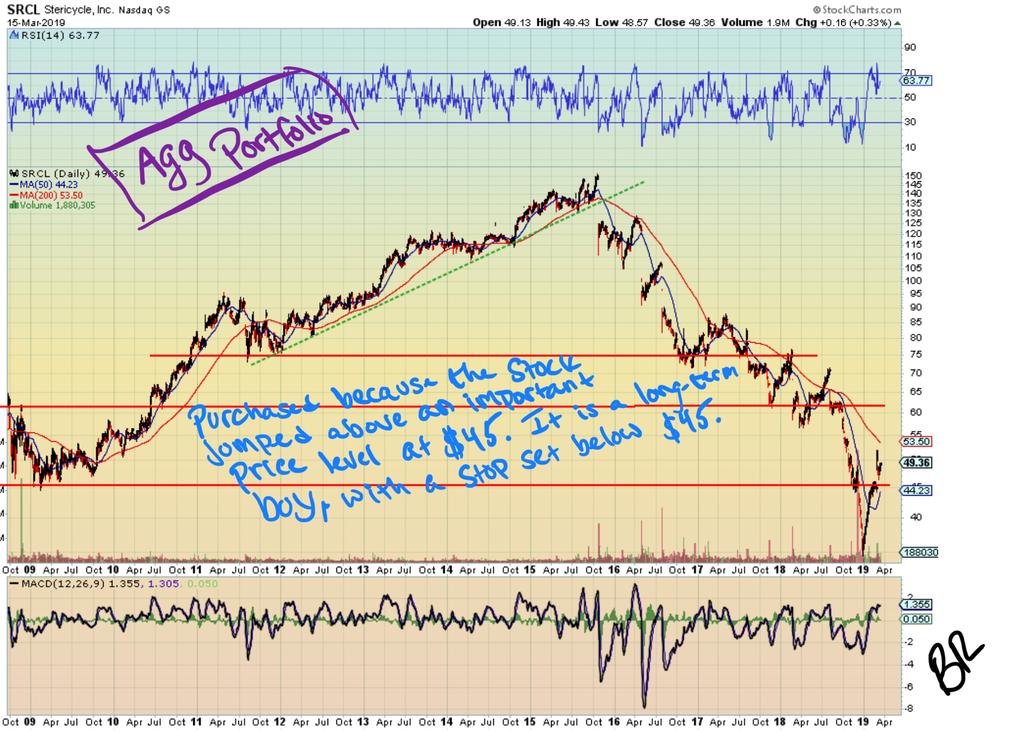
2 Portfolio (Total Return) AAPL % AZO % CSCO 7.02% GLD 7.58% GRMN 15.96% PYPL +2.82% SBUX +9.18% SRCL (AGG) +1.76% XLK % XSD % Until we see the follow through with the Russell 2000, S&P 500, and Dow Jones Industrial Average, we are going to expect stocks to remain in a range. Amazingly, if the follow through occurs, then we are potentially looking at the beginning of a new uptrend. It s hard to imagine a new uptrend at this juncture of the economic and market cycle. We are in a stock picker s market, and we need to be extremely selective of the stocks we purchase and continue to hold. We are looking for stocks that have strong uptrends and breakouts. We want our holdings to pause only slightly when the S&P 500 reaches the resistance even, but continues to make new highs through the volatility around them. Stocks like these are hard to find, but we can find candidates using technical analysis. Portfolio Performance & Management When the S&P 500 first reached its resistance at the end of February, we raised cash by selling JPM and LOW. These were the weakest positions we had, and they helped lower risk in our portfolio. Unless the major averages make significant moves past a resistance or a support, I still believe the market will be in a trading range. I am comfortable with the level of cash in our portfolios, as we can wait to deploy into high quality opportunities. Specifically, I am looking for stocks that have been in a range for a few years, but now are starting to breakout. We still have a large position in gold (GLD), but there isn't a real reason to get out of the position. We initially purchased the position as a hedge. The metal had reached a strong support level, and stocks were starting to show weakness. This gave us the perfect opportunity to purchase. Now, the market has recovered, but I think the metal still has room to grow. We will continue to hold this hedge, but if we find good opportunities in stocks, and our cash levels start to dwindle, we will take from GLD. There are two other positions I am concerned about, but have performed really well for us: XSD and AAPL. I am only concerned because I don't really have an exit strategy. All three positions have recovered nicely, but the charts do not present any obvious signals for exit. Our other stock positions are great breakouts, with long-term potential. However, it is difficult to determine if these positions have long-term potential as well. For now, we will continue to hold these positions, and will hope an exit strategy presents itself in the future. Stocks to Watch I am looking for stocks that have large patterns that span multiple years, but are now breaking out. These types of stocks have not participated in the large run-up since 2016, and they were contained during the drop at the end of They have less of a correlation to the rest of the market, and now is their time to shine. These will be the stocks that bring the S&P 500 back up towards a resistance, and will help control its drop towards a support. With these types of positions we hope to bring our portfolio performance up, while the S&P 500 stays flat. Here are the stocks we are watching: Watchlist (Entry Price) DIS $ ANF $28.84 BAC $30.18 SEE $45.32
3
4
5 Written by Brandon Ross, CMT for BRTechnicals.com March 17, Disclaimer: 1. Various BR Technicals newsletters (collectively, Newsletters ), are published by BR Technicals, and offered for sale to the general public. 2. The Newsletters are impersonal and do not provide individualized advice or recommendations for any specific subscriber or portfolio. 3. Investing involves substantial risk. Neither the Author, the publisher, nor any of their respective affiliates make any guarantee or other promise as to any results that may be obtained from using the Newsletters. While past performance may be analyzed in the Newsletters, past performance should not be considered indicative of future performance. No reader should make any investment decision without first consulting his or her own personal financial advisor and conducting his or her own research and due diligence, including carefully reviewing the prospectus and other public filings of the issuer. To the maximum extent permitted by law, the Author, the publisher and their respective affiliates disclaim any and all liability in the event any information, commentary, analysis, opinions, advice and/or recommendations in the Newsletters prove to be inaccurate, incomplete or unreliable, or result in any investment or other losses. 4. The Newsletters commentary, analysis, opinions, advice and recommendations represent the personal and subjective views of the Author, and are subject to change at any time without notice. 5. The information provided in the Newsletters is obtained from sources which the Author believes to be reliable. However, the Author has not independently verified or otherwise investigated all such information. Neither the Author, the publisher, nor any of their respective affiliates guarantee the accuracy or completeness of any such information. 6. The Author is not a solicitation or offer to buy or sell any securities. 7. Neither the Author, the publisher, nor any of their respective affiliates is responsible for any errors or omissions in any Newsletter.
6 Portfolio Return Comparison Regular Aggressive S&P 500 Date Value Change Value Change Value Change 9/22/2017 $100, $100, /27/2017 $101, % $102, % $2, % 11/24/2017 $101, % $102, % $2, % 12/29/2017 $104, % $105, % $2, % 2017 Returns 4.83% 5.89% 6.85% 2018 $104, $105, $2, /26/2018 $111, % $113, % $2, % 2/23/2018 $105, % $106, % $2, % 3/30/2018 $103, % $104, % $2, % 4/27/2018 $105, % $105, % $2, % 5/25/2018 $107, % $108, % $2, % 6/22/2018 $109, % $109, % $2, % 7/20/2018 $110, % $111, % $2, % 8/17/2018 $111, % $112, % $2, % 9/21/2018 $116, % $117, % $2, % 10/19/2018 $109, % $110, % $2, % 11/16/2018 $107, % $109, % $2, % 12/21/2018 $108, % $110, % $2, % 12/31/2018 $106, % $108, % $2, % 1/18/2019 $105, % $106, % $2, % 2/15/2019 $108, % $110, % $2, % 3/15/2019 $111, % $113, % $2, % YTD 4.47% 4.50% 12.59% 1 Year 7.58% 8.78% 6.88% Total Return 11.75% 13.14% 12.80%
7 Aggressive Portfolio SYMBOL DESCRIPTION QTY PURCHASE PRICE CURRENT PRICE TOTAL VALUE TOTAL GAIN/ LOSS AAPL APPLE INC. $30.00 $ $ $5, $621.60(12.53 %) AZO AUTOZONE, INC. $8.00 $ $ $7, $985.52(14.68 %) CSCO CISCO SYSTEMS, INC. $ $49.71 $53.20 $7, $523.50(7.02 %) GLD SPDR GOLD TRUST $ $ $ $17, $1,215.78(7.58 %) GRMN GARMIN LTD. $ $71.79 $83.25 $10, $1,489.80(15.96 %) PYPL PAYPAL HOLDINGS INC $57.00 $97.97 $ $5, $157.41(2.82 %) SBUX STARBUCKS CORPORATION 98 $64.73 $70.67 $6, $582.12(9.18 %) SRCL STERICYCLE, INC. 123 $48.51 $49.36 $6, $105.17(1.76 %) XLK TECHNOLOGY SELECT SECTOR SPDR FUND 103 $63.85 $72.99 $7, $941.94(14.32 %) XSD SPDR S&P SEMICONDUCTOR ETF 52 $67.89 $79.89 $4, $624.00(17.68 %) Regular Portfolio SYMBOL DESCRIPTION QTY PURCHASE PRICE CURRENT PRICE TOTAL VALUE TOTAL GAIN/ LOSS AAPL APPLE INC. $30.00 $ $ $5, $621.60(12.53 %) AZO AUTOZONE, INC. $8.00 $ $ $7, $985.52(14.68 %) CSCO CISCO SYSTEMS, INC. $ $49.71 $53.20 $7, $523.50(7.02 %) GLD SPDR GOLD TRUST $ $ $ $17, $1,215.78(7.58 %) GRMN GARMIN LTD. $ $71.79 $83.25 $10, $1,489.80(15.96 %) PYPL PAYPAL HOLDINGS INC $57.00 $97.97 $ $5, $157.41(2.82 %) SBUX STARBUCKS CORPORATION 98 $64.73 $70.67 $6, $582.12(9.18 %) XLK TECHNOLOGY SELECT SECTOR SPDR FUND 103 $63.85 $72.99 $7, $941.94(14.32 %) XSD SPDR S&P SEMICONDUCTOR ETF 52 $67.89 $79.89 $4, $624.00(17.68 %)

8 Portfolio Charts
9
10
11
12
13
The Technical Portfolio
 Volume 15 Moving our Portfolio from Cash to Shorts Market Recap Page 1 Tightening Monetary Conditions Hurt Stocks Page 1-2 The S&P 500 Breaks a Ten Year Old Trend Page 2 Shorting the Major Indices Page
The Investing Climate
 November 18, 2018. Volume 14 The Investing Climate It has been a wild ride in the stock market these past couple of months. While history usually points to a wild October, a wild November is surprising
TMTA Theme Momentum Technical Analysis
 February 14, 2016 Standing on the Precipice What an interesting time to start a blog on stock speculation! After a nasty start to 2016, we sit on the precipice of the 6 year trend and near term support
HEIKIN-ASHI TREND NEWSLETTER
 HEIKIN-ASHI TREND NEWSLETTER #210 12.03.2017 EDUCOFIN 2013-2017. ALL RIGHTS RESERVED 25% DISCOUNT IMPROVE YOUR TRADING & INVESTING WHEN YOU ORDER BOTH HEIKIN-ASHI TRADING BOOKS TODAY To order: http://www.educofin.com/heikinashi-book.htm
Top Down Analysis Success Demands Singleness of Purpose
 Chapter 9 Top Down Analysis Success Demands Singleness of Purpose Armed with a little knowledge about the stock and options market as well as a desire to trade, many new traders are faced with the daunting
Monthly Investment Compass Charting The Course Of The Markets
 Monthly Investment Compass Charting The Course Of The Markets January 12 th, 2017 Monthly Investment Compass Executive Summary: January 12 th 2017 U.S. Stock Market: A number of near term metrics warn
HEIKIN-ASHI TRENDS NEWSLETTER
 HEIKIN-ASHI TRENDS NEWSLETTER INDEXES EQUITIES FOREX CRYPTOCURRENCIES #227 05.13.2018 EDUCOFIN 2013-2018. ALL RIGHTS RESERVED 25% DISCOUNT BE YOUR MASTER, A HEIKIN-ASHI MASTER. ORDER BOTH HEIKIN-ASHI TRADING
Monthly Investment Compass Charting The Course Of The Markets
 Monthly Investment Compass Charting The Course Of The Markets November 11 th, 2017 Monthly Investment Compass 1) Executive Summary: November 11 th, 2017 U.S. Stock Market: Unmet upside targets in several
HEIKIN-ASHI NEWSLETTER
 HEIKIN-ASHI NEWSLETTER A WEEKLY SUMMARY FOR HEIKIN-ASHI AFICIONADOS Issue 96 January 12, 2014 Site: www.educofin.com Blog: http://heikinashi.wordpress.com Heikin-Ashi Book: http://www.educofin.com/heikinashi-book.htm
Market Observations - as of Jul 27, 2018
 Market Observations - as of Jul 27, 2018 By Carl Jorgensen - For Objective Traders - For educational purposes only. Not Financial Advice. This week began with most markets continuing their bullish trends
Monthly Investment Compass Charting The Course Of The Markets
 Monthly Investment Compass Charting The Course Of The Markets April 22 nd, 2016 Monthly Investment Compass Executive Summary: April 22 nd 2016 U.S. Stock Market: The most important takeaway from the latest
Thursday s Daily Stock Report
 Edition: 1117 1 September 2016 Thursday s Daily Stock Report Stay side-line in market and commodities 33% Discount offer will end soon, so take advantage Dear Members, On Wednesday most of markets traded
Asbury Research s US Investment Analysis: A Review of Q Prepared for Interactive Brokers
 Asbury Research s US Investment Analysis: A Review of Q1 2016 Prepared for Interactive Brokers April 14 th. 2016 About Asbury Research Research, Methodology & Clientele Our Research: Asbury Research, established
Cornerstone Report: Weekly Market Update
 Cornerstone Report: David McCord, CMT Another bad week for stocks, which is becoming a bit routine quickly. Monday moved lower from the start. Tuesday started with a huge drop, but managed to close only
MARKET REVIEW - DECEMBER
 Defying Gravity Stocks continue to climb 'Wall of Worry'. December 1, 2009 ON THE EDGE MARKET REVIEW - DECEMBER 2009 Following a lackluster October, stocks showed marked improvement during November despite
Trade Signals Short-term Sentiment Says Buy, Trend Evidence Positive, Bonds are a Different Story
 cmgwealth.com http://www.cmgwealth.com/ri/trade-signals-short-term-sentiment-says-buy-trend-evidence-positive-bonds-are-a-different-story/ Trade Signals Short-term Sentiment Says Buy, Trend Evidence Positive,
US Financial Market Update for March Prepared for the Market Technicians Association
 US Financial Market Update for March 2016 Prepared for the Market Technicians Association March 16 th, 2016 About Asbury Research Research, Methodology & Clientele Our Research: Asbury Research, established
Municipal Bonds v. U.S. Treasury & Corporate Bonds December 3, 2018 JR Rieger (516) straighttalkaboutbonds.
 straighttalkaboutbonds.") Municipal Bonds v. U.S. Treasury & Corporate Bonds JR Rieger JR@RiegerReport.com (516) 524-1110 straighttalkaboutbonds.com November 2018: Municipal Bonds Show Their Strength Month end results: Investment
Municipal Bonds v. U.S. Treasury & Corporate Bonds JR Rieger JR@RiegerReport.com (516) 524-1110 straighttalkaboutbonds.com November 2018: Municipal Bonds Show Their Strength Month end results: Investment
Monthly Investment Compass Charting The Course Of The Markets
 Monthly Investment Compass Charting The Course Of The Markets September 21st, 2017 Monthly Investment Compass 1) Executive Summary: September 21 st, 2017 U.S. Stock Market: Virtually all of our near term
Weekly Market Summary
 Weekly Market Summary August 18, 2015 by Urban Carmel of The Fat Pitch US equities had two opportunities to kick off a rally this week. Neither had much follow through. On Monday, positive breadth was
Weekly technical analysis chart pack 6 th October 2014 James Brodie Chartered Market Technician
 Weekly technical analysis chart pack 6 th October 2014 James Brodie Chartered Market Technician There are now increasing concerns facing the long term bull trends in the U.S. equity markets. Three key
Investing During The Trump Administration: Opportunity & Danger
 Investing During The Trump Administration: Opportunity & Danger Prepared for the Los Angeles Chapter of the American Association of Individual Investors (AAII ) June 17 th, 2017 About Asbury Research John
Chart 2: Long-term valuation metrics suggest US stocks to be highly valued.
 November 19th, 2018 1 This is provided for informational purposes only and should not be considered a recommendation to buy or sell a particular security. Past performance is no guarantee of future returns.
Market Maps. Bob Dickey, Technical Strategist, Portfolio Advisory Group. December RBC Capital Markets, LLC / Portfolio Advisory Group
 Market Maps Bob Dickey, Technical Strategist, Portfolio Advisory Group RBC Capital Markets, LLC / Portfolio Advisory Group All values in U.S. dollars and priced as of market close, December 1, 2017, unless
Quick Takes Pro Technical Analysis for Everyone
 Quick Takes Pro Technical Analysis for Everyone Michael Kahn Research LLC November 10, 2014 Stocks were higher for the third straight week as major indices hit new highs for the year. Mid- and small-caps
THE ROSEN MARKET TIMING LETTER
 THE ROSEN MARKET TIMING LETTER PRECIOUS METALS - FOREX - STOCK INDICES - COMMODITIES https://www.deltasociety.com/content/ron-rosen-precious-metals-timing-letter RONALD L. ROSEN March 12, 2017 Gold bullion
Nov 7 th, 2010 By: Chris Vermeulen. SPX s Running Correction, Gold Shines, Cup of Oil Breaks Out!
 Nov 7 th, 2010 By: Chris Vermeulen SPX s Running Correction, Gold Shines, Cup of Oil Breaks Out! The financial markets continue to climb the wall of worry on the back of more Fed Quantitative Easing. Those
BENNETT S MARKET MINUTES
 Godel Trades LLC www.godeltrades.com Volume 8, Edition 2 08/12/2018 BENNETT S MARKET MINUTES S&P 500 Overviewsdfjksdjfskdlsdfsdsfsdfjsdlkfjlfkjsdllk Last week the markets established a support base nearing
Market Observations as of Dec 8, 2017
 Market Observations as of Dec 8, 2017 By Carl Jorgensen - For Objective Traders - For educational purposes only. Not Financial Advice. The Market Rotation we saw last week, with an exit from Tech into
Martin Pring s. Weekly InfoMovie Report. April 8, 2014
 Martin Pring s Weekly InfoMovie Report April 8, 2014 Issue 1093 Weekly InfoMovie Report 1 Key level remains $184 on the SPY. US Equity Market - Last time I pointed out that the $184 level on the S&P ETF
Market Observations - as of May 11, 2018
 Market Observations - as of May 11, 2018 By Carl Jorgensen - For Objective Traders - For educational purposes only. Not Financial Advice. After about four weeks of very little net change in the major indexes
Trade Signals New All Time High, Trend Evidence Remains Positive
 cmgwealth.com http://www.cmgwealth.com/ri/trade-signals-new-all-time-high-trend-evidence-remains-positive/ Trade Signals New All Time High, Trend Evidence Remains Positive S&P 500 Index 2100 By Steve Blumenthal
December 2018 Report
 MCG Capit al Management LLC December 2018 Report December 20, 2018 MCG Capital Management LLC is the adviser to investment partnership entities available to accredited investors. The firm also manages
- My 4 Favorite Trades - Essential Trades of a Professional Trader
 presented by Thomas Wood MicroQuant SM Divergence Trading Workshop Day One - My 4 Favorite Trades - Essential Trades of a Professional Trader Risk Disclaimer Trading or investing carries a high level of
Cash Cow Newsletter April
 Cash Cow Newsletter April 16 2014 In this week s Cash Cow newsletter I would like to analyze the current state of the market and review strategies that can help protect us in high volatility environments.
Weekly outlook for Nov. 27 Dec
 Weekly outlook for Nov. 27 Dec. 1 2017 Summary For the ES we expect a minor pullback in the early part of the week, followed by a rally into the weekly close. There are four option expirations this week
Chart Pattern Secrets
 Chart Pattern Secrets June 14, 2018 Next Alert: 06/19/18 The Trading System: Application of Trading Chart Patterns with Futures and Option Contracts Copyright 1997 All rights reserved. 1 2 3 4 5 5/15/18:
Weekly outlook for May 28/9 - June 1, 2018
 Weekly outlook for May 28/9 - June 1, 2018 Summary The S&P500 index is expected to be dull due to the short week, barring major news. A minor pullback maybe seen, but it should be a very short-lived. It
Long-Term trends for each index remains up and nothing of late has changed that!!!
 Long-Term trends for each index remains up and nothing of late has changed that!!! Each index is testing some form of overhead resistance. These are price points where bulls will say No Thank You to selling
Market Maps. Bob Dickey, Technical Strategist, Portfolio Advisory Group. January RBC Capital Markets, LLC / Portfolio Advisory Group
 Market Maps Bob Dickey, Technical Strategist, Portfolio Advisory Group RBC Capital Markets, LLC / Portfolio Advisory Group All values in U.S. dollars and priced as of December 31, 2018, unless otherwise
Counter Trend Trades. (Trading Against The Trend) By Russ Horn
 By Russ Horn") Counter Trend Trades (Trading Against The Trend) By Russ Horn 1 RISK DISCLOSURE STATEMENT / DISCLAIMER AGREEMENT Trading any financial market involves risk. This report and all and any of its contents
Counter Trend Trades (Trading Against The Trend) By Russ Horn 1 RISK DISCLOSURE STATEMENT / DISCLAIMER AGREEMENT Trading any financial market involves risk. This report and all and any of its contents
Market Observations as of Aug 4, 2017
 Market Observations as of Aug 4, 2017 By Carl Jorgensen - For Objective Traders - For educational purposes only. Not Financial Advice. This week The mixed responses to earnings this week has resulted in
No duplication of transmission of the material included within except with express written permission from the author.
 Copyright Option Genius LLC. All Rights Reserved No duplication of transmission of the material included within except with express written permission from the author. Be advised that all information is
Thursday s Daily Stock Report (Unedited)
") Edition: 1139 29 September 2016 Thursday s Daily Stock Report (Unedited) Energy stocks started supporting market Dear Members, On Wednesday market recovered sharply after OPEC decided to cut 20% production
Edition: 1139 29 September 2016 Thursday s Daily Stock Report (Unedited) Energy stocks started supporting market Dear Members, On Wednesday market recovered sharply after OPEC decided to cut 20% production
Monday s trading range for Stocks & Indexes (Unedited copy)
") Edition: 541 22 July 2014 Monday s trading range for Stocks & Indexes (Unedited copy) Dear Members, On Monday traders remained very cautious due to geo-politics tensions also on other hand USA investors
Edition: 541 22 July 2014 Monday s trading range for Stocks & Indexes (Unedited copy) Dear Members, On Monday traders remained very cautious due to geo-politics tensions also on other hand USA investors
High Probability ETF Trading For All
 High Probability ETF Trading For All Version 2.7 Strategy Report Chris White, August 2012 Includes results to end of July 2012 Contents Disclaimer... 2 Summary... 3 The High Probability ETF Trading book
13 April US Equity Indices: the land of the bearish rising wedge. Walter Zimmermann United ICAP. US Equity Indices 13 Apr
 - 1-13 April 2015 : the land of the bearish rising wedge Walter Zimmermann United ICAP The market commentary contained in this document represents the opinions of the author. Such opinions are subject
Weekly outlook for May 21 - May 25, 2018
 Weekly outlook for May 21 - May 25, 2018 Summary The S&P500 index is expected to hold up for a higher level. The market broke to the upside from a symmetrical triangle pattern and is consolidating above
Daily Flash News
 Daily Flash News 2043 27 March 2014 Thursday s Flash-news (Unedited) Dear Members, On Wednesday once again, the US market fell sharply on the selling pressure. Big tech names, especially social networks
Different Classes Of Divergence
 Russ Horn Presents Different Classes Of Divergence RISK DISCLOSURE STATEMENT / DISCLAIMER AGREEMENT Trading any financial market involves risk. This report and all and any of its contents are neither a
Market Observations - as of Apr 20, 2018
 Market Observations - as of Apr 20, 2018 By Carl Jorgensen - For Objective Traders - For educational purposes only. Not Financial Advice. The slowly fading volatility we saw last week continued the first
Global Bear Market at our Doorstep?
 6 June 2012 Global Bear Market at our Doorstep? by William Cai, Vice President, Personal Financial Services This article was featured in the Jun 2012 issue of The Business Times. Below is the original
Market Observations - as of Sep 7, 2018
 Market Observations - as of Sep 7, 2018 By Carl Jorgensen - For Objective Traders - For educational purposes only. Not Financial Advice. Last week we saw a strong and broad rally to new all time highs
Investors Observer Workshop. Wednesday, November 29, 4 pm ET
 Investors Observer Workshop Wednesday, November 29, 4 pm ET Debby Clowney MBA, Chicago Booth BA, U. of Pennsylvania 20+ years options experience Worked on Wall Street Consultant for KPMG Workshop Coach:
Sycamore Market Analysis
 Sycamore Market Analysis September 30, 2015 The third quarter came to an end with big gains for stocks. The rally did not quite reverse the effect of selling on Monday though with the S&P 500 still down
High Probability ETF Trading For All
 High Probability ETF Trading For All Version 2.10 Strategy Report Chris White, March 2014 Includes full year results 01/01/2009 to 12/31/13 And Last 3 months results (01/12/13 to 02/28/14) Contents Disclaimer...
Canada Jobs Sparkle, Trade Deficits Widen, Houses and Ships Signal Slowdown, Dollar Gains, Gold Corrects
 Technical Scoop E-Commentary March 11 2019 From David Chapman, Chief Strategist dchapman@enrichedinvesting.com For Technical Scoop enquiries: 416-523-5454 For Enriched Investing TM strategy enquiries and
The Investors Newsletter
 I N S I D E T H I S I S S U E 1 Perspectives 2 Summary of Indexes 3 Fundamentals & Indicators 4 Index Chart & Analysis economic reports from the past quarter are not indicating the push into higher prices
Market Observations - as of May 18, 2018
 Market Observations - as of May 18, 2018 By Carl Jorgensen - For Objective Traders - For educational purposes only. Not Financial Advice. After about 4 weeks of a relatively flat horizontal market (in
Contents: Top 40 Chart ; Currency ; Charts of Interest ; Scatter Graph ; Relative Rotation Graph ; Stats. Top 40 Chart
 Contents: Top 40 Chart ; Currency ; Charts of Interest ; Scatter Graph ; Relative Rotation Graph ; Stats Top 40 Chart 1 Last week we saw the Top 40 approaching some moving average resistances, we have
Weekly outlook for May 1 May
 Weekly outlook for May 1 May. 5 2017 TREND DIRECTION S&P 500 Oil Gold Short Term Intermediate-Term Long Term strong weak strong strong neutral Strong weak weak weak Summary The S&P500 index is expected
The Launchpad Strategy
 presented by Thomas Wood MicroQuant SM Divergence Trading Workshop Day One The Launchpad Strategy Risk Disclaimer Trading or investing carries a high level of risk, and is not suitable for all persons.
TMT Deep Dive 2/20/2017
 60 Deep Dive 2/20/2017 Technology continues its surge as absolute and relative prices reach new highs on a cap, equal weight, and global basis. Tech remains our top ranked sector however, our sector rankings
Weekly Technical Review
 Ucap Hong Kong Asset Management Limited Weekly Technical Review 8 th December 2015 Highlights (1) Equity Markets MSCIWorldIndex Weekly We are currently retesting the 1 715-25 resistance& a weekly break
Divergence and Momentum Trading
 presented by Thomas Wood MicroQuant SM Divergence Trading Workshop Day One Divergence and Momentum Trading Risk Disclaimer Trading or investing carries a high level of risk, and is not suitable for all
PLEASE SEE IMPORTANT LEGAL DISCLAIMER ON LAST PAGE
 Page 1 Page 3 Page 6 Page 7 Page 8 The Market: Choppiness Anticipated New Ideas: LQD, MSFT, BA Updates: JCP, AAPL, RVBD, XLI, JPM Today s Indicator Reader Feedback & Questions: SDS, XEC, SWY The Market
Lara s Weekly. S&P500 + GOLD + USOIL Elliott Wave & Technical Analysis. Lara Iriarte CMT 23 February, 2018
 Lara s Weekly S&P500 + GOLD + USOIL Elliott Wave & Technical Analysis Lara Iriarte CMT 23 February, 2018 S&P 500 Contents S&P 500 GOLD USOIL About Disclaimer 3 18 36 48 48 S&P 500 S&P 500 Upwards movement
Wednesday s trading range for Stocks & Indexes (Unedited copy)
") Edition: 542 23 July 2014 Wednesday s trading range for Stocks & Indexes (Unedited copy) Dear Members, On Tuesday most of global market traded positive and USA market also closed sharply higher. As mentioned
Edition: 542 23 July 2014 Wednesday s trading range for Stocks & Indexes (Unedited copy) Dear Members, On Tuesday most of global market traded positive and USA market also closed sharply higher. As mentioned
Daily Commentary. Seattle Technical Advisors.com. Developed Markets
 Daily Commentary Seattle Technical Advisors.com Ed Carlson, CMT SeattleTA.618@gmail.com Developed Markets US Equities rallied again on Wednesday; SPX +8.94, DJIA +83.55, but NASDAQ +22.67. With one more
Chart 1: Dow Jones Industrial Average. Chart 2: Dow Jones Transportation Average
 December 17th, 2018 1 You are probably going to hear a lot about Dow Theory in the coming days and weeks. Just like the death crosses that have been occurring in several broad market indices, Dow Theory
Market Observations as of Sept 15, 2017
 Market Observations as of Sept 15, 2017 By Carl Jorgensen - For Objective Traders - For educational purposes only. Not Financial Advice. We saw a quiet week last week, with consolidation wedge patterns
Weekly outlook for April 30 May
 Weekly outlook for April 30 May 4 2018 Summary The S&P500 index is having trouble deciding if it will rally or decline. This indecision makes trading less profitable. Wait for a break-out direction to
BASIC TECHNICAL ANALYSIS
 BASIC TECHNICAL ANALYSIS TECHNICAL ANALYSIS ONLINE TRAINING PROGRAM - YOU WILL UNDERSTAND BASIC CHART READING - YOU WILL ANALYZE YOUR CURRENT STOCKS - YOU WILL YOU USE YOUR COMPUTER TO SEARCH FOR SIGNALS
Market Maps. Bob Dickey, Technical Strategist, Portfolio Advisory Group. March RBC Capital Markets, LLC / Portfolio Advisory Group
 Market Maps Bob Dickey, Technical Strategist, Portfolio Advisory Group RBC Capital Markets, LLC / Portfolio Advisory Group All values in U.S. dollars and priced as of February 28, 2019, unless otherwise
Agenda. Who is Recognia. Event Driven Technical Analysis. Types of Technical Events. Finding and Validating Ideas using Recognia Q & A
 Disclaimer The information presented here is for educational and informational purposes only. The inclusion of any specific securities detailed is for illustrative purposes only. No information contained
Gold, Mining Stocks on the Verge of a Major Bull Market
 Gold, Mining Stocks on the Verge of a Major Bull Market By Robert McHugh, Ph.D. In looking at the charts for Gold, Silver and Mining Stocks, it is clear that patterns and wave mappings suggest a bottom
Patterns Profits & Peace of Mind - Page 1-01/18/11
 Published by TFNN, Corp. ~ 601 Cleveland Street, Ste 618 Clearwater, FL 33755 ~ 1-877-518-9190 ~ http://www.tfnn.com ~ Copyright 2010 ~ All Rights Reserved 01-18-11 In last week's letter, I mentioned how
Market Maps. Bob Dickey, Technical Strategist, Portfolio Advisory Group. April RBC Capital Markets, LLC / Portfolio Advisory Group
 Market Maps Bob Dickey, Technical Strategist, Portfolio Advisory Group RBC Capital Markets, LLC / Portfolio Advisory Group All values in U.S. dollars and priced as of March 29, 2018, unless otherwise noted
Thank you For Reading
 Thank you For Reading Welcome to the FIFTH issue of the TradingFibz, LLC weekly supplemental newsletter. It is my hope that the newsletter will take on a new look and add in additional features to make
However, while prices are likely to fall a bit further, we also continue to believe that we could be with a. Wednesday, November
 Wednesday, November 28 2018 In our last update, we noted that Gold Stocks had resistance in the $19.75 to $19.80 area and that the odds were about 62% that GDX could be near a short term high of importance.
Four Pillars Finance Newsletter
 Four Pillars Finance Newsletter Issue #103 (5 November 2009) The Nasdaq market failed to break significantly higher and then fall back, as we predicted last month. November could produce yet another attempt
Leadership Continues To Test Support
 Leadership Continues To Test Support I am going to continue to highlight the pattern of the leader off the 2009 low (Semiconductors) until a breakout of 2000 highs or a breakdown of 2-year rising support
Williams Percent Range
 Williams Percent Range (Williams %R or %R) By Marcille Grapa www.surefiretradingchallenge.com RISK DISCLOSURE STATEMENT / DISCLAIMER AGREEMENT Trading any financial market involves risk. This report and
US Financial Market Chart Book for February/March February 23, 2012
 US Financial Market Chart Book for February/March 2012 February 23, 2012 US Financial Market Chart Book Executive Summary: February 23 rd 2012 U.S. Stocks: The benchmark S&P 500 and bellwether Dow Jones
Quick Takes Pro Technical Analysis for Everyone
 Quick Takes Pro Technical Analysis for Everyone Michael Kahn Research LLC May 21, 2014 - Stocks fell and once again small caps tanked about twice as hard as big caps. Considering that they rallied the
Morning Trading Comments
 Wednesday, June 13, 2018 1 Morning Trading Comments SUMMARY OF TRADING VIEWS The S&P 500 index is now close to the 2800 area, a potential important resistance zone. It will be interesting to see how this
ChartWorks. PUBLISHED BY INSTITUTIONAL ADVISORS September 7, 2009
 ChartWorks PUBLISHED BY INSTITUTIONAL ADVISORS September 7, 2009 Technical observations of RossClark@shaw.ca Gold... couldn t be better. We ve watched patiently, monitoring the action in anticipation of
Candlestick Forum Long Term Stock Picks Newsletter December, 2015
 Candlestick Forum Long Term Stock Picks Newsletter December, 2015 Current Market Outlook: Remain bullish for now. It s hard to say much more than stay bullish in the current market environment. The major
Gold, and Mining Stocks Trader Monday, March 04, :57 AM Published by The Wall Street Examiner
 Monday, March 04, 2019 8:57 AM Published by The Wall Street Examiner Cycle Phase/PTT Projection 9-12 Month Top-Down/11-24 Weeks 1330 Done 13/17 Week Down/20? 6-7 Week Down/
Canadian Technical Comment
 October 15 2017 TSX: Shift to defense underway as near-term pullback looms Summary Recommendation: For long-term investment managers with cash on hand, we would wait for a short-term (2-4 week) corrective
1 P a g e. Summary. However, a move over SPX2817 from current levels will mean we re still dealing with a larger, more complex bounce to SPX
 Summary Last week I provided some additional information from John Murphy and about typical end-of-bull sector rotation as added weight of evidence for a larger correction being underway. This week the
THE ROSEN MARKET TIMING LETTER. panzerlied.mp3
 THE ROSEN MARKET TIMING LETTER PRECIOUS METALS - FOREX - STOCK INDICES - COMMODITIES https://www.deltasociety.com/content/ron-rosen-precious-metals-timing-letter RONALD L. ROSEN September 22, 2018 SATURDAY
1 P a g e. Executive Summary
 Executive Summary After having reached SPX2484, 1p short of my ideal SPX24585-2505 target zone, on July 27 and selling off intra-day the S&P500 hasn t made a higher high and has remained flat the past
Last Gasp in the Dollar. Market Update May 18, Seattle Technical Advisors
 SeattleTA provides investment managers with technical analysis of the equity, fixed-income, commodity, and currency markets. While equities are expected to take a hit this week, the big news is expected
Weekly Market Summary
 Weekly Market Summary April 24, 2016 by Urban Carmel of The Fat Pitch Summary: SPY made a new all-time high this week. The short and long term trend is higher. Despite a gain of 16% over the past 10 weeks,
Forex Sentiment Report Q2 FORECAST WEAK AS LONG AS BELOW April
 Forex Sentiment Report 08 April 2015 www.ads-securities.com Q2 FORECAST WEAK AS LONG AS BELOW 1.1200 Targets on a break of 1.1534/35: 1.1740/50 1.1870/75 1.2230/35 Targets on a break of 1.0580/70: 1.0160
GETTING STARTED WITH THE SECTOR TIMING REPORT
 Quick start guide to report GETTING STARTED WITH THE SECTOR TIMING REPORT 1. 2. 3. 4. 5. 6. 7. CONSULT WITH FINANCIAL ADVISOR A financial advisor can establish a financial plan and investment guidelines
The four year cycle revisited For members and families only, please do not forward as this tutorial will not be posted to the public.
 The four year cycle revisited 07-0421 For members and families only, please do not forward as this tutorial will not be posted to the public. A lot of my energy has been devoted to the gold sector these
1 P a g e. Executive Summary
 Executive Summary Price finally reached our expect SPX2112-2120 and the negative divergences that started to creep in on the daily TIs finally also took their toll over the past 2 days. The weekly charts
Real-time Analytics Methodology
 New High/Low New High/Low alerts are generated once daily when a stock hits a new 13 Week, 26 Week or 52 Week High/Low. Each second of the trading day, the stock price is compared to its previous 13 Week,