7409 Market Street Wilmington, NC 28411
|
|
|
- Gerald Justin Lane
- 6 years ago
- Views:
Transcription
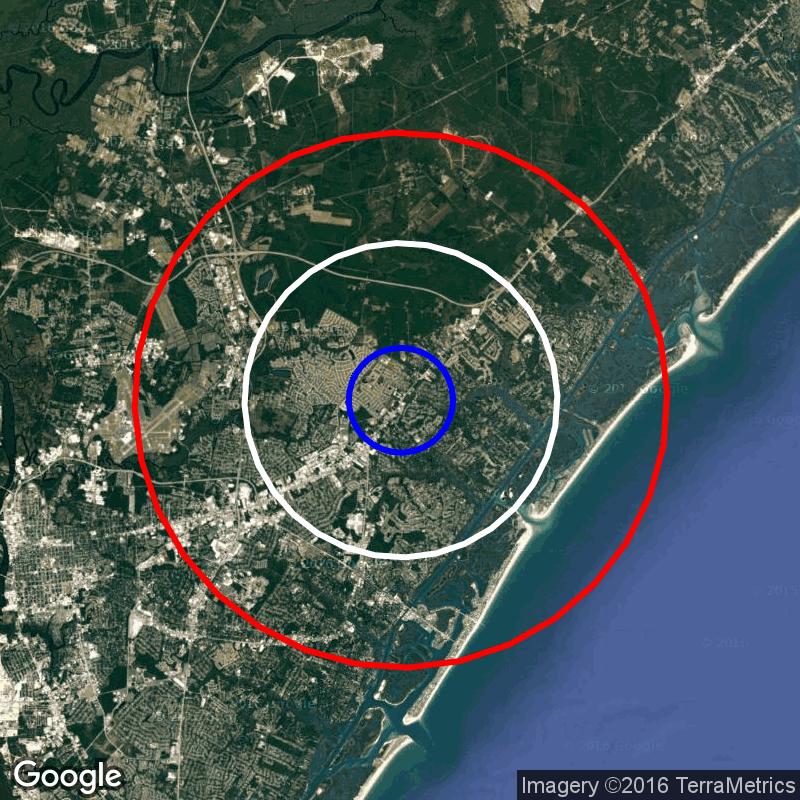
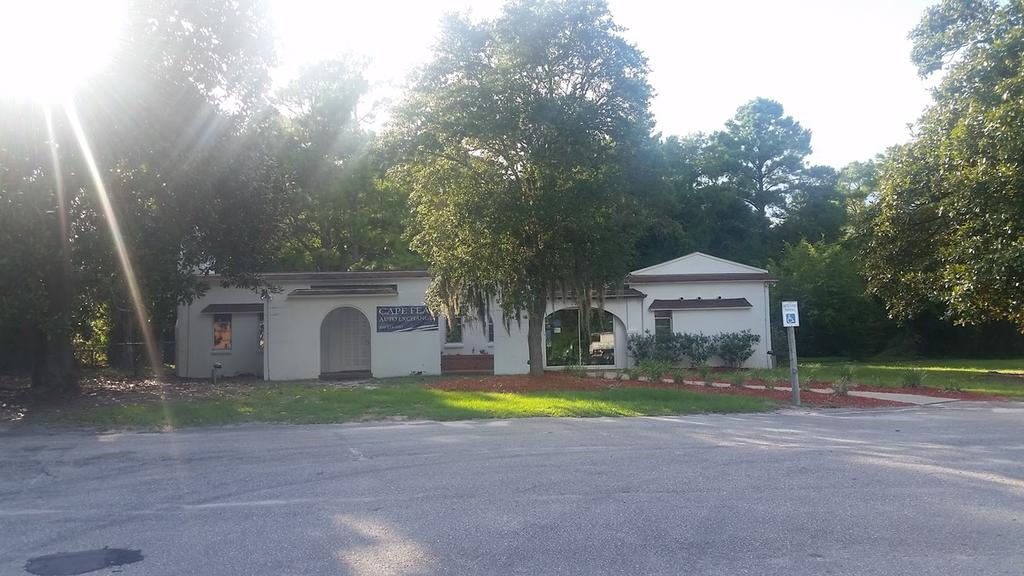
1 Demographic Report 7409 Market Street


2 Employment by Distance Distance Employed Unemployed Unemployment Rate 1-Mile 2, % 3-Mile 17, % 5-Mile 33,297 1, %
3 Labor & Income Agriculture Mining Construction Manufacturing Wholesale Retail Transportaion Information Professional Utility Hospitality Pub-Admin Other 1-Mile Mile ,272 1, ,199 1, ,364 3,585 2, ,540 5-Mile ,338 2,747 1,289 4,062 1, ,917 6,893 4,196 1,089 3,094 Median Household Income 1-Mile $14, Mile $41, Mile $49, Average Household Income 1-Mile $17, Mile $47, Mile $55, Aggregate Household Income 1-Mile $133,396, Mile $995,057, Mile $2,007,808, Education 1-Mile Pop > 25 3,053 High School Grad 673 Some College 745 Associates 365 Bachelors 781 Masters 150 Prof. Degree 47 Doctorate 11 3-mile 22,104 5,139 5,232 2,390 5,561 1, mile 45,244 10,466 10,294 4,401 11,910 2, Tapestry 1-Mile Expensive Homes 0 % Households with 4+ Cars 17 % Military Households 33 % Mobile Homes 17 % New Homes 86 % New Households 22 % Public Transportation Users 1 % Teen's 23 % Vacant Ready For Rent 5 % Young Wealthy Households 17 % 3-mile 28 % 50 % 66 % 62 % 187 % 60 % 4 % 58 % 31 % 20 % 5-mile 81 % 62 % 41 % 85 % 183 % 86 % 5 % 59 % 69 % 36 % This Tapestry information compares this selected market against the average. If a tapestry is over 100% it is above average for that statistic. If a tapestry is under 100% it is below average.
4 Expenditures 1-Mile % Total Expenditures 87,335,880 Average annual household 51,812 Food 6, % Food at home 4,210 Cereals and bakery products 590 Cereals and cereal products 206 Bakery products 384 Meats poultry fish and eggs 865 Beef 213 Pork 157 Poultry 161 Fish and seafood 138 Eggs 63 Dairy products 435 Fruits and vegetables 826 Fresh fruits 128 Processed vegetables 153 Sugar and other sweets 154 Fats and oils 128 Miscellaneous foods 791 Nonalcoholic beverages 364 Food away from home 2,559 Alcoholic beverages 415 Housing 18, % Shelter 11,259 Owned dwellings 7,079 Mortgage interest and charges 3,699 Property taxes 2,234 Maintenance repairs 1,145 Rented dwellings 3,262 Other lodging 918 Utilities fuels 4,193 Natural gas 440 Electricity 1,637 Fuel oil 170 Telephone services 1,316 Water and other public services 628 Household operations 1, % Personal services 389 Other household expenses 853 Housekeeping supplies 646 Laundry and cleaning supplies 163 Other household products 370 Postage and stationery 112 Household furnishings 1,113 Household textiles 77 Furniture 170 Floor coverings 3 Major appliances 165 Small appliances 104 Miscellaneous 593 Apparel and services 1, % Men and boys 321 Men 16 and over 263 Boys 2 to Women and girls Mile % 638,549,856 52,559 6, % 4, , , % 11,347 7,200 3,775 2,268 1,156 3, , , , , % , , % Mile % 1,283,099,907 49,855 6, % 4, , , % 10,797 6,753 3,533 2,127 1,093 3, , , , , % , , %
5 Women 16 and over 495 Girls 2 to Children under Expenditures (Continued) 1-Mile % Total Expenditures 87,335,880 Average annual household 51,812 Transportation 6, % Vehicle purchases 1,181 Cars and trucks new 176 Cars and trucks used 952 Gasoline and motor oil 2,298 Other vehicle expenses 2,723 Vehicle finance charges 228 Maintenance and repairs 898 Vehicle insurance 1,183 Vehicle rental leases 388 Public transportation 534 Health care 4, % Health insurance 2,393 Medical services 835 Drugs 433 Medical supplies 130 Entertainment 2, % Fees and admissions 647 Television radios 1,076 Pets toys 980 Personal care products 663 Reading 77 Education 1,349 Tobacco products 396 Miscellaneous % Cash contributions 1,627 Personal insurance 6,136 Life and other personal insurance 235 Pensions and Social Security 5,900 3-Mile % 638,549,856 52,559 6, % 1, ,307 2, , , % 2, , % 669 1,081 1, , % 1,617 6, ,117 5-Mile % 1,283,099,907 49,855 6, % 1, ,200 2, , , % 2, , % 626 1, , % 1,509 5, ,700 Estimated Households Housing Occupied By Housing Occumpancy Distance Year Projection 2000 Change 1 Person Family Owner Renter Vacant 1-Mile % , Mile % Mile % Mile % , Mile % Mile %
Daniel Jung CRENSHAW BLVD CRENSHAW BLVD INGLEWOOD CA, CA Priming Capital 6 Centerpointe Dr La Palma, CA
 11225 CRENSHAW BLVD 11225 CRENSHAW BLVD INGLEWOOD CA, CA 90303 Property Type Retail Building Size Owner (Legal) Property Subtype Auto Dealer Office SF Owner (True) Zoning Industrial SF County Los Angeles
Procter Properties P.O. Box 3484 Greensboro, NC
 Procter Properties P.O. Box 3484 Greensboro, NC 27402 3208 West Gate City Boulevard 3208 W Gate City Blv Greensboro, NC 27407 Property Type Retail Building Size 11,747 SF Owner (Legal) Property Subtype
$1,600,000. Boston Reid LAKESIDE BUSINESS PARK. 117 Crosslake Park Drive Mooresville, NC SITE FEATURES. Lead 2 Real Estate Group
 LAKESIDE BUSINESS PARK 117 Crosslake Park Drive Mooresville, NC 28117 $1,600,000 Marketed By SITE FEATURES 17,000 + SF Industrial Building on 2.6 Acres Located in Lakeside Business Park High Power for
March Campaign ROI
 March 2015 Campaign ROI Convergent Team, Attached is your Campaign ROI Report. This report should not only help in raising the sights of the campaign in general, but can also be used to make specific solicitations
Bureau of Statistics and Plans Business and Economic Statistics Program Government of Guam
 ============================================================================ GUAM CONSUMER PRICE INDEX ST QUARTER 2008 Cost of Living Section VOL. XXXIV, No. Bureau of Statistics and Plans Business and
Messages and Communications
 Speaker Won Pat Messages and Communications Speaker Won Pat To: Guam Legislature Clerks Office Mon. Jan 5. 2015 at 9:28AM
Headline and Core Inflation April 2018
 Apr-16 Apr-13 Jul-13 Oct-13 Jan-1 Apr-1 Jul-1 Oct-1 Jan-15 Apr-15 Jul-15 Oct-15 Jan-16 Apr-16 Central Bank of Egypt Headline and Core Inflation April 218 Annual headline 1/ (urban) inflation continued
Headline and Core Inflation March 2018
 Mar-16 Mar-13 May-13 Jul-13 Sep-13 Nov-13 Jan-1 Mar-1 May-1 Jul-1 Sep-1 Nov-1 Jan-15 Mar-15 May-15 Jul-15 Sep-15 Nov-15 Jan-16 Mar-16 Central Bank of Egypt Headline and Core Inflation March 218 Annual
Headline and Core Inflation February 2018
 Feb-16 Feb-13 May-13 Aug-13 Nov-13 Feb-1 May-1 Aug-1 Nov-1 Feb-15 May-15 Aug-15 Nov-15 Feb-16 Central Bank of Egypt Headline and Core Inflation February 218 Annual headline 1/ and core 2/ (urban) inflation
APPLICATIONS OF ECONOMIC DATA
 APPLICATIONS OF ECONOMIC DATA Spring Data Users Workshop April 2004 Tony Sylvester Bureau of Business and Economic Research University of New Mexico (505) 277-7062 tsylvstr@unm.edu 1 EXAMPLES: 1. Create
Headline and Core Inflation December 2017
 Dec-15 Jan-16 Mar-16 May-16 Jul-16 Sep-16 Nov-16 Jan-17 Mar-17 May-17 Jul-17 Sep-17 Nov-17 Dec-12 Mar-13 Jun-13 Sep-13 Dec-13 Mar-1 Jun-1 Sep-1 Dec-1 Mar-15 Jun-15 Sep-15 Dec-15 Mar-16 Sep-16 Mar-17 Sep-17
Consumer Expenditures in 2001
 Cornell University ILR School DigitalCommons@ILR Federal Publications Key Workplace Documents 4-2003 Consumer Expenditures in 2001 Bureau of Labor Statistics Follow this and additional works at: http://digitalcommons.ilr.cornell.edu/key_workplace
Consumer Expenditures in 2000
 Cornell University ILR School DigitalCommons@ILR Federal Publications Key Workplace Documents 4-2002 Consumer Expenditures in 2000 Bureau of Labor Statistics Follow this and additional works at: http://digitalcommons.ilr.cornell.edu/key_workplace
NCPI. August Namibia Consumer Price index. Namibia Consumer Price index - August
 NCPI Namibia Consumer Price index August 2018 Namibia Consumer Price index - August 2018 1 Mission Statement Leveraging on partnerships and innovative technologies, to produce and disseminate relevant,
Headline and Core Inflation December 2009
 Headline and Core Inflation December 2009 Headline CPI published by the Central Agency for Public Mobilization and Statistics (CAPMAS) on January 10, 2010, declined by 1.3 percent (m/m) in December 2009,
Headline and Core Inflation December 2010
 Headline and Core Inflation December 2010 Headline CPI published by CAPMAS on January 10, 2011 decelerated by 0.68 percent (m/m) in December following the 0.82 percent (m/m) decline in November. Despite
NCPI. March Namibia Consumer Price index. Namibia Consumer Price index - March
 NCPI Namibia Consumer Price index March 2018 Namibia Consumer Price index - March 2018 1 Mission Statement Leveraging on partnerships and innovative technologies, to produce and disseminate relevant, quality,
BLS. Consumer Expenditures in U.S. Department of Labor U.S. Bureau of Labor Statisitics March Report 1023
 Consumer Expenditures in 2008 U.S. Department of Labor U.S. Bureau of Labor Statisitics March 2010 Report 1023 C 1 onsumer spent $50,486, on average, in 2008, a 1.7-percent increase over the previous year.
June Namibia Consumer Price Index. Tel: Fax:
 Namibia Consumer Price Index N C P I June 2017 Namibia Statistics Agency P.O. Box 2133, FGI House, Post Street Mall, Windhoek, Namibia Tel: +264 61 431 3200 Fax: +264 61 431 3253 Email: info@nsa.org.na
NCPI. Namibia Consumer Price index. January 2018
 NCPI Namibia Consumer Price index January 2018 Namibia Consumer Price index - January 2018 1 Mission Statement Leveraging on partnerships and innovative technologies, to produce and disseminate relevant,
CONSUMER PRICE INDEX (Base: November 1996=100) ANNUAL REVIEW & DETAILED SUB-INDICES RELEASE. December 2000
 ANNUAL REVIEW & DETAILED SUB-INDICES RELEASE. December 2000") CONSUMER PRICE INDEX (Base: November 1996=100) ANNUAL REVIEW & DETAILED SUB-INDICES RELEASE December 2000 This release provides a summary analysis of the major price developments within the main CPI commodity
CONSUMER PRICE INDEX (Base: November 1996=100) ANNUAL REVIEW & DETAILED SUB-INDICES RELEASE December 2000 This release provides a summary analysis of the major price developments within the main CPI commodity
Consumer Price Index (CPI). Base 2011 January Monthly change Change over last Annual change
. Base 2011 January Monthly change Change over last Annual change") 14 February 2014 Consumer Price Index (CPI). Base 2011 January 2014 all index Monthly change Change over last Annual change January January 1.3 1.3 Main results The annual change of the CPI for the of
14 February 2014 Consumer Price Index (CPI). Base 2011 January 2014 all index Monthly change Change over last Annual change January January 1.3 1.3 Main results The annual change of the CPI for the of
Demographics for 2020 S Main St, South Jacksonville, Illinois, United States
 Demographics for 2020 S Main St, South Jacksonville, Illinois, United States Population Population Total Population (US Census 2010) 3,200 19,103 24,773 Total Population (Current Year) 3,168 18,852 24,419
Consumer Price Index. June Business and economy
 Consumer Price June 2017 Business and economy Table of Contents A note to the reader...ii 1 MONTHLY CHANGE OF THE CPI... 1 1.1 CPI AND INFLATION... 1 1.2 CHANGES IN SECTOR... 1 1.3 CHANGES IN CATEGORIES
Consumer Price Index. March Business and economy
 Consumer Price March 2018 Business and economy Table of Contents A note to the reader...ii 1 MONTHLY CHANGE OF THE CPI... 1 1.1 CPI AND INFLATION... 1 1.2 CHANGES IN SECTOR... 1 1.3 CHANGES IN CATEGORIES
Consumer Price Index. December Business and economy
 Consumer Price December 2018 Business and economy Table of Contents A note to the reader...ii 1 MONTHLY CHANGE OF THE CPI... 1 1.1 CPI AND INFLATION... 1 1.2 CHANGES IN SECTOR... 1 1.3 CHANGES IN CATEGORIES
Consumer Price Index. February Business and economy
 Consumer Price February 2018 Business and economy Table of Contents A note to the reader...ii 1 MONTHLY CHANGE OF THE CPI... 1 1.1 CPI AND INFLATION... 1 1.2 CHANGES IN SECTOR... 1 1.3 CHANGES IN CATEGORIES
Report Contents. PCensus Online Sample Report AGS Consumer Spending. Powered by PCensus Page 1
 Powered by PCensus Page 1 Report Contents Map Consumer Spending Summary Consumer Spending Apparel Consumer Spending Footwear, Apparel Services and Accessories Consumer Spending Contributions and Education
Consumer Price Index. September Business and economy
 Consumer Price September 2018 Business and economy Table of Contents A note to the reader...ii 1 MONTHLY CHANGE OF THE CPI... 1 1.1 CPI AND INFLATION... 1 1.2 CHANGES IN SECTOR... 1 1.3 CHANGES IN CATEGORIES
Overall index Monthly change Change over last Annual change
 13 February 2015 Consumer Price Index (CPI). Base 2011 January 2015 all index Monthly change Change over last Annual change January 1.6 1.6 1.3 Main results The annual change of the CPI for the of January
Savannah Agee Direct:
 Demographics for 7071 S Bilbo Rd, Orange, Texas 77632, United States Savannah Agee Direct: 409-833-5055 Population Population Total Population (US Census 2010) 358 4,419 8,486 Total Population (Current
Study Area Maps. Profile Tables. The CORE Shopping Centre Pitney Bowes 2018 Consumer Spend Potential
 Powered by Sitewise Page 1 Study Area Maps Profile Tables s Summary Food Shelter Oation Clothing and Accessories Transportation Health Care Personal Care Recreation Education and Reading Materials Tobacco
THE CAYMAN ISLANDS CONSUMER PRICE INDEX REPORT: SEPTEMBER 2017 (Inaugural Report Using the 2016 CPI Basket) (Date of release: November 24, 2017)
 (Date of release: November 24, 2017)") THE CAYMAN ISLANDS CONSUMER PRICE INDEX REPORT: SEPTEMBER 2017 (Inaugural Report Using the 2016 CPI Basket) (Date of release: November 24, 2017) CPI Increased by 1.4% in the Third Quarter of 2017 This
THE CAYMAN ISLANDS CONSUMER PRICE INDEX REPORT: SEPTEMBER 2017 (Inaugural Report Using the 2016 CPI Basket) (Date of release: November 24, 2017) CPI Increased by 1.4% in the Third Quarter of 2017 This
CAYMAN ISLANDS CONSUMER PRICE REPORT: 2010 ANNUAL INFLATION (Date: February 9, 2011)
") CAYMAN ISLANDS CONSUMER PRICE REPORT: 2010 ANNUAL INFLATION (Date: February 9, 2011) Consumer Price Index (CPI) Increased by 0.3% in 2010 This report is a consolidated report of the average CPI in 2010
CAYMAN ISLANDS CONSUMER PRICE REPORT: 2010 ANNUAL INFLATION (Date: February 9, 2011) Consumer Price Index (CPI) Increased by 0.3% in 2010 This report is a consolidated report of the average CPI in 2010
Consumer Price Index (CPI). Base 2016 Harmonised Index of Consumer Prices (HICP). Base 2015 September 2018
. Base 2016 Harmonised Index of Consumer Prices (HICP). Base 2015 September 2018") 11 October 2018 Consumer Price Index (CPI). Base 2016 Harmonised Index of Consumer Prices (HICP). Base 2015 September 2018 Main results The annual rate of CPI for the month of September stands at 2.3%,
11 October 2018 Consumer Price Index (CPI). Base 2016 Harmonised Index of Consumer Prices (HICP). Base 2015 September 2018 Main results The annual rate of CPI for the month of September stands at 2.3%,
Consumer Price Index Monthly September 2006
 Consumer Price Index Monthly September 2006 CPI and Inflation Figure 1: change CPI per Month of 2005-2006 The consumer price index (CPI) 1 of the total population for the month of September 2006 is 121.7.
THE CAYMAN ISLANDS CONSUMER PRICE INDEX REPORT: DECEMBER 2017 (Date of release: February 15, 2018)
") THE CAYMAN ISLANDS CONSUMER PRICE INDEX REPORT: DECEMBER 2017 (Date of release: February 15, 2018) Average CPI Rose by 1.9% in 2017 This report presents the average CPI for 2017 and the results of the
THE CAYMAN ISLANDS CONSUMER PRICE INDEX REPORT: DECEMBER 2017 (Date of release: February 15, 2018) Average CPI Rose by 1.9% in 2017 This report presents the average CPI for 2017 and the results of the
IAG Commercial. Albertville Retail - Land. For Sale. Prepared By:
 Albertville Retail - Land For Sale Albertville Retail - Land 6600 Laketowne Place Albertville, MN 55301 Prepared By: IAG Commercial 222 South Ninth Street, Suite 1600 Minneapolis, MN 55402 Jeff LaFavre,
THE CAYMAN ISLANDS CONSUMER PRICE INDEX REPORT: JUNE 2016 (Date of release: August 10, 2016)
") THE CAYMAN ISLANDS CONSUMER PRICE INDEX REPORT: JUNE 2016 (Date of release: August 10, 2016) CPI Falls by 0.8% in the Second Quarter of 2016 The overall Consumer Price Index (CPI) for the second quarter
THE CAYMAN ISLANDS CONSUMER PRICE INDEX REPORT: JUNE 2016 (Date of release: August 10, 2016) CPI Falls by 0.8% in the Second Quarter of 2016 The overall Consumer Price Index (CPI) for the second quarter
The Consumer Price Index
 Catalogue no. 62-001-X The Consumer Price Index How to obtain more information For information about this product or the wide range of services and data available from Statistics Canada, visit our website
CONSUMER PRICE INDEX
 1. INTRODUCTION CONSUMER PRICE INDEX (Base period: July 2006 June 2007 = 100) Year This issue of Economic and Social Indicators presents the Consumer Price Index (CPI) for the year. The methodology used
2 Broadway Methuen Site: Primary Market
 2 Broadway Methuen Site: mi.5 1 1.5 Copyright 1988-23 Microsoft Corp. and/or its suppliers. All rights reserved. http://www.microsoft.com/mappoint Copyright 22 by Geographic Data Technology, Inc. All rights
Statistical release P0141
 Statistical release Consumer Price Index September 2010 Embargoed until: 27 October 2010 11:30 Enquiries: Forthcoming issue: Expected release date User information services October 2010 24 November 2010
Overall index Monthly variation Accumulated variation Annual variation January
 15 February 2017 Consumer Price Index (CPI). Base 2016 January 2017 all index Monthly variation Accumulated variation Annual variation January -0.5-0.5 3.0 Main results The annual variation of the CPI
Consumer Price Index (CPI). Base 2016 Harmonised Index of Consumer Prices (HICP). Base 2015 October 2018
. Base 2016 Harmonised Index of Consumer Prices (HICP). Base 2015 October 2018") 14 November 2018 Consumer Price Index (CPI). Base 2016 Harmonised Index of Consumer Prices (HICP). Base 2015 October 2018 Main results The annual variation rate of CPI in October is 2.3%, the same as that
14 November 2018 Consumer Price Index (CPI). Base 2016 Harmonised Index of Consumer Prices (HICP). Base 2015 October 2018 Main results The annual variation rate of CPI in October is 2.3%, the same as that
Data Source: National Bureau of Statistics
 ( Report Date: August 2017 Data Source: National Bureau of Statistics Brief Methodology 1 All Items Index 5 Food Index 6 All Items Less Farm Produce 7 Infographics 9 Statistical News 13 Acknowledgements/Contacts
Statistical release P0141
 Statistical release Consumer Price Index June 2015 Embargoed until: 22 July 2015 10:00 Enquiries: Forthcoming issue: Expected release date Marietjie Bennett / Anita Voges July 2015 19 August 2015 (012)
Consumer Price Index (CPI). Base 2016 Harmonised Index of Consumer Prices (HICP). Base 2015 January 2019
. Base 2016 Harmonised Index of Consumer Prices (HICP). Base 2015 January 2019") 15 February 2019 Consumer Price Index (CPI). Base 2016 Harmonised Index of Consumer Prices (HICP). Base 2015 January 2019 Main results In January, the annual variation rate of the CPI was 1.0%, two tenths
15 February 2019 Consumer Price Index (CPI). Base 2016 Harmonised Index of Consumer Prices (HICP). Base 2015 January 2019 Main results In January, the annual variation rate of the CPI was 1.0%, two tenths
CONSUMER PRICE INDEX
 CONSUMER PRICE INDEX (Base period: January December 2012 = 100) 1 st Quarter 2018 1. INTRODUCTION This issue of Economic and Social Indicators presents the Consumer Price Index (CPI) for the first quarter
Consumer Price Index for the Country s Households
 Consumer Price Index for the Country s Households Consumer Price Index For the Country s Households (National Index) At present, inflation rate is prepared and released by urban and rural households. The
The Consumer Price Index
 Catalogue no. 62-001-X The Consumer Price Index How to obtain more information For information about this product or the wide range of services and data available from Statistics Canada, visit our website
EMPLOYEE TENURE IN 2014
 For release 10:00 a.m. (EDT) Thursday, September 18, 2014 USDL-14-1714 Technical information: (202) 691-6378 cpsinfo@bls.gov www.bls.gov/cps Media contact: (202) 691-5902 PressOffice@bls.gov EMPLOYEE TENURE
CONSUMER PRICE INDEX
 1. INTRODUCTION CONSUMER PRICE INDEX (Base period: January December 2012 = 100) Year 2015 This issue of Economic and Social Indicators presents the Consumer Price Index (CPI) for the year 2015. The methodology
The Consumer Price Index
 Catalogue no. 62-001-X The Consumer Price Index How to obtain more information For information about this product or the wide range of services and data available from Statistics Canada, visit our website
CONSUMER PRICE INDEX
 1. INTRODUCTION CONSUMER PRICE INDEX (Base period: July 2006 June 2007 = 100) 1st Quarter 2010 This issue of Economic and Social Indicators presents the Consumer Price Index (CPI) for the first quarter
CONSUMER PRICE INDEX
 CONSUMER PRICE INDEX (Base period: January December 2012 = 100) 3 rd Quarter 2017 1. INTRODUCTION This issue of Economic and Social Indicators presents the Consumer Price Index (CPI) for the third quarter
Wholesale trade Retail trade. 10 Value of goods in stock. Annual sales of goods
 6324 ESTABLISHMENTS, EMPLOYEES, ANNUAL SALES OF GOODS, VALUE OF GOODS IN STOCK AND SALES FLOOR SPACE OF WHOLESALE AND RETAIL TRADE BY LEGAL ORGANISATION AND SIZE OF EMPLOYEES (19882012) 43624217 3 6 11
Egypt. A: Identification. B: CPI Coverage. Title of the CPI: Consumer Price Index
 Egypt A: Identification Title of the CPI: Consumer Price Index Organisation responsible: Central Agency for Public Mobilization and Statistics (CAPMAS) Periodicity: Monthly Price reference period: January
CPI Detailed Report. For December 1977 Consumer Price Index: U.S. City Average and Selected Areas. Price movements 1
 CPI Detailed Report For Consumer Price Index: U.S. City Average and Selected Areas Contents U.S. DEPARTMENT OF LABOR Ray Marshall, Secretary BUREAU OF LABOR STATISTICS Julius Shiskin, Commissioner OFFICE
Nominal price of a burger in 1955 is $0.15. Nominal price of a burger in 2002 is $0.79.
 Applications: Real versus nominal prices. Nominal price actual selling price. Real price deflated for inflation price. The Consumer Price Index for Urban Wage Earners and Clerical Workers (CPI-W) increased
No 15/96 29 February 1996
 No 15/96 29 February 1996 Interim step towards harmonised measurement of consumer prices NEW WAY OF COMPARING EU INFLATION Required for the assessment of convergence for Economic and Monetary Union An
Understanding the Consumer Price Index (CPI)
") ESO PUBLICATIONS Consumer Price Index (CPI) Reports Quarterly Economic Reports (QER) Labour Force Survey (LFS) Reports Annual Overseas Trade Reports Annual Compendium of Statistics Annual Economics Report
ESO PUBLICATIONS Consumer Price Index (CPI) Reports Quarterly Economic Reports (QER) Labour Force Survey (LFS) Reports Annual Overseas Trade Reports Annual Compendium of Statistics Annual Economics Report
Page 1. The Loop N State St & W Washington St, Chicago IL STI Spending Patterns
 Page 1 The Loop Page -1 Table of Contents N State St & W Washington St, Chicago, IL 60602... 1 Summary... 2 Food: Cereals, Bakery, Meat and Dairy... 4 Food: Fruits, Vegetables... 6 Food: Other Food at
Outline of presentation. National Accounts Office September 2016 Chiba, Japan
 25-27 September 2016 Chiba, Japan National Accounts Office Office of the National Economic and Social Development Board (NESDB) Outline of presentation Short Term Indicator Quarterly Gross Domestic Product
Report on Ward 3. Prepared by the Burlington Economic Development Corporation
 Report on Ward 3 Prepared by the Burlington Economic Development Corporation Contents 1. Business Composition Data... 1 2. Labour Force Data... 3 3. Consumer Spending Data... 5 4. Demographic Data... 6
PCensus for MapInfo. Mission District 20th St & Folsom St, San Francisco CA 94110
 PCensus for MapInfo Page 1 STI 2015 - Spending Pa#erns PCensus for MapInfo Page -1 Table of Contents 20th St & Folsom St, San Francisco, CA 94110... 1 Summary... 2 Food: Cereals, Bakery, Meat and Dairy...
FOR SALE. For More Information:
 FOR SALE 67th Street 3415 67th Place, Vero Beach, FL 32967 PARCEL ID #: 32391000000100000009.1 LOCATION: Great location on the corner of US 1 and Quay Dock Rd with approximately 54 feet of US 1 frontage.
SHOPPING ANNUITY ASSESSMENT
 SHOPPING ANNUITY ASSESSMENT TABLE OF CONTENTS I Shopping Annuity Overview II Where Does The Money Go? III Money Saved is Money Earned Assessment Exercise 1: Time Value RESOURCES www.shoppingannuity.com
Harmonised Index of Consumer Prices (HICP) April 2013
 April 2013") Apr-12 May-12 June-12 July-12 Aug-12 Sep-12 Oct-12 Nov-12 Dec-12 Jan-13 Feb-13 Mar-13 Apr-13 MONTENEGRO STATISTICAL OFFICE RELEASE No: 137 Podgorica, 17 May 2013 When using the data please name the source
Apr-12 May-12 June-12 July-12 Aug-12 Sep-12 Oct-12 Nov-12 Dec-12 Jan-13 Feb-13 Mar-13 Apr-13 MONTENEGRO STATISTICAL OFFICE RELEASE No: 137 Podgorica, 17 May 2013 When using the data please name the source
Meal Plan Pricing. FY 2012 Academic Year: Fall 2011 Spring UNIVERSITY of HOUSTON DINING SERVICES
 Meal Plan Pricing FY 2012 Academic Year: Fall 2011 Spring 2012 UNIVERSITY of HOUSTON DINING SERVICES FSAC? Food Services Advisory Committee Shared governance committee of students, faculty, staff, UH Dining
4575 Bay Rd, Saginaw, MI 48603
 Georges 4575 Bay Rd, Saginaw, MI 48603 Listing ID: 30340682 Status: Active Property Type: Business Opportunity For Sale Industry: Professional Services Size: 6,600 SF Sale Price: $852,000 Sale Terms: Cash
Consumer Price Index
 STATISTICAL RELEASE P0141 Consumer Price Index May 2017 Embargoed until: 21 June 2017 10:00 ENQUIRIES: FORTHCOMING ISSUE: EXPECTED RELEASE DATE Marietjie Bennett / June 2017 19 July 2017 Evashnie Govender
Report Date: May Data Source: National Bureau of Statistics. Brief Methodology 1. All Items Index 5
 ( Report Date: May 2017 Data Source: National Bureau of Statistics Brief Methodology 1 All Items Index 5 Food Index 6 All Items Less Farm Produce 6 Infographics 7 Statistical News 11 Acknowledgements/Contacts
CONSUMER PRICE INDEX DETAILED SUB-INDICES RELEASE. March 2003
 CONSUMER PRICE INDEX (Base: December 2001 =100) DETAILED SUB-INDICES RELEASE March 2003 Annual Inflation falls to 4.9 in March This release provides a summary analysis of the major price developments within
CONSUMER PRICE INDEX
 CONSUMER PRICE INDEX (Base period: January December 2017 = 100) 3 rd Quarter 2018 1. INTRODUCTION This issue of Economic and Social Indicators presents the Consumer Price Index (CPI) for the third quarter
The Consumer Price Index
 Catalogue no. 62-001-X The Consumer Price Index How to obtain more information Specific inquiries about this product and related statistics or services should be directed to: Client Services Unit, Consumer
US Economic Briefing: CPI Inflation Components (3-month basis)
") US Economic Briefing: CPI Inflation Components (-month basis) December 1, 17 Dr. Edward Yardeni 1-7-7 eyardeni@ Debbie Johnson --1 djohnson@ Please visit our sites at blog. thinking outside the box Table
US Economic Briefing: CPI Inflation Components (-month basis) December 1, 17 Dr. Edward Yardeni 1-7-7 eyardeni@ Debbie Johnson --1 djohnson@ Please visit our sites at blog. thinking outside the box Table
Still STRUGGLING. to Make Ends Meet. A Report on Living Wages in Washington State. By Allyson Fredericksen
 Still STRUGGLING to Make Ends Meet A Report on Living Wages in Washington State By Allyson Fredericksen July 2018 ABOUT THE AUTHOR Author and Lead Researcher, Allyson Fredericksen Allyson has produced
US Economic Briefing: CPI Inflation Components (3-month basis)
") US Economic Briefing: CPI Inflation Components (-month basis) November 7, Dr. Edward Yardeni -7-7 eyardeni@ Debbie Johnson - djohnson@ Please visit our sites at blog. thinking outside the box Table Of
US Economic Briefing: CPI Inflation Components (-month basis) November 7, Dr. Edward Yardeni -7-7 eyardeni@ Debbie Johnson - djohnson@ Please visit our sites at blog. thinking outside the box Table Of
Consumer Price Index Detailed Sub-Indices
 An Phríomh-Oifig Staidrimh Central Statistics Office 9 August 2012 Comparison of main CPI divisions to the overall CPI annual - July 2012 01 02 03 04 All Items 1.6 Consumer Price Detailed Sub-Indices July
INCOME, EXPENDITURE AND CONSUMPTION OF HOUSEHOLDS IN 2017
 INCOME, EXPENDITURE AND CONSUMPTION OF HOUSEHOLDS IN 2017 Household income The annual total income average per capita is 5 586 BGN in 2017 and increases by 8.1 compared to 2016. The total income average
Household Budget Survey
 Central Bank of the Islamic Republic of Iran General Directorate of Economic Statistics Household Budget Survey In Urban Areas in Iran 1381 (March 21,2002 March 20,2003) Economic Statistics Bahman 1382
Short-term Inflation analysis and forecast. May 2018 RESEARCH SERVICES DEPARTMENT RESEARCH AND ECONOMIC PROGRAMMING DIVISION
 Short-term Inflation analysis and forecast May 2018 RESEARCH SERVICES DEPARTMENT RESEARCH AND ECONOMIC PROGRAMMING DIVISION c 2018 Bank of Jamaica Nethersole Place Kingston Jamaica Telephone: (876) 922
Short-term Inflation analysis and forecast. October 2018 RESEARCH SERVICES DEPARTMENT RESEARCH AND ECONOMIC PROGRAMMING DIVISION
 Short-term Inflation analysis and forecast October 2018 RESEARCH SERVICES DEPARTMENT RESEARCH AND ECONOMIC PROGRAMMING DIVISION c 2018 Bank of Jamaica Nethersole Place Kingston Jamaica Telephone: (876)
PROPOSED SHOPPING CENTER
 PROPOSED SHOPPING CENTER Southeast Corner I-95 & Highway 192 Melbourne, Florida In a 5 Mile Radius 80,862 Population 32,408 Households $61K Avg HH Income SOONER INVESTMENT Commercial & Investment Real
The US Economic Outlook (with a Fed twist)
") The US Economic Outlook (with a Fed twist) Presentation prepared for the Economic Outlook Conference 2011 January 13, 2011 Chapter 1: Why the FOMC went with QE2, an interpretive dance by David Altig, who
The US Economic Outlook (with a Fed twist) Presentation prepared for the Economic Outlook Conference 2011 January 13, 2011 Chapter 1: Why the FOMC went with QE2, an interpretive dance by David Altig, who
Organisation responsible: Australian Bureau of Statistics (ABS)
") Australia A: Identification Title of the CPI: Consumer Price Index Organisation responsible: Australian Bureau of Statistics (ABS) Periodicity: Quarterly Price reference period: 12 months ended 30 June
Australia A: Identification Title of the CPI: Consumer Price Index Organisation responsible: Australian Bureau of Statistics (ABS) Periodicity: Quarterly Price reference period: 12 months ended 30 June
World Consumer Income and Expenditure Patterns
 World Consumer Income and Expenditure Patterns 2011 www.euromonitor.com iii Summary of Contents Contents Summary of Contents Section 1 Introduction 1 Section 2 Socio-economic parameters 21 Section 3 Annual
PART II: ARMENIA HOUSEHOLD INCOME, EXPENDITURES, AND BASIC FOOD CONSUMPTION
 PART II: ARMENIA HOUSEHOLD INCOME, EXPENDITURES, AND BASIC FOOD CONSUMPTION 89 Chapter 6: Household Income *, Expenditures, and Basic Food Consumption This chapter presents the dynamics of household income,
Short-term Inflation analysis and forecast. January 2018 RESEARCH SERVICES DEPARTMENT RESEARCH AND ECONOMIC PROGRAMMING DIVISION
 Short-term Inflation analysis and forecast January 2018 RESEARCH SERVICES DEPARTMENT RESEARCH AND ECONOMIC PROGRAMMING DIVISION c 2018 Bank of Jamaica Nethersole Place Kingston Jamaica Telephone: (876)
INCOME, EXPENDITURE AND CONSUMPTION OF HOUSEHOLDS IN 2016
 INCOME, EXPENDITURE AND CONSUMPTION OF HOUSEHOLDS IN 2016 Household income The annual total income average per capita is 5 167 BGN in 2016 and increases by 4.3 compared to 2015. The total income average
PRESS RELEASE. The evolution of the Consumer Price Index (CPI) of April 2018 (reference year 2009=100.0) is depicted as follows:
 of April 2018 (reference year 2009=100.0) is depicted as follows:") HELLENIC REPUBLIC HELLENIC STATISTICAL AUTHORITY Piraeus, 10 May 2018 PRESS RELEASE CONSUMER PRICE INDEX: April 2018, annual inflation 0.0% The evolution of the Consumer Price Index (CPI) of April 2018
HELLENIC REPUBLIC HELLENIC STATISTICAL AUTHORITY Piraeus, 10 May 2018 PRESS RELEASE CONSUMER PRICE INDEX: April 2018, annual inflation 0.0% The evolution of the Consumer Price Index (CPI) of April 2018
The impact of the Kenya CT-OVC Program on household spending. Kenya CT-OVC Evaluation Team Presented by Tia Palermo Naivasha, Kenya January 2011
 The impact of the Kenya CT-OVC Program on household spending Kenya CT-OVC Evaluation Team Presented by Tia Palermo Naivasha, Kenya January 2011 Kenya Cash Transfer Program for Orphans and Vulnerable Children
The High (and Rising) Cost of Living in San Diego
 Cost of Living in San Diego") MARCH 2012 WWW.NUSINSTITUTE.ORG VOLUME SEVEN ISSUE ONE The High (and Rising) Cost of Living in San Diego he most recently released T data on household consumption underscores what is, perhaps, San Diego
MARCH 2012 WWW.NUSINSTITUTE.ORG VOLUME SEVEN ISSUE ONE The High (and Rising) Cost of Living in San Diego he most recently released T data on household consumption underscores what is, perhaps, San Diego
Contact: Larry Hausman (502) Outer Loop, Louisville, KY Knobview Shopping Center
 Outer Loop, Louisville, KY Knobview Shopping Center") 5603-5637 Outer Loop, Louisville, KY 40219 Knobview Shopping Center Jefferson Mall Academy Sports Center SUBJECT Knobview Shopping Center offers a diverse mix of local and national tenants. The center
5603-5637 Outer Loop, Louisville, KY 40219 Knobview Shopping Center Jefferson Mall Academy Sports Center SUBJECT Knobview Shopping Center offers a diverse mix of local and national tenants. The center
The Consumer Price Index
 Catalogue no. 62-001-X The Consumer Price Index How to obtain more information Specific inquiries about this product and related statistics or services should be directed to: Client Services Unit, Prices
Animal Production, Dairy, Beef, Sheep, Chickens, Etc $ Forestry Management and Sales Standing Timber Only $350.
 111998 Crop Production, Agriculture, Farming, Nursery, Fruit Growers, Etc $100.00 112990 Animal Production, Dairy, Beef, Sheep, Chickens, Etc $100.00 113110 Forestry Management and Sales Standing Timber
Household consumption expenditure Year 2017
 19 June 2018 Household consumption expenditure Year 2017 In 2017, the average monthly household consumption expenditure, at current values, was 2,564 euros (+1.6% compared to 2016 and +3.8% compared to
Empowerment of social dialogue in trade sector as a contribution to the overarching EU employment and social policy challenges
 PROJECT TRASDEM: Empowerment of social dialogue in trade sector as a contribution to the overarching EU employment and social policy challenges International workshop /project meeting of project partners
Apparel Buyers Top 10. (apparel categories bought by the largest percentage of households during the average quarter, 2012) 20.4% 19.5% 17.2% 14.
 20.4% 19.5% 17.2% 14.") Chapter 1 Apparel Buyers, 2012 Spending on apparel has declined sharply over the years. The average household spent 30 percent less on apparel in 2012 than in 2000, after adjusting for inflation. Nevertheless,
Chapter 1 Apparel Buyers, 2012 Spending on apparel has declined sharply over the years. The average household spent 30 percent less on apparel in 2012 than in 2000, after adjusting for inflation. Nevertheless,