Empowerment of social dialogue in trade sector as a contribution to the overarching EU employment and social policy challenges
|
|
|
- Sherman Flowers
- 5 years ago
- Views:
Transcription
1 PROJECT TRASDEM: Empowerment of social dialogue in trade sector as a contribution to the overarching EU employment and social policy challenges International workshop /project meeting of project partners Barcelona, Spain 3. June 4. June 2013

2 Source: EC, Spring report 2013 This project has been funded with financial support from the European Union. This publication reflects the views
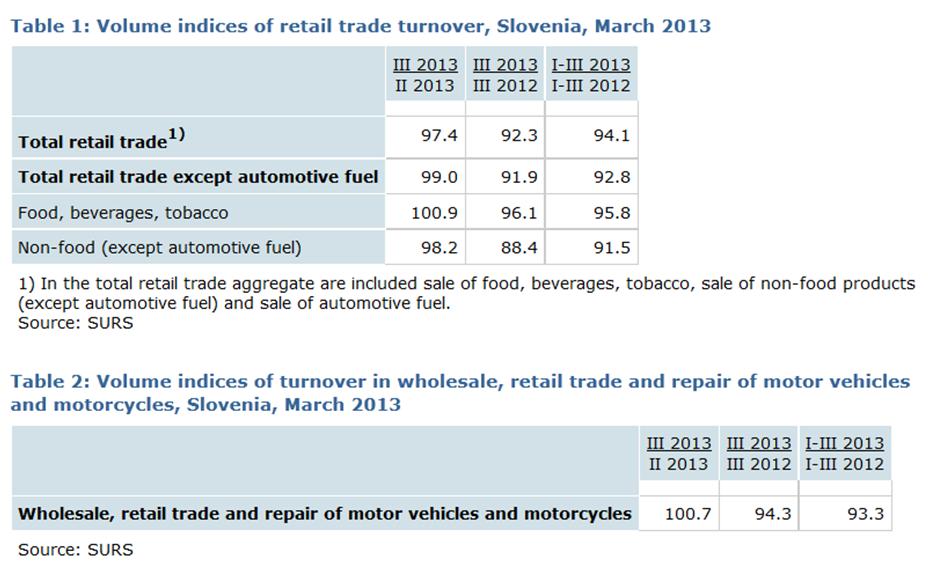
 Source: Statistical Office")

3 GDP p.c. in PPS (EU-27=100) Source: Statistical Office of the Republic of Slovenia In 2008, Slovenian GDP per capita in PPS was 9% below that of the EU-27 average, in 2011 it was 16% below.
4 Source: Eurostat This project has been funded with financial support from the European Union. This publication reflects the views
5 Volume indicies of turnover in retail trade (working day adjusted data) Jan 13 - Feb 13/ Jan 08 - Feb 08 Retail trade 91,0 Retail trade, except fuel 84,9 Automotive fuel in specialised stores 103,0 Food, beverages and tobacco 89,6 Non-specialised stores, predominantly with food 90,2 Food, beverages, tobacco in specialised stores 69,1 Retail trade with non-food, except fuel 81,9 Non-specialised stores, predominantly with non-food 86,0 Pharmaceutical, medical, cosmetic and toilet products in specialised stores 104,6 Textiles, clothing, footware and leather products in specialised stores 106,5 Furniture, household equipment, construction material, audio and video equipment in specialised stores 56,9 Computers, telecommunications equipment, books, sport equipment, toys, etc. in specialised stores 77,6 Retail sale via mail order houses or via Internet 58,0 Wholesale and retail trade and repair of motor vehicles and motorcycles 81,7 Motor vehicles, motorcycles, spare parts and acessories 82,2 Maintenance and repair of motor vehicles 83,6 Total retail trade and wholesale, retail trade, repair of motor vehicles and motorcycles 89,4 Retail trade of furniture and construction material in specialised stores 45,6 Retail trade of household equipment, audio and video equipment in specialised stores 81,2 Source: Statistical Office of the Republic of Slovenia
6
7 Turnover from the sale of goods by commodity groups in retail trade, 1000 EUR, Slovenia (Source: Statistical Office of the Republic of Slovenia) 2011 % Commodity groups - TOTAL Food, beverages and tobacco ,8 1.1 Food ,4 1.2 Beverages ,7 1.3 Tobacco ,8 2 Non-food products ,4 2.1 Clothing and footwear ,1 2.2 Furniture, lights, carpets and other floor coverings ,9 2.3 Products for household and home ,5 2.4 Household appliances in electric appliances for personal care ,4 2.5 Computer, telecommunication, avdio, visual devices ,4 2.6 Newspapers, books and stationery materials ,5 2.7 Sports equipment ,1 2.8 Games and toys ,5 2.9 Garden equipment, gardens, plants, flowers, pets , Medical products, appliances and equipment , Cosmetics and toilet accessories , Personal effects , Building and installation materials , Products for minor maintenance and repair of the dwelling , Tools and equipment for house and garden , Non-durable household goods , Heating oil, solid fuels, gas , Other ,1 3 Fuels ,9 4 Motor vehicles ,8 This project has been funded with financial support from the European Union. This publication reflects the views
8 Persons in employment by activities, Slovenia Index 12/08 Activities - TOTAL 2008M12 % 2012M12 % Persons in employment Persons in paid employment Self employed persons TRADE 2008M12 % 2012M12 % Index 12/08 Persons in employment Persons in paid employment Self employed persons Source: Statistical office of the Republic of Slovenia Persons in employment by activities, december 2012 Persons in employment % Activities - TOTAL ,0 C MANUFACTURING ,5 G WHOLESALE AND RETAIL TRADE, REPAIR OF MOTOR VEHICLES AND MOTORCYCLES ,4 P EDUCATION ,2 Q HUMAN HEALTH AND SOCIAL WORK ACTIVITIES ,0 F CONSTRUCTION ,7 O PUBLIC ADMINISTRATION AND DEFENCE, COMPULSORY SOCIAL SECURITY ,3 M PROFESSIONAL, SCIENTIFIC AND TECHNICAL ACTIVITIES ,0 H TRANSPORTATION AND STORAGE ,7 A AGRICULTURE, FORESTRY AND FISHING ,7 I ACCOMMODATION AND FOOD SERVICE ACTIVITIES ,0 N ADMINISTRATIVE AND SUPPORT SERVICE ACTIVITIES ,2 J INFORMATION AND COMMUNICATION ,9 K FINANCIAL AND INSURANCE ACTIVITIES ,9 R ARTS, ENTERTAINMENT AND RECREATION ,7 S OTHER SERVICE ACTIVITIES ,7 E WATER SUPPLY, SEWERAGE, WASTE MANAGEMENT AND REMEDIATION ACTIVITIES ,2 D ELECTRICITY, GAS, STEAM AND AIR CONDITIONING SUPPLY ,0 L REAL ESTATE ACTIVITIES ,5 B MINING AND QUARRYING ,3 T ACTIVITIES OF HOUSEHOLDS AS EMPLOYERS; PRODUCING ACTIVITIES OF HOUSEHOLDS FO 499 0,1 Source: Statistical Office of the Republic of Slovenia This project has been funded with financial support from the European Union. This publication reflects the views
9 Persons in employment (without farmers) by educational attainment, by activity, , SLO upper Total basic or less (%) secondary (%) tertiary (%) ,6 57,6 23, ,4 58,9 25, ,3 58,7 26, ,1 58,1 28,8 SKUPAJ A Agriculture,forestry and fishing N 30,1 G 75,1 P 66,0 B Mining and quarrying A 27,5 H 73,9 O 56,4 C Manufacturing F 27,0 I 71,2 M 55,4 D Electricity,gas,steam,air cond.supply E 24,3 S 70,8 K 51,7 E Water supply;sewer.,wst.manag.,remed.act T 23,9 B 70,7 J 49,7 F Construction C 21,2 F 65,2 R 46,8 G Wholesale,retail;repair of mot.vehicles I 19,5 C 64,1 Q 40,9 H Transportation and storage H 13,7 A 58,3 D 39,2 I Accommodation and food ser.activities B 12,4 T 58,1 L 38,0 J Information and communication Q 8,4 E 57,9 S 21,5 K Financial and insurance activities L 8,1 N 57,4 G 18,6 L Real estate activities S 7,7 D 56,1 T 18,0 M Professional,scientific,technical act R 6,9 L 53,9 E 17,8 N Administrative and support service act G 6,3 Q 50,7 B 16,9 O Public admin,defence;compulsory soc.sec P 5,5 J 47,9 C 14,8 P Education M 4,8 K 47,3 A 14,2 Q Human health and social work activities D 4,7 R 46,3 N 12,6 R Arts,entertainment and recreation J 2,4 O 41,6 H 12,4 S Other service activities O 2,0 M 39,8 I 9,3 T Act.of hhold.as employers;producing act.of hhold for own use 566 K 1,1 P 28,4 F 7,7 Source: SURS
10 Persons in employment by activity (NACE Rev. 2), 5-year age groups and sex, Slovenia, 2011 Activities - TOTAL Age - TOTAL years years years years years years years years years years 65 years and over Sex - TOTAL ,2 3,7 11,2 15,5 15,7 15,2 15,9 13,7 7,5 1,3 0,2 Men ,3 4,5 11,4 15,2 15,1 14,4 14,9 13,1 8,9 1,9 0,3 Women ,1 2,7 10,9 15,8 16,3 16,1 17,1 14,4 5,7 0,6 0,1 G - Trade Age - TOTAL years years years years years years years years years years 65 years and over Sex - TOTAL ,2 4,4 13,6 18,2 17,5 14,2 14,4 11,5 5,3 0,6 0,1 Men ,3 5,3 13,3 18,0 17,3 13,8 13,2 10,4 7,2 1,1 0,1 Women ,1 3,5 13,9 18,5 17,6 14,6 15,6 12,5 3,5 0,2 0,0 Source: Statistical Office of the Republic of Slovenia.


11 Registered unemployed persons Jan 08 Jan 13 Table: Comparison of registered unemployment rates and ILO unemployment rates Source: Register of Unemployed Persons
12 Registered unemployed persons by age groups, april 2013 Age (years) number % < 17 years > TOTAL Registered unemployed persons by educational attainment, april 2013 Education number % I II III IV V VI VII+VIII bologna prog TOTAL Work experience of registered unemployed persons, TOTAL % 100% 100% 100% 100% 100% Without work experience Less than 1 year to less than 2 years to less than 3 years to less than 5 years to less than 10 years to less than 20 years to less than 30 years years or more Source: Employment Service of Slovenia Registered unemployed persons by duration of unemployment, april 2013 Duration number % < 2 months months months months months months years years > 8 years TOTAL This project has been funded with financial support from the European Union. This publication reflects the views


13 Unemployment rates in the EU Member States: (15-74 years, as % of labour force) Source: EC, Labour Market Developments in Europe 2012 Unemployment duration in months

14 Source: Eurostat This project has been funded with financial support from the European Union. This publication reflects the views
 Insured persons of compulsory insurance Pensioners")
15 Year Average number of insured persons of compulsory insurance and persioners and Contributors/pensioners ratio (Source: The Institute of pension and invalidity insurance of Slovenia) Insured persons of compulsory insurance Pensioners Contributors/pensioners ratio

16 The registered unemployment by statistical regions, September 2012 December 2012 This project has been funded with financial support from the European Union. This publication reflects the views
17 Thank you for your attention. This project has been funded with financial support from the European Union. This publication reflects the views
Empowerment of social dialogue in trade sector as a contribution to the overarching EU employment and social policy challenges
 This project has been funded with financial support from the European Union. This publication reflects the views PROJECT TRASDEM: Empowerment of social dialogue in trade sector as a contribution to the
EMPLOYEES UNDER LABOUR CONTRACT AND GROSS AVERAGE WAGES AND SALARIES, THIRD QUARTER OF 2017
 EMPLOYEES UNDER LABOUR CONTRACT AND GROSS AVERAGE WAGES AND SALARIES, THIRD QUARTER OF 2017 According to the preliminary data of the National Statistical Institute (NSI) at the end of September 2017 the
Figure 1. Gross average wages and salaries by months
 EMPLOYEES UNDER LABOUR CONTRACT AND GROSS AVERAGE WAGES AND SALARIES, FIRST QUARTER OF 2018 According to the preliminary data of the National Statistical Institute (NSI) at the end of March 2018 the number
EMPLOYEES UNDER LABOUR CONTRACT AND GROSS AVERAGE WAGES AND SALARIES, FOURTH QUARTER OF 2016
 EMPLOYEES UNDER LABOUR CONTRACT AND GROSS AVERAGE WAGES AND SALARIES, FOURTH QUARTER OF 2016 According to the preliminary data of the National Statistical Institute (NSI) at the end of December 2016 the
EMPLOYEES UNDER LABOUR CONTRACT AND AVERAGE GROSS WAGES AND SALARIES, FOURTH QUARTER OF Figure 1. Average wages and salaries by months
 EMPLOYEES UNDER LABOUR CONTRACT AND AVERAGE GROSS WAGES AND SALARIES, FOURTH QUARTER OF 2013 According to the preliminary data of the National Statistical Institute (NSI) at the end of December 2013 the
NATIONAL ECONOMIC ACCOUNTS 2011 (Provisional Estimates)
") REPUBLIC OF CYPRUS NATIONAL ECONOMIC ACCOUNTS 2011 (Provisional Estimates) STATISTICAL SERVICE National Accounts Statistics Series II Report No. 28 Obtainable from the Printing Office of the Republic of
REPUBLIC OF CYPRUS NATIONAL ECONOMIC ACCOUNTS 2011 (Provisional Estimates) STATISTICAL SERVICE National Accounts Statistics Series II Report No. 28 Obtainable from the Printing Office of the Republic of
EMPLOYEES UNDER LABOUR CONTRACT AND AVERAGE WAGES AND SALARIES, THIRD QUARTER OF 2011
 EMPLOYEES UNDER LABOUR CONTRACT AND AVERAGE WAGES AND SALARIES, THIRD QUARTER OF 2011 According to the preliminary data of the National Statistical Institute (NSI) at the end of September 2011 the number
EMPLOYEES UNDER LABOUR CONTRACT AND GROSS AVERAGE WAGES AND SALARIES, FIRST QUARTER OF Figure 1. Average wages and salaries by months
 EMPLOYEES UNDER LABOUR CONTRACT AND GROSS AVERAGE WAGES AND SALARIES, FIRST QUARTER OF 2014 According to the preliminary data of the National Statistical Institute (NSI) at the end of March 2014 the number
HELLENIC REPUBLIC HELLENIC STATISTICAL AUTHORITY Piraeus, 31 August 2018 PRESS RELEASE. TURNOVER INDEX IN RETAIL TRADE: June 2018, y-o-y increase 3.
 Rates of HELLENIC REPUBLIC HELLENIC STATISTICAL AUTHORITY Piraeus, 31 August 2018 PRESS RELEASE TURNOVER INDEX IN RETAIL TRADE: 2018, y-o-y increase 3.3% The Hellenic Statistical Authority announces the
HELLENIC REPUBLIC HELLENIC STATISTICAL AUTHORITY Piraeus, 29 December 2017 PRESS RELEASE
 HELLENIC REPUBLIC HELLENIC STATISTICAL AUTHORITY Piraeus, 29 December 2017 PRESS RELEASE TURNOVER INDEX IN RETAIL TRADE: October 2017, y-o-y decrease 0.8% The Hellenic Statistical Authority announces the
GROSS DOMESTIC PRODUCT FOR THE FOURTH QUARTER OF 2015 AND PRELIMINARY DATA FOR 2015
 GROSS DOMESTIC PRODUCT FOR THE FOURTH QUARTER OF 2015 AND PRELIMINARY DATA FOR 2015 In the fourth quarter of 2015 GDP at current prices amounted to 23 699 million BGN. In Euro terms GDP reaches 12 117
GROSS DOMESTIC PRODUCT FOR THE FOURTH QUARTER OF 2013 AND 2013 (PRELIMINARY DATA)
") GROSS DOMESTIC PRODUCT FOR THE FOURTH QUARTER OF 2013 AND 2013 (PRELIMINARY DATA) In the fourth quarter of 2013 GDP at current prices amounted to 21 463 million BGN. In Euro terms GDP reaches 10 974 million
GROSS DOMESTIC PRODUCT FOR THE FOURTH QUARTER OF 2013 AND 2013 (PRELIMINARY DATA) In the fourth quarter of 2013 GDP at current prices amounted to 21 463 million BGN. In Euro terms GDP reaches 10 974 million
GROSS DOMESTIC PRODUCT FOR THE FOURTH QUARTER OF 2017 AND 2017 (PRELIMINARY DATA)
") GROSS DOMESTIC PRODUCT FOR THE FOURTH QUARTER OF 2017 AND 2017 (PRELIMINARY DATA) In the fourth quarter of 2017 GDP at current prices amounted to 27 427 million BGN. In Euro terms GDP reaches 14 023 million
GROSS DOMESTIC PRODUCT FOR THE FOURTH QUARTER OF 2017 AND 2017 (PRELIMINARY DATA) In the fourth quarter of 2017 GDP at current prices amounted to 27 427 million BGN. In Euro terms GDP reaches 14 023 million
GROSS DOMESTIC PRODUCT, SECOND QUARTER OF 2017 (PRELIMINARY DATA)
") GROSS DOMESTIC PRODUCT, SECOND QUARTER OF 2017 (PRELIMINARY DATA) In the second quarter of 2017 Gross Domestic Product (GDP) 1 at current prices amounts to 24 149 million BGN. In Euro terms GDP is 12 347
GROSS DOMESTIC PRODUCT, SECOND QUARTER OF 2017 (PRELIMINARY DATA) In the second quarter of 2017 Gross Domestic Product (GDP) 1 at current prices amounts to 24 149 million BGN. In Euro terms GDP is 12 347
Gross domestic product of Montenegro in 2011
 MONTENEGRO STATISTICAL OFFICE R E L E A S E No: 257 Podgorica, 28 September 2012 When using the data please name the source Gross domestic product of Montenegro in 2011 Real growth rate of gross domestic
Harmonised Index of Consumer Prices (HICP) April 2013
 April 2013") Apr-12 May-12 June-12 July-12 Aug-12 Sep-12 Oct-12 Nov-12 Dec-12 Jan-13 Feb-13 Mar-13 Apr-13 MONTENEGRO STATISTICAL OFFICE RELEASE No: 137 Podgorica, 17 May 2013 When using the data please name the source
Apr-12 May-12 June-12 July-12 Aug-12 Sep-12 Oct-12 Nov-12 Dec-12 Jan-13 Feb-13 Mar-13 Apr-13 MONTENEGRO STATISTICAL OFFICE RELEASE No: 137 Podgorica, 17 May 2013 When using the data please name the source
GROSS DOMESTIC PRODUCT, THIRD QUARTER OF 2015 (PRELIMINARY DATA)
") GROSS DOMESTC PRODUCT, THRD QUARTER OF 2015 (PRELMNARY DATA) GDP at current prices is 23 490 million BGN in the third quarter of 2015. n Euro terms GDP is 12 010 million Euro or 1 671 euro per capita.
GROSS DOMESTC PRODUCT, THRD QUARTER OF 2015 (PRELMNARY DATA) GDP at current prices is 23 490 million BGN in the third quarter of 2015. n Euro terms GDP is 12 010 million Euro or 1 671 euro per capita.
Nauru. Key Indicators for Asia and the Pacific Item
 Key Indicators for Asia and the Pacific 2018 1 POPULATION Total population a as of 1 July ( 000) 10.1 10.1 10.1 9.9 9.7 9.5 9.1 9.2 9.4 9.5 9.7 10.1 10.3 10.8 11.9 12.5 13.0 13.3 Population density (persons/km
GROSS DOMESTIC PRODUCT, FIRST QUARTER OF 2017 (PRELIMINARY DATA)
") GROSS DOMESTIC PRODUCT, FIRST QUARTER OF 2017 (PRELIMINARY DATA) In the first quarter of 2017 GDP at current prices amounts to 20 066 million BGN. In Euro terms GDP is 10 260 million Euro or 1 445 euro
GROSS DOMESTIC PRODUCT, FIRST QUARTER OF 2017 (PRELIMINARY DATA) In the first quarter of 2017 GDP at current prices amounts to 20 066 million BGN. In Euro terms GDP is 10 260 million Euro or 1 445 euro
Gross domestic product of Montenegro in 2016
 MONTENEGRO STATISTICAL OFFICE R E L E A S E No:174 Podgorica 29 September 2017 When using the data pleaase name the source Gross domestic product of Montenegro in 2016 Real growth rate of gross domestic
GROSS DOMESTIC PRODUCT, FIRST QUARTER OF 2018 (PRELIMINARY DATA)
") GROSS DOMESTIC PRODUCT, FIRST QUARTER OF 2018 (PRELIMINARY DATA) In the first quarter of 2018 Gross Domestic Product (GDP) 1 at current prices amounts to 21 479 million BGN. In Euro terms GDP is 10 982
GROSS DOMESTIC PRODUCT, FIRST QUARTER OF 2018 (PRELIMINARY DATA) In the first quarter of 2018 Gross Domestic Product (GDP) 1 at current prices amounts to 21 479 million BGN. In Euro terms GDP is 10 982
Key indicators for Bulgaria*
 Key indicators for Bulgaria* This update: 1 October 13 Next update: 3 December 13 1. Output 1 11 1 March-13 April-13 May-13 June-13 July-13 August-13 Industrial confidence indicator 1.1 % -7. -. -. -.
GROSS DOMESTIC PRODUCT, SECOND QUARTER OF 2014 (PRELIMINARY DATA)
") GROSS DOMESTIC PRODUCT, SECOND QUARTER OF 2014 (PRELIMINARY DATA) In the second quarter of 2014 GDP at current prices amounts to 19 517 million BGN. In Euro terms GDP is 9 979 million Euro or 1 379 euro
GROSS DOMESTIC PRODUCT, SECOND QUARTER OF 2014 (PRELIMINARY DATA) In the second quarter of 2014 GDP at current prices amounts to 19 517 million BGN. In Euro terms GDP is 9 979 million Euro or 1 379 euro
GROSS DOMESTIC PRODUCT FOR THE THIRD QUARTER OF 2013
 GROSS DOMESTIC PRODUCT FOR THE THIRD QUARTER OF 2013 In the third quarter of 2013 GDP at current prices amounts to 21 590 million BGN. In Euro terms GDP is 11 039 million euro or 1 519 euro per person.
GROSS DOMESTIC PRODUCT, THIRD QUARTER OF 2018 (PRELIMINARY DATA)
") GROSS DOMESTIC PRODUCT, THIRD QUARTER OF 2018 (PRELIMINARY DATA) In the third quarter of 2018 Gross Domestic Product (GDP) 1 at current prices amounts to 29 822 million BGN. In Euro terms GDP is 15 248
GROSS DOMESTIC PRODUCT, THIRD QUARTER OF 2018 (PRELIMINARY DATA) In the third quarter of 2018 Gross Domestic Product (GDP) 1 at current prices amounts to 29 822 million BGN. In Euro terms GDP is 15 248
Key indicators for Bulgaria*
 Key indicators for Bulgaria* This update: July 1 Next update: October 1 1. Output Nov.'17 Dec.'17 Jan.'1 Febr.'1 March'1 April'1 May'1 June'1 Industrial confidence 1.1 % 1. -.. 1. 1.. 1.. Industrial production
Gross domestic product of Montenegro for period
 MONTENEGRO STATISTICAL OFFICE RELEASE No: 211 Podgorica, 30. September 2015 When using these data, please name the source Gross domestic product of Montenegro for period 2010-2014 Real growth rate of gross
GROSS DOMESTIC PRODUCT FOR THE THIRD QUARTER OF 2012
 GROSS DOMESTIC PRODUCT FOR THE THIRD QUARTER OF 2012 In the third quarter of 2012 GDP at current prices amounted to 21 734 Million Levs. In Euro terms GDP was 11 112 Million Euro or 1 522 Euro per person.
PRESS RELEASE. INDEX OF WAGES COST: 4th Quarter 2018
 HELLENIC REPUBLIC Piraeus, March 13, 19 HELLENIC STATISTICAL AUTHORITY PRESS RELEASE INDEX OF WAGES COST: 4th Quarter Τhe Hellenic Statistical Authority (ELSTAT) announces the quarterly of Wages Cost for
Supply and Use Tables for Macedonia. Prepared by: Lidija Kralevska Skopje, February 2016
 Supply and Use Tables for Macedonia Prepared by: Lidija Kralevska Skopje, February 2016 Contents Introduction Data Sources Compilation of the Supply and Use Tables Supply and Use Tables as an integral
PRESS RELEASE. INDEX OF WAGES COST: 2nd Quarter 2018
 HELLENIC REPUBLIC Piraeus, 11 September 18 HELLENIC STATISTICAL AUTHORITY PRESS RELEASE INDEX OF WAGES COST: 2nd Quarter 18 Τhe Hellenic Statistical Authority (ELSTAT) announces the quarterly of Wages
QUALITY REPORT ON STRUCTURE OF EARNINGS SURVEY 2010 IN SLOVENIA
 QUALITY REPORT ON STRUCTURE OF EARNINGS SURVEY 2010 IN SLOVENIA Prepared by: Miran Žavbi, Rudi Seljak Litostrojska 54, 1000 Ljubljana Tel. +386 1 234 08 10, +386 1 234 02 94 Fax. +386 1 241 53 44 E-mail:
GROSS DOMESTIC PRODUCT FOR THE THIRD QUARTER OF 2011
 GROSS DOMESTIC PRODUCT FOR THE THIRD QUARTER OF 2011 In the third quarter of 2011 GDP at current prices amounts to 21 016 million levs. In Euro terms GDP reaches to 10 745 million euro or 1 448.4 euro
GROSS DOMESTIC PRODUCT FOR THE FIRST QUARTER OF 2014 (PRELIMINARY DATA)
") GROSS DOMESTIC PRODUCT FOR THE FIRST QUARTER OF 2014 (PRELIMINARY DATA) In the first quarter of 2014 GDP at current prices amounts to 16 097 Million Levs. In Euro terms GDP is 8 230 Million Euro or 1 136
GROSS DOMESTIC PRODUCT FOR THE FIRST QUARTER OF 2014 (PRELIMINARY DATA) In the first quarter of 2014 GDP at current prices amounts to 16 097 Million Levs. In Euro terms GDP is 8 230 Million Euro or 1 136
Outline of presentation. National Accounts Office September 2016 Chiba, Japan
 25-27 September 2016 Chiba, Japan National Accounts Office Office of the National Economic and Social Development Board (NESDB) Outline of presentation Short Term Indicator Quarterly Gross Domestic Product
GROSS DOMESTIC PRODUCT FOR THE SECOND QUARTER OF 2012
 GROSS DOMESTIC PRODUCT FOR THE SECOND QUARTER OF 2012 In the second quarter of 2012 GDP at current prices amounted to 19 007 Million Levs. In Euro terms GDP was 9 718 Million Euro or 1 330 Euro per person.
PRESS RELEASE. INDEX OF WAGES FOR THE WHOLE ECONOMY: 4 th Quarter 2016
 PRESS RELEASE INDEX OF WAGES FOR THE WHOLE ECONOMY: 4 th Quarter Τhe Hellenic Statistical Authority (ELSTAT) announces the quarterly of Wages 1 for the whole Economy 2 excluding Primary Sector and Activities
Kansas Department of Revenue Office of Policy and Research State Sales Tax Collections by NAICS
 January-10 February-10 March-10 April-10 111 Crop Production $ 26,331.97 $ 26,393.05 $ 69,200.44 $ 281,670.88 112 Animal Production $ 6,594.84 $ 6,705.43 $ 17,973.29 $ 8,190.77 114 Fishing, Hunting and
Highlands and Islands Enterprise. Location Profile Keith December 2011
 Highlands and Islands Enterprise Location Profile Keith December 2011 Mickledore Ltd. Unit 2 Chapel House Barn Pillmoss Lane Lower Whitley Cheshire WA4 4DW Tel: 01925 837679 Tel: 07747 085400 Email: contact@regionaldevelopment.co.uk
Fiji. Key Indicators for Asia and the Pacific Item
 1 POPULATION Total population as of 1 July ( 000) 802.0 805.0 810.0 816.0 821.0 827.0 830.0 834.5 841.4 845.5 850.7 854.3 858.0 862.1 865.7 869.5 873.2 884.9 Population density (persons/km 2 ) 44 44 44
PRESS RELEASE. LABOUR FORCE SURVEY: 3rd quarter 2017
 HELLENIC REPUBLIC HELLENIC STATISTICAL AUTHORITY Piraeus, 14 December 2017 PRESS RELEASE LABOUR FORCE SURVEY: 3rd quarter 2017 The Hellenic Statistical Authority (ELSTAT) announces the results of the Labour
NCPI. March Namibia Consumer Price index. Namibia Consumer Price index - March
 NCPI Namibia Consumer Price index March 2018 Namibia Consumer Price index - March 2018 1 Mission Statement Leveraging on partnerships and innovative technologies, to produce and disseminate relevant, quality,
Solomon Islands. Key Indicators for Asia and the Pacific 2018
 1 POPULATION Total population a ( 000) 418.6 428.5 438.5 448.8 459.4 470.1 481.2 492.5 504.0 515.9 528.0 540.4 553.1 566.0 579.3 592.9 606.8 620.8 Population density (persons/km 2 ) 14 14 14 15 15 15 16
BULGARIA: ECONOMIC AND MARKET ANALYSES Monthly report, August 2015
 BULGARIA: ECONOMIC AND MARKET ANALYSES Monthly report, August 2015 All data in the edition are the last available data as of 29 of August 2015 The quoted data set in this report are the last available
PRESS RELEASE. LABOUR FORCE SURVEY: 1st quarter 2018
 HELLENIC REPUBLIC HELLENIC STATISTICAL AUTHORITY Piraeus, 14 June 2018 PRESS RELEASE LABOUR FORCE SURVEY: 2018 The Hellenic Statistical Authority (ELSTAT) announces the results of the Labour Force Survey
Viet Nam. Key Indicators for Asia and the Pacific Item
 Key Indicators for Asia and the Pacific 2018 1 POPULATION Total population as of 1 July (million) 77.11 78.12 79.08 80.00 80.95 81.91 82.85 84.22 85.12 86.03 86.93 87.84 88.81 89.76 90.73 91.71 92.69 93.67*
Hungary: Gender Pay Gap
 With Innovative Tools Against Gender Pay Gap WITA GPG (214-216) Financed by European Commission - JUST/213/Action Grants - Specific Programme "Progress" (27-213) Section Gender Equality (No 44929) 1 WITA
Key indicators for Bulgaria*
 Key indicators for Bulgaria* This update: July 1 Next update: 1 October 1 1. Output 11 1 13 Dec.-13 Jan.-1 Febr.-1 March-1 April-1 May-1 Industrial confidence 1.1 % -, -, -,7-9,9 -,9 -,3 -, -, -,9 Industrial
STATISTICAL REFLECTIONS 3 September 2014
 66/14 STATISTICAL REFLECTIONS 3 September 14 Second-quarter 14 GDP increased by 3.9 Gross domestic product, second quarter 14, second estimation Contents Introduction...1 Production...1 Expenditure...
GROSS DOMESTIC PRODUCT FOR THE SECOND QUARTER OF 2011
 GROSS DOMESTIC PRODUCT FOR THE SECOND QUARTER OF 2011 In the second quarter of 2011 GDP at current prices amounts to 18 804 million levs. In Euro terms GDP reaches to 9 614.3 million euro or 1 284.1 euro
Non-resident counterparty reference data report
 Non-resident counterparty reference data report Annex 2 to Eesti Pank Governor s Decree No 6 of 29 March 2017 Requirements for reporting granular credit data 1. Scope of the report 1.1. The report covers
PRESS RELEASE. LABOUR FORCE SURVEY: 2nd quarter 2018
 HELLENIC REPUBLIC HELLENIC STATISTICAL AUTHORITY Piraeus, 13 September PRESS RELEASE LABOUR FORCE SURVEY: 2nd quarter The Hellenic Statistical Authority (ELSTAT) announces the results of the Labour Force
PRESS RELEASE. LABOUR FORCE SURVEY: 3d quarter 2018
 HELLENIC REPUBLIC HELLENIC STATISTICAL AUTHORITY Piraeus, 13 December PRESS RELEASE LABOUR FORCE SURVEY: The Hellenic Statistical Authority (ELSTAT) announces the results of the Labour Force Survey for
PSA-CAR SPECIAL RELEASE
 PSA-CAR SPECIAL RELEASE PHILIPPINE STATISTICS AUTHORITY Volume 2 No. 03 January 2017 Cordillera Administrative Region LABOR STATISTICS Labor Force Participation in CAR January 2016 The Labor Force Survey
BUSINESS DEMOGRAPHY (By 31 st of December 2010)
") Introduction BUSINESS DEMOGRAPHY (By 31 st of December 2010) Similar to statistics of human population, business demography describes the life cycle of the enterprises; their birth, survival and development
Introduction BUSINESS DEMOGRAPHY (By 31 st of December 2010) Similar to statistics of human population, business demography describes the life cycle of the enterprises; their birth, survival and development
China, People s Republic of
 1 POPULATION Total population as of 31 December (million) 1,267.4 1,276.3 1,284.5 1,292.3 1,299.9 1,307.6 1,314.5 1,321.3 1,328.0 1,334.5 1,340.9 1,347.4 1,354.0 1,360.7 1,367.8 1,374.6 1,382.7 1,390.1
Final Report on Eurostat grants for 2011
 Ref. Ares(2013)195582-14/02/2013 REPUBLIC OF SLOVENIA GRANT AGREEMENT NUMBER No. 50904.2011.005-2011.303 Final Report on Eurostat grants for 2011 MODULE 5.09: ENVIRONMENTAL ACCOUNTS AND CLIMATE CHANGE
National Accounts GROSS DOMESTIC PRODUCT BY PRODUCTION, INCOME AND EXPENDITURE APPROACH
 TB 01 Thematic Bulletin ISSN 2232-7789 National Accounts GROSS DOMESTIC PRODUCT BY PRODUCTION, INCOME AND EXPENDITURE APPROACH Bosnia and Herzegovina BHAS Agency for Statistic of Bosnia and Herzegovina
NCPI. Namibia Consumer Price index. January 2018
 NCPI Namibia Consumer Price index January 2018 Namibia Consumer Price index - January 2018 1 Mission Statement Leveraging on partnerships and innovative technologies, to produce and disseminate relevant,
ECONOMIC MONITOR NUMBER: 15 APRIL 2015
 ECONOMIC MONITOR NUMBER: 15 APRIL 2015 TABLE OF CONTENTS 1. SUMMARY... 1 2. REAL SECTOR... 2 2.1 Gross domestic product... 2 2.2 Industrial production... 3 2.3 Construction sector... 5 2.4 Labour market...
WAGE RATE INDEX (WRI) (Base: fourth quarter 2016 = 100)
 (Base: fourth quarter 2016 = 100)") . Introduction This issue of the Economic and Social Indicators (ESI) on wage rate index presents data for the third quarter of 207. As from the first quarter of 207, indices are computed using the fourth
. Introduction This issue of the Economic and Social Indicators (ESI) on wage rate index presents data for the third quarter of 207. As from the first quarter of 207, indices are computed using the fourth
June Namibia Consumer Price Index. Tel: Fax:
 Namibia Consumer Price Index N C P I June 2017 Namibia Statistics Agency P.O. Box 2133, FGI House, Post Street Mall, Windhoek, Namibia Tel: +264 61 431 3200 Fax: +264 61 431 3253 Email: info@nsa.org.na
The role of FDI and trade in the catching-up process
 Wiener Institut für Internationale Wirtschaftsvergleiche The Vienna Institute for International Economic Studies wiiw.ac.at 8th East Jour Fixe of the Oesterreichische Nationalbank Bulgaria and Romania
Marshall Islands, Republic of the
 Key Indicators for Asia and the Pacific 2017 1 POPULATION Total population a thousand; as of 1 July 51.2 50.5 49.7 50.0 50.5 51.2 51.5 51.8 52.5 52.3 52.9 53.2 53.4 53.6 53.8 54.0 54.2 Population density
National Accounts Estimates ( ) September 2018 issue
 September 2018 issue") National Accounts Estimates (2015 2018) September 2018 issue 1. INTRODUCTION This issue of Economic and Social Indicators presents National Accounts estimates for the period 2015 to 2018. Concepts and
National Accounts Estimates (2015 2018) September 2018 issue 1. INTRODUCTION This issue of Economic and Social Indicators presents National Accounts estimates for the period 2015 to 2018. Concepts and
NCPI. August Namibia Consumer Price index. Namibia Consumer Price index - August
 NCPI Namibia Consumer Price index August 2018 Namibia Consumer Price index - August 2018 1 Mission Statement Leveraging on partnerships and innovative technologies, to produce and disseminate relevant,
REPUBLIC OF MOLDOVA. SWTS country brief. December Main findings of the ILO SWTS
 REPUBLIC OF MOLDOVA SWTS country brief December 2016 The ILO Work4Youth project worked with the National Bureau of Statistics of Moldova to implement two rounds of the School-to-work transition survey
Employment and Skills Briefing (December 2014)
") The following information summarises the DWP (Central England Group) State of the Group Report December 2014 and provides a focus on East Midlands and District level / local authority / LEP data. National
The following information summarises the DWP (Central England Group) State of the Group Report December 2014 and provides a focus on East Midlands and District level / local authority / LEP data. National
Hong Kong, China. Key Indicators for Asia and the Pacific 2018
 Key Indicators for Asia and the Pacific 2018 1 POPULATION a Total population as of 1 July (million) 6.7 6.7 6.7 6.7 6.8 6.8 6.9 6.9 7.0 7.0 7.0 7.1 7.2 7.2 7.2 7.3 7.3 7.4 Population density b (persons/km
Household consumption by purpose
 Household consumption by purpose Statistics Explained Data extracted in November 2018. Planned article update: November 2019. Household expenditure by consumption purpose - COICOP, EU-28, 2017, share of
FOREIGN DIRECT INVESTMENTS AND EXPENDITURE ON ACQUISITION OF TANGIBLE FIXED ASSETS IN 2016 (PRELIMINARY DATA)
") FOREIGN DIRECT INVESTMENTS AND EXPENDITURE ON ACQUISITION OF TANGIBLE FIXED ASSETS IN 2016 (PRELIMINARY DATA) 1. Foreign direct investments According to preliminary data the foreign direct investments
FOREIGN DIRECT INVESTMENTS AND EXPENDITURE ON ACQUISITION OF TANGIBLE FIXED ASSETS IN 2016 (PRELIMINARY DATA) 1. Foreign direct investments According to preliminary data the foreign direct investments
ICT, knowledge and the economy 2012 Statistical annex
 ICT, knowledge and the economy 2012 Statistical annex This annex includes some tables with supplementary figures to the publication ICT, knowledge and the economy 2012. The tables are arranged by chapter.
FSB MEMBERSHIP PROFILE
 FSB MEMBERSHIP PROFILE Published: January 2016 @fsb_policy fsb.org.uk FSB Membership Profile CONTENTS 1. Summary...3 2. Background and Methodology...4 3. Demographic Profile...6 4. Business Profile...8
BUSINESS DEMOGRAPHY (By December 31, 2008)
") BUSINESS DEMOGRAPHY (By December 31, 2008) PREFACE Similar to statistics of human population, business demography describes the life cycle of the enterprises; their birth, survival and development until
BUSINESS DEMOGRAPHY (By December 31, 2008) PREFACE Similar to statistics of human population, business demography describes the life cycle of the enterprises; their birth, survival and development until
THE REPUBLIC OF SRPSKA MINISTRY OF FINANCE MACROECONOMIC INDICATORS OF
 THE REPUBLIC OF SRPSKA MINISTRY OF FINANCE MACROECONOMIC INDICATORS OF THE REPUBLIC OF SRPSKA Banja Luka, May 2018 2 Content: I. CURRENT MACROECONOMIC AND FISCAL INDICATORS... 5 1.1 Macroeconomic Indicators...
India. Key Indicators for Asia and the Pacific Item
 1 POPULATION a Total population as of 1 October (million) 1,019 1,040 1,056 1,072 1,089 1,106 1,122 1,138 1,154 1,170 1,186 1,220 1,235 1,251 1,267 1,283 1,299 1,316 Population density (persons/km 2 )
Tuvalu. Key Indicators for Asia and the Pacific Item
 1 POPULATION Total population thousand; as of 1 July 9.5 9.6 9.6 9.7 10.0 10.3 10.4 11.1 11.0 11.1 11.1 10.6 10.8 10.9 11.0 11.2 11.3 Population density persons per square kilometer 372 374 373 378 389
Employment Data (establishment)
") Table 1: Major Indicators of Labor Market Activity for New Jersey Seasonally Adjusted (thousands) Benchmark Labor Force Data (resident) Current Month Previous Month One Year Ago Net Change Net Change May
Table 1: Major Indicators of Labor Market Activity for New Jersey Seasonally Adjusted (thousands) Benchmark Labor Force Data (resident) Current Month Previous Month One Year Ago Net Change Net Change May
SERBIA. SWTS country brief. December Main findings of the ILO SWTS
 SERBIA SWTS country brief December 2016 The ILO Work4Youth project worked with the Statistical Office of the Republic of Serbia to implement the School-towork transition survey (SWTS) in 2015 (March April).The
Annual National Accounts
 Annual National Accounts Gross Domestic Product 2005-2012 June 2013 Foreword The Statistics Centre - Abu Dhabi (SCAD) is pleased to release National Accounts estimates for the Emirate of Abu Dhabi. The
National Accounts Estimates ( ) March 2018 issue
 March 2018 issue") National Accounts Estimates (2015 2018) March 2018 issue 1. INTRODUCTION This issue of Economic and Social Indicators presents National Accounts estimates for the period 2015 to 2018. Concepts and definitions
National Accounts Estimates (2015 2018) March 2018 issue 1. INTRODUCTION This issue of Economic and Social Indicators presents National Accounts estimates for the period 2015 to 2018. Concepts and definitions
Myanmar. Key Indicators for Asia and the Pacific Item
 Key Indicators for Asia and the Pacific 2017 1 POPULATION a Total population million; as of 1 October 46.1 46.6 47.1 47.6 48.1 48.5 48.8 49.2 49.5 49.8 50.2 50.6 51.0 51.4 52.0 52.5 52.9 Population density
RESULTS OF THE KOSOVO 2015 LABOUR FORCE SURVEY JUNE Public Disclosure Authorized. Public Disclosure Authorized. Public Disclosure Authorized
 Public Disclosure Authorized Public Disclosure Authorized Public Disclosure Authorized Public Disclosure Authorized RESULTS OF THE KOSOVO 2015 LABOUR FORCE SURVEY JUNE 2016 Kosovo Agency of Statistics
NACE revision 2 codification
 A AGRICULTURE, FORESTRY AND FISHING 011500 2 Growing of tobacco B MINING AND QUARRYING 050000 2 Mining of coal and lignite 051000 2 Mining of hard coal 052000 2 Mining of lignite 060000 2 Extraction of
CONSUMER PRICE INDEX
 CONSUMER PRICE INDEX (Base period: January December 2012 = 100) 3 rd Quarter 2017 1. INTRODUCTION This issue of Economic and Social Indicators presents the Consumer Price Index (CPI) for the third quarter
PLANNING NOTE ON THE 2017 COMPARISON OF THE INTERNATIONAL COMPARISON PROGRAM (ICP) AND THE ROLLING SURVEY APPROACH. World Bank May 2016
 AND THE ROLLING SURVEY APPROACH. World Bank May 2016") PLANNING NOTE ON THE COMPARISON OF THE INTERNATIONAL COMPARISON PROGRAM (ICP) AND THE ROLLING SURVEY APPROACH World Bank May Contents I. Background... 2 II. Overview of the Rolling Survey Approach... 2
PLANNING NOTE ON THE COMPARISON OF THE INTERNATIONAL COMPARISON PROGRAM (ICP) AND THE ROLLING SURVEY APPROACH World Bank May Contents I. Background... 2 II. Overview of the Rolling Survey Approach... 2
SPECIAL RELEASE Annual Survey of Philippine Business and Industry (Total Employment of 20 and Over- Final Results) National Capital Region
 National Capital Region") Number: 2015-04 Date Released: June 15, 2015 REPUBLIC OF THE PHILIPPINES PHILIPPINE STATISTICS AUTHORITY NATIONAL CAPITAL REGION SPECIAL RELEASE 2010 Annual Survey of Philippine Business and Industry (
Number: 2015-04 Date Released: June 15, 2015 REPUBLIC OF THE PHILIPPINES PHILIPPINE STATISTICS AUTHORITY NATIONAL CAPITAL REGION SPECIAL RELEASE 2010 Annual Survey of Philippine Business and Industry (
Kansas Department of Revenue Office of Policy and Research State Sales Tax Collections by NAICS Calendar Year 2007 January-07.
 January-07 February-07 March-07 April-07 11 Agriculture, Forestry, Fishing and Hunting 111 Crop Production $ 112 Animal Production $ 114 Fishing, Hunting and Trapping $ 115 Agriculture and Forestry Support
A Comparison of Official and EUKLEMS estimates of MFP Growth for Canada. Wulong Gu Economic Analysis Division Statistics Canada.
 A Comparison of Official and EUKLEMS estimates of MFP Growth for Canada Wulong Gu Economic Analysis Division Statistics Canada January 12, 2012 The Canadian data in the EU KLEMS database is now updated
Labour Force Survey Central Statistics Organisation Islamic Republic of Afghanistan, Kabul October 2012
 Labour Force Survey Training @ Central Statistics Organisation Islamic Republic of Afghanistan, Kabul 21 23 October 2012 Organised by: Statistical, Economic and Social Research and Training Centre for
CONSUMER PRICE INDEX
 1. INTRODUCTION CONSUMER PRICE INDEX (Base period: July 2006 June 2007 = 100) 1st Quarter 2010 This issue of Economic and Social Indicators presents the Consumer Price Index (CPI) for the first quarter
FRIENDSWOOD PLANNING & ZONING COMMISSION AGENDA ITEM FORM
 Staff FRIENDSWOOD PLANNING & ZONING COMMISSION AGENDA ITEM FORM Subject: Review of the Permitted Use Table Current Ordinance/Requirement: Appendix C - Zoning Ordinance Section 7. Schedule of District Regulations
MARYLAND DEPARTMENT OF LABOR, LICENSING AND REGULATION Office of Workforce Information and Performance 1100 North Eutaw Street Baltimore, MD 21201
 AND PAYROLLS "Check Out Our Web Site: www.dllr.state.md.us/lmi/index.htm" MARYLAND DEPARTMENT LABOR, LICENSING AND REGULATION Office of Workforce Information and Performance 1100 North Eutaw Street Baltimore,
Jobs and Skills. Glasgow Region. comprising East Dunbartonshire, East Renfrewshire and Glasgow City. March 2018
 Jobs and Skills Glasgow Region comprising East Dunbartonshire, East Renfrewshire and Glasgow City March 2018 Sectoral Breakdown of Business Base, (2016) Source: UK Business Counts. 2016. Glasgow Region
Report on the balance of loans
 Appendix 4 to Eesti Pank Governor s Decree No 7 of 29 May 2014 Establishment of supplementary reports on credit institutions balance sheet Report on the balance of loans 1. Scope of the report Balances
1 People in Paid Work
 1 People in Paid Work Indicator 1.1a Indicator 1.1b Indicator 1.2a Indicator 1.2b Indicator 1.3 Indicator 1.4 Indicator 1.5a Indicator 1.5b Indicator 1.6 Employment and Unemployment Trends (Republic of
Tuvalu. Key Indicators for Asia and the Pacific Item
 Key Indicators for Asia and the Pacific 2016 1 POPULATION Total population a thousand; as of 1 July 9.5 9.6 9.6 9.7 10.0 10.3 10.4 11.1 11.0 11.1 11.1 10.6 10.8 10.8 10.8 10.8 Population density persons
Papua New Guinea. Key Indicators for Asia and the Pacific 2017
 1 POPULATION Total population a million; as of 1 July 5.2 5.4 5.5 5.7 5.9 6.1 6.2 6.4 6.6 6.8 7.1 7.3 7.5 7.7 8.0 8.2 8.5 Population density persons per square kilometer 11 12 12 12 13 13 13 14 14 15 15
All data in the edition are the last available data as of May 2017
 All data in the edition are the last available data as of May 2017 The quoted data set in this report are the last available data, published in the official source s web sites. The sources are Ministry
Parliament (National Council) Gender SPÖ % ÖVP % Greens % FPÖ % BZÖ % Total %
 Gender SPÖ % ÖVP % Greens % FPÖ % BZÖ % Total %") Annex 1: Political representation of women and men: Federal Government, Parliament (National Council), Federal Council, Federal Provinces, Government of the Federal Province Federal Government Gender Absolute
Annex 1: Political representation of women and men: Federal Government, Parliament (National Council), Federal Council, Federal Provinces, Government of the Federal Province Federal Government Gender Absolute