APPLICATIONS OF ECONOMIC DATA
|
|
|
- Terence Owen
- 5 years ago
- Views:
Transcription
1 APPLICATIONS OF ECONOMIC DATA Spring Data Users Workshop April 2004 Tony Sylvester Bureau of Business and Economic Research University of New Mexico (505)
2 EXAMPLES: 1. Create a county level profile of business and employment 2. Identify industries that may have a competitive advantage 3. Estimate the sales of a grocery store and an area s expenditures at grocery stores 2
3 EXAMPLE 1: PROFILING EMPLOYMENT AND BUSINESSES IN SANTA FE COUNTY 3
4 Business and Employment Profile What industries are important employers in Santa Fe County? What are the characteristics of the establishments in this industry? How have employment and establishments in this industry changed over time? 4
5 SANTA FE COUNTY EMPLOYMENT, ANNUAL PAYROLL, AND NUMBER OF ESTABLISHMENTS, NAICS Code Sector Employees Annual Payroll ($1,000) Establishments Total 44,482 1,204,599 4, Forestry/fishing/hunting/ag. support D 8 21 Mining 54 1, Utilities 232 9, Construction 4, , Manufacturing 1,342 37, Wholesale trade 1,533 57, Retail trade 9, , Transportation & warehousing 353 8, Information 1,201 41, Finance and Insurance 1,838 96, Real estate & rental & leasing 1,050 31, Professional, scientific & tech. serv. 2, , Mgt. of companies & enterprises 264 7, Admin, support, wst. mgt, remediation 1,858 40, Educational services 1,727 44, Health care & social assistance 5, , Arts, entertainment & recreation 1,598 42, Accommodation & food service 7, , Other serv. (exc. public admin.) 2,538 56, Auxiliaries D 3 99 Unclassified establishments 69 1, Source: County Business Patterns, paid employees for the pay period including March 12. 5
6 SANTA FE COUNTY: DISTRIBUTION OF EMPLOYEES 1 NAICS Code Sector Employees Percent of ttl. Emp. Total 44, % 11 Forestry/fishing/hunting/ag. support D 21 Mining % 22 Utilities % 23 Construction 4, % Manufacturing 1, % 42 Wholesale trade 1, % Retail trade 9, % Transportation & warehousing % 51 Information 1, % 52 Finance and Insurance 1, % 53 Real estate & rental & leasing 1, % 54 Professional, scientific & tech. serv. 2, % 55 Mgt. of companies & enterprises % 56 Admin, support, wst. mgt, remediation 1, % 61 Educational services 1, % 62 Health care & social assistance 5, % 71 Arts, entertainment & recreation 1, % 72 Accommodation & food service 7, % 81 Other serv. (exc. public admin.) 2, % 95 Auxiliaries D 99 Unclassified establishments % Source: County Business Patterns, paid employees for the pay period including March 12. 6
7 DISTRIBUTION OF EMPLOYEES: SANTA FE COUNTY, NEW MEXICO, AND US, Percent of ttl Employees Santa NAICS Code Sector Fe County New Mexico United States Total 100.0% 100.0% 100.0% 11 Forestry/fishing/hunting/ag. support D 0.1% 0.2% 21 Mining 0.1% 2.6% 0.4% 22 Utilities 0.5% 1.0% 0.6% 23 Construction 9.0% 8.3% 5.6% Manufacturing 3.0% 6.7% 13.9% 42 Wholesale trade 3.4% 3.9% 5.3% Retail trade 20.4% 16.1% 12.9% Transportation & warehousing 0.8% 2.4% 3.3% 51 Information 2.7% 2.8% 3.3% 52 Finance and Insurance 4.1% 4.5% 5.4% 53 Real estate & rental & leasing 2.4% 1.8% 1.8% 54 Professional, scientific & tech. serv. 5.5% 5.5% 6.2% 55 Mgt. of companies & enterprises 0.6% 1.5% 2.5% 56 Admin, support, wst. mgt, remediation 4.2% 6.4% 7.9% 61 Educational services 3.9% 1.7% 2.3% 62 Health care & social assistance 13.1% 14.7% 12.6% 71 Arts, entertainment & recreation 3.6% 2.5% 1.5% 72 Accommodation & food service 16.6% 12.6% 8.7% 81 Other serv. (exc. public admin.) 5.7% 4.9% 4.7% 95 Auxiliaries D 0.3% 0.9% 99 Unclassified establishments 0.2% 0.1% 0.1% Source: U.S. Department of Commerce, Bureau of the Census, County Business Patterns, New Mexico, paid employees for the pay period including March 12. 7
8 SANTA FE COUNTY RETAIL EMPLOYMENT: DISTRIBUTION AND CHANGE, Santa Fe County NAICS Change Code Description Emplys Percent Number Percent 44 Retail trade 9, % % 441 Motor vehicle & parts dealers % % 442 Furniture & home furnishing stores % % 443 Electronics & appliance stores % % 444 Bldg material & garden equip & supp dealers % % 445 Food & beverage stores 1, % % 446 Health & personal care stores % % 447 Gasoline stations % % 448 Clothing & clothing accessories stores 1, % % 451 Sporting goods, hobby, book & music stores % 0 0.0% 452 General merchandise stores 1, % % 453 Miscellaneous store retailers 1, % % 454 Nonstore retailers % % Source: U.S. Department of Commerce, Bureau of the Census, County Business Patterns, New Mexico, 1998 and paid employees for the pay period including March 12. 8
9 SANTA FE COUNTY RETAIL ESTABLISHMENTS BY EMPLOYMENT-SIZE CLASS, 2001 Employment-size Class NAICS Code Description Total Estab Retail trade Motor vehicle & parts dealers Furniture & home furnishing stores Electronics & appliance stores Bldg material/garden equip/supp dealers Food & beverage stores Health & personal care stores Gasoline stations Clothing & clothing accessories stores Sporting goods, hobby, book/music stores General merchandise stores Miscellaneous store retailers Nonstore retailers Source: U.S. Department of Commerce, Bureau of the Census, County Business Patterns, New Mexico,
10 SANTA FE COUNTY RETAIL SECTOR DERIVED MEASURES: EMPLOYEES PER ESTABLISHMENT, PAYROLL PER EMPLOYEE AND PAYROLL PER ESTABLISHMENT, 2001 Derived Measures NAICS Establishments Ttl Annual Payroll Code Description Emplys ($1,000) 44 Retail trade 9, , Motor vehicle & parts dealers , Furniture & home furnishing stores , Electronics & appliance stores , Bldg material/garden equip/supp dealers , Food & beverage stores 1, , Health & personal care stores , Gasoline stations , Clothing & clothing accessories stores 1, , Sporting goods, hobby, book/music stores , General merchandise stores 1, , Miscellaneous store retailers 1, , Nonstore retailers ,613 Emps per Estab Payroll per Emp Payroll per Estab 10.0 $22,049 $221, $38,626 $636, $24,694 $184, $22,812 $212, $24,732 $336, $20,234 $545, $15,616 $187, $13,829 $107, $18,759 $100, $12,842 $116, $16,404 $1,280, $27,130 $127, $28,492 $140,325 Source: U.S. Department of Commerce, Bureau of the Census, County Business Patterns, New Mexico,
11 EXAMPLE 2: IDENTIFYING INDUSTRIES WITH A COMPETITIVE ADVANTAGE 11
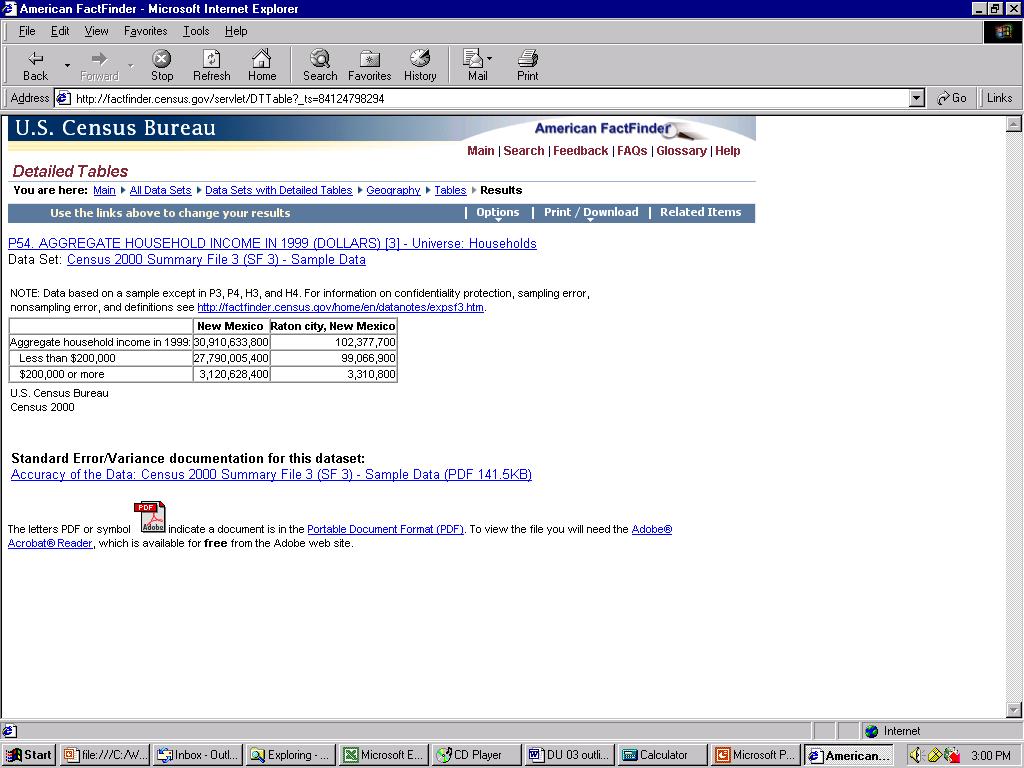
12 Pull Factors: This example compares sales per dollar of income in Raton to sales per dollar of income in New Mexico: TGR Raton / Raton Income TGR NM / NM Income Income Decennial Census Receipts Taxable Gross Receipts (TGR) from NM Taxation and Revenue 12
13 13
14 Income Data: TOTAL HOUSEHOLD INCOME New Mexico City of Raton ,910,633, ,377,700 Source: U.S. Bureau of the Census, Census of Population and Housing, 1990 (STF-3) and 2000 (SF-3). 14
15 GRT per dollar of Income TAXABLE GROSS RECEIPTS: NEW MEXICO AND RATON, Taxable Gross Receipts SIC Sector New Mexico Raton Total All Industries 30,157,467, ,723,084 Agriculture 64,110,247 D Mining 806,558,050 D Contract Construction 3,636,106,724 11,125,123 Manufacturing 835,755,453 1,548,054 T.C.U. 1,993,037,118 5,557,692 Wholesale 1,412,701,206 1,652,279 Retail 11,466,341,056 51,381,338 F.I.R.E 766,226,639 1,753,071 Sercives 9,020,118,673 29,852,218 Government 113,034,476 D Non-classified 43,448,061 D D - Not discosed. Source: New Mexico Taxation and Revenue Department, Rpt
16 TAXABLE GROSS RECEIPTS PER DOLLAR OF HOUSEHOLD INCOME: NEW MEXICO AND RATON, 1999 New Mexico City of Raton Taxable Gross Receipts 30,157,467, ,723,084 Household Income ($) 1 30,910,633, ,377,700 TGR PER $HH INCOME SIC Sector New Mexico Raton Total All Industries Agriculture 0.00 #VALUE! Mining 0.03 #VALUE! Contract Construction Manufacturing T.C.U Wholesale Retail F.I.R.E Sercives Government 0.00 #VALUE! Non-classified 0.00 #VALUE! Source: New Mexico Taxation and Revenue Department, Rpt U.S. Bureau of the Census, Census of Population and Housing, 1990 (STF-3) and 2000 (SF-3). 16
17 Calculate Pull Factor TAXABLE GROSS RECEIPTS PER DOLLAR OF HOUSEHOLD INCOME AND PULL FACTORS: NEW MEXICO AND RATON, 1999 TGR PER $HH INCOME SIC Sector New Mexico Raton Pull Factor Total All Industries Agriculture 0.00 #VALUE! #VALUE! Mining 0.03 #VALUE! #VALUE! Contract Construction Manufacturing T.C.U Wholesale Retail F.I.R.E Sercives Government 0.00 #VALUE! #VALUE! Non-classified 0.00 #VALUE! #VALUE! 17
18 PULL FACTORS BY INDUSTRY, CITY OF RATON VERSUS NEW MEXICO, 1999 From Taxable Gross Receipts per Dollar of Income Total All Industries Contract Construction Manufacturing T.C.U. Wholesale Retail F.I.R.E Sercives Some sectors not shown due to disclosure. Pull Factor Source of Data: NM Taxation and Revenue Dept Rpt 80 and 1990 and 2000 Decennial Census. UNM Bureau of Business and Economic Research,
19 RETAIL SECTOR PULL FACTORS, CITY OF RATON VERSUS NEW MEXICO, 1999 From Taxable Gross Receipts per Dollar of Income Retail Total Building Materials Hardware Gen Merch Stores - No Dept Department Stores Retail Food Stores Motor Vehicle Dealers Gasoline Stations Misc Veh & Auto Acc Dealers Apparel & Accessory Stores Furniture & Appliance Stores Eating & Drinking Places Liquor By the Drink Misc. Retailers Some retail subsectors not shown due to disclosure. Source of Data: NM Taxation and Revenue Dept Rpt 80 and 2000 Decennial Census. UNM Bureau of Business and Economic Research, Pull Factor 19
20 PULL FACTORS BY INDUSTRY, CITY OF RATON VERSUS NEW MEXICO, 1989 AND 1999 From Taxable Gross Receipts per Dollar of Income Total All Industries Contract Construction Manufacturing T.C.U. Wholesale Retail F.I.R.E Sercives Pull Factor Some sectors not shown due to disclosure. Source of Data: NM Taxation and Revenue Dept Rpt 80 and 1990 and 2000 Decennial Census. UNM Bureau of Business and Economic Research,
21 40,000,000 COLFAX COUNTY TOTAL RETAIL GROSS RECEIPTS TAX BY QUARTER, ,000,000 30,000, ,000,000 20,000, ,000,000 10,000,000 5,000,000 0 Source of Data: NM Taxation and Revenue Dept Rpt 80. UNM Bureau of Business and Economic Research,
22 EXAMPLE 3: ANALYSIS OF A NEW (HYPOTHETICAL) RETAIL FOOD STORE IN ARTESIA 22
23 Retail Food Store in Artesia Estimate the sales of a new 30,000 sq. ft. grocery store Estimate the expenditures made by the Artesia area at grocery stores Place the new store into existing Artesia 23
24 Data used: Economic Census Geographic Area Series and Retail Trade Merchandise Line Sales Decennial Census population and income data Bureau of Economic Analysis income data Consumer Price Index Consumer Expenditure Survey Gross Receipts Tax data 24
25 Estimating Sales: Floor space (given) / total floor space per employee = number of employees at establishment Number of employees at establishment X sales per employee = establishment sales in 1997 Establishment sales in 1997 X increase in consumer prices = establishment sales (2002) 25
26 NAICS SUPERMARKETS AND OTHER GROCERY RETAILERS EXCEPT CONVENIENCE STORES, FLOOR SPACE CHARACTERISTICS, NEW MEXICO, 1997 Geographic Area Name Number of establishments Sales ($1,000) Total floor space (1000 sq ft) Sales per Employee ($000) Total Floor Space Per Estab. Derived Total Floor Space per Emp. 1 New Mexico 315 1,934,821 6, , Source: US Census Bureau, Retail Trade: Miscellaneous Subjects: Floor Space By Selected Kind Of Business: Number of establishments Sales ($000) Derived Measures Sales per Employee ($000) Number of Sales Per Employees Geographic Area Name employees Estab ($000) Per Estab New Mexico 315 1,934,821 11,889 6, Albuquerque, MSA ,447 4,420 7, Rest of State 222 1,201,374 7,469 5, Source: Economic Census, US Census Bureau, Retail Trade: Geographic Area Series: calculated using data from the Geographic Area Series and Miscellaneous Subjects Report. 26
27 Estimating Total Establishment Receipts Establishment Total Floorspace (Sq. Ft.) 30,000 Divided by: Total Floorspace (Sq. Ft.) per Employee Equals: Employees at Establishment 57.5 Multiplied by: Receipts ($000) per Employee (1997) $160.8 Equals: Total Establishment Receipts ($000) (1997) $9,
28 Inflating Receipts Total Establishment Receipts ($000) (1997) $9,254.7 Multiplied by: Change in Consumer Price Index 1 7/97-9/03 CPI July July Change 1.12 Change in Cosumer Price Index 1.12 Equals: Estimated Total Establishment Receipts ($000) 2002 $10, Consumer Price Index - All Urban Consumers (CPI-U), Monthly Data - Not Seasonally Adjusted, All items, U.S. City Average 28
29 Estimating Expenditures at Grocery Stores Expenditures to be estimated include: Household expenditures on food Expenditures on non-food items Sales to other businesses 29
30 Which Households? 30
31 INFLATING ARTESIA CCD INCOME FROM 1999 TO 2002: Artesia CCD Aggregate Income, 1999 ($) $225,067,800 Increase in income, , Eddy County Change Total Personal Income ($000) $1,032,922 $1,152, Artesia CCD Estimated Aggregate Income (2001) $251,175,893 Increase in income, , New Mexico Change Total Personal Income ($000) $42,260,462 $44,351, Estimated Total Personal Income 2002 Artesia CCD Estimated Aggregate Income (2002) $263,604, US Census Bureau, Decennial Census, SF3, Bureau of Economic Analysis, Table SA1-3,

32 32
33 Table 2. Income before taxes: Average annualexpenditures and characteristics, Consumer Expenditure Survey, 2001 Complete reporting of income a/ Total Less $5,000 $10,000 $15,000 $20,000 $30,000 $40,000 $50,000 $70,000 complete than to to to to to to to and Item reporting $5,000 $9,999 $14,999 $19,999 $29,999 $39,999 $49,999 $69,999 over Number of consumer units (in thousands)... 88,735 4,100 6,829 8,099 7,014 12,075 10,508 8,737 12,480 18,892 Income before taxes b/ (mean)... $47,507 $1,666 $7,675 $12,380 $17,282 $24,494 $34,456 $44,418 $58,943 $113,978 Income after taxes b/ (mean)... $44,587 $1,528 $7,678 $12,388 $17,086 $23,924 $33,047 $42,362 $55,572 $104,685 Average annual expenditures... $41,395 $20,517 $16,625 $20,642 $25,028 $28,623 $35,430 $40,900 $50,136 $76,124 Food... 5,662 3,497 3,051 3,406 3,763 4,499 5,071 5,904 6,851 9,066 Food at home... 3,253 1,974 2,101 2,210 2,524 2,904 3,136 3,488 3,742 4,565 Cereals and bakery products Cereals and cereal products Bakery products Meats, poultry, fish, and eggs ,145 Beef Pork Other meats Poultry Fish and seafood Eggs Dairy products Fresh milk and cream Other dairy products Fruits and vegetables Fresh fruits Fresh vegetables Processed fruits Processed vegetables Other food at home... 1, ,127 1,212 1,470 Sugar and other sweets Fats and oils Miscellaneous foods Nonalcoholic beverages Food prepared by consumer unit on out-of-town trips Food away from home... 2,409 1, ,195 1,238 1,595 1,935 2,415 3,109 4,501 Alcoholic beverages Housing... 13,120 7,307 6,021 7,472 8,305 9,525 11,006 12,248 15,356 23,622 33
34 Estimating Expenditures on Retail Food Average Annual Expenditures on Food at Home, 2001 Total Complete Reporting, All Income Categories Income before taxes $47,507 Food at home 3,253 Portion of income spent on food at home 6.8% Income Categories $15,000 - $19, % $30,000 - $39, % $70, % Source: Bureau of Labor Statistics, Consumer Expenditure Survey, Table 2, Income Before Taxes,
35 Estimating Expenditures on Retail Food Artesia CCD: Estimated Expenditures on Retail Food, 2002 Artesia CCD Estimated Aggregate Income, $263,604,061 Multiplied by: Portion of income spent on food at home Equals: Estimated Household Expenditures on Retail Food $18,050, income from 2000 Decennial Census inflated by increase in personal income (Bureau of Economic Analysis) in Eddy County ( ) and New Mexico ( ). 35
36 Non-Food Expenditures at Retail Food Stores - Merchandise Line Sales NAICS 4451: Grocery Stores, New Mexico, 1997 Number of establish ments Sales of estabs w/line ($1000) Ln sls as % of sls of est w/ln Ln sls as% of tot sls of NAICS Sales ML code Meaning of Merchandise line (ML) code ($1,000) 0 All merchandise lines 460 X 2,030,390 X Groceries & other foods for human consumption off the premises 460 2,030,390 1,436, Meals, unpackaged snacks, sandwiches, & nonalcoholic beverages ,644 16, Packaged liquor, wine, & beer 207 1,578, , Cigars, cigarettes, tobacco, & smokers' accessories 401 1,969,585 73, Drugs, health aids, & beauty aids 411 1,988, , Soaps, detergents, & household cleaners 377 1,933,081 53, Paper & related products 387 1,952,060 55, Men's wear 25 3, Z 220 Women's, juniors', & misses' wear 22 1, Z 260 Footwear 30 82, Z 270 Sewing, knitting, & needlework goods 29 82, Z 380 Kitchenware & home furnishings ,578 1, Books , Z 440 Photographic equipment & supplies , Z 460 Toys, hobby goods, & games 27 9, Z 600 Hardware, tools, & plumbing & electrical supplies , Z 620 Lawn, garden, farm equipment, supplies, cut flowers, etc ,385 7, Automotive fuels 56 63,060 13, Automotive lubricants ,550 1, Pets, pet foods, & pet supplies ,574 15, All other merchandise ,550 14, All other merchandise 261 1,449,341 86, Nonmerchandise receipts, excluding sales & other taxes 221 1,070,787 21, Source: Economic Census, Merchandise Line Sales, Retail Trade Subject Series,
37 Total Household Expenditure at Grocery Stores Estimating Non-food Expenditures at Retail Food Stores Artesia CCD Estimated Household Expenditures on Retail Food (2002) 18,050,056 Sales of food for off premisis consumption as percent of Grocery Store Sales Total Household Expenditures (food and non-food) in Grocery Stores 25,510, Economic Census, Merchandise Line Sales, Retail Trade Subject Series, New Mexico,
38 Sales to Other Businesses Retail Trade: Class of Customer by Kind of Business, U.S.: NAICS code Description % Sls to general public % Sls to other* % Sls to builders/ contractors % Sls to retailers/ wholesalers 4451 Grocery stores 99.2% * includes sales to the general public, builder and contractors, retailers and wholesalers for resale, institutional, industrial, commercial, and farm users; and government) Source: Economic Census, Retail Trade: Miscellaneous Subjects: Class of Customer by Kind of Business:
39 Total Estimated Expenditures (general public and businesses) to Grocery Stores by Area 2002 Artesia CCD Estimated Sales to Households $25,510,616 Sales to Others 0.8 Estimated Total Expenditures at Grocery Stores $25,716,347 39
40 Tying it all together Taxable gross receipts as percent of sales (NM Grocery Stores, 1997) 92% Multiplied by: Estimated total expenditures of the Artesia CCD at grocery stores $25,716,347 Equals: Estimated gross receipts generated by Artesia CCD for grocery stores $23,709,516 Minus: Actual Taxable Gross Receipts Generated by Artesia Grocery Stores (2002) $20,530,979 Equals: Uncaptured sales gross receipts $3,178,537 Minus: Estimated gross receipts generated by new establishment $9,574,427 Estimated sales compared to estimated expenditures (taxable gross receipts) -6,937,254 40
41 Thanks!! 41
7409 Market Street Wilmington, NC 28411
 Demographic Report 7409 Market Street Employment by Distance Distance Employed Unemployed Unemployment Rate 1-Mile 2,517 104 1.03 % 3-Mile 17,506 713 3.26 % 5-Mile 33,297 1,385 4.05 % Labor & Income Agriculture
March Campaign ROI
 March 2015 Campaign ROI Convergent Team, Attached is your Campaign ROI Report. This report should not only help in raising the sights of the campaign in general, but can also be used to make specific solicitations
Daniel Jung CRENSHAW BLVD CRENSHAW BLVD INGLEWOOD CA, CA Priming Capital 6 Centerpointe Dr La Palma, CA
 11225 CRENSHAW BLVD 11225 CRENSHAW BLVD INGLEWOOD CA, CA 90303 Property Type Retail Building Size Owner (Legal) Property Subtype Auto Dealer Office SF Owner (True) Zoning Industrial SF County Los Angeles
Bureau of Statistics and Plans Business and Economic Statistics Program Government of Guam
 ============================================================================ GUAM CONSUMER PRICE INDEX ST QUARTER 2008 Cost of Living Section VOL. XXXIV, No. Bureau of Statistics and Plans Business and
Procter Properties P.O. Box 3484 Greensboro, NC
 Procter Properties P.O. Box 3484 Greensboro, NC 27402 3208 West Gate City Boulevard 3208 W Gate City Blv Greensboro, NC 27407 Property Type Retail Building Size 11,747 SF Owner (Legal) Property Subtype
Messages and Communications
 Speaker Won Pat Messages and Communications Speaker Won Pat To: Guam Legislature Clerks Office Mon. Jan 5. 2015 at 9:28AM
$1,600,000. Boston Reid LAKESIDE BUSINESS PARK. 117 Crosslake Park Drive Mooresville, NC SITE FEATURES. Lead 2 Real Estate Group
 LAKESIDE BUSINESS PARK 117 Crosslake Park Drive Mooresville, NC 28117 $1,600,000 Marketed By SITE FEATURES 17,000 + SF Industrial Building on 2.6 Acres Located in Lakeside Business Park High Power for
CAMBRIDGE TRADE AREA DEMOGRAPHIC CHARACTERISTICS AND RETAIL SALES POTENTIAL
 CAMBRIDGE TRADE AREA DEMOGRAPHIC CHARACTERISTICS AND RETAIL SALES POTENTIAL Prepared for City of Cambridge September 2011 222 South Ninth Street Suite 380 Minneapolis, Minnesota 55402 (612) 338-5572 Fax:
Sears Tower 233 S Wacker Dr. Nielsen Business-Facts
 PCensus for MapInfo Page 1 PCensus for MapInfo Page -1 Table of Contents... 1 Businesses by Major Sectors... 2 Businesses by 3-digit... 4 2015 Business Summary - Occupation... 7 Retail Business Summary...
Tetrad The Galleria Nielsen 2014 Business-Facts
 PCensus for MapInfo Page 1 PCensus for MapInfo Page 2 Businesses Dominant Major Group Dominant Minor Group Businesses by Major Sectors Retail Trade Motor Vehicle and Parts Dealers Furniture and Home Furnishing
RETAIL FAST FACTS. Monthly Growth Rate Montréal, Quebec Quebec Alberta Nova Scotia Ontario
 Retail Fast Facts Edition for September 2018 Retail Fast Facts Edition for September 2018... 1 Retail Fast Facts with Sales Data for July 2018... 2 Canadian retail sales changed by 0.3 percent.... 2 Provincial
Kansas Department of Revenue Office of Policy and Research State Sales Tax Collections by NAICS
 January-10 February-10 March-10 April-10 111 Crop Production $ 26,331.97 $ 26,393.05 $ 69,200.44 $ 281,670.88 112 Animal Production $ 6,594.84 $ 6,705.43 $ 17,973.29 $ 8,190.77 114 Fishing, Hunting and
Headline and Core Inflation March 2018
 Mar-16 Mar-13 May-13 Jul-13 Sep-13 Nov-13 Jan-1 Mar-1 May-1 Jul-1 Sep-1 Nov-1 Jan-15 Mar-15 May-15 Jul-15 Sep-15 Nov-15 Jan-16 Mar-16 Central Bank of Egypt Headline and Core Inflation March 218 Annual
Headline and Core Inflation April 2018
 Apr-16 Apr-13 Jul-13 Oct-13 Jan-1 Apr-1 Jul-1 Oct-1 Jan-15 Apr-15 Jul-15 Oct-15 Jan-16 Apr-16 Central Bank of Egypt Headline and Core Inflation April 218 Annual headline 1/ (urban) inflation continued
Wholesale trade Retail trade. 10 Value of goods in stock. Annual sales of goods
 6324 ESTABLISHMENTS, EMPLOYEES, ANNUAL SALES OF GOODS, VALUE OF GOODS IN STOCK AND SALES FLOOR SPACE OF WHOLESALE AND RETAIL TRADE BY LEGAL ORGANISATION AND SIZE OF EMPLOYEES (19882012) 43624217 3 6 11
CAPE 2017 June Briefing Note
 CAPE 2017 June 2017 Briefing Note Contents Introduction 3 CAPE Outputs: 2017 Release (April 2017) 4 Demographics 4 Daytime Population 5 Seasonal Population 7 Consumer Expenditure 8 Retail Demand (Unscaled)
THE CAYMAN ISLANDS CONSUMER PRICE INDEX REPORT: DECEMBER 2017 (Date of release: February 15, 2018)
") THE CAYMAN ISLANDS CONSUMER PRICE INDEX REPORT: DECEMBER 2017 (Date of release: February 15, 2018) Average CPI Rose by 1.9% in 2017 This report presents the average CPI for 2017 and the results of the
THE CAYMAN ISLANDS CONSUMER PRICE INDEX REPORT: DECEMBER 2017 (Date of release: February 15, 2018) Average CPI Rose by 1.9% in 2017 This report presents the average CPI for 2017 and the results of the
Headline and Core Inflation December 2017
 Dec-15 Jan-16 Mar-16 May-16 Jul-16 Sep-16 Nov-16 Jan-17 Mar-17 May-17 Jul-17 Sep-17 Nov-17 Dec-12 Mar-13 Jun-13 Sep-13 Dec-13 Mar-1 Jun-1 Sep-1 Dec-1 Mar-15 Jun-15 Sep-15 Dec-15 Mar-16 Sep-16 Mar-17 Sep-17
Basics of Economic Data
 Basics of Economic Data Between the Decennial Census Years Community and Regional Planning 511: Mar. 2006 Kevin Kargacin University of New Mexico Bureau of Business and Economic Research kargacin@unm.edu
FRIENDSWOOD PLANNING & ZONING COMMISSION AGENDA ITEM FORM
 Staff FRIENDSWOOD PLANNING & ZONING COMMISSION AGENDA ITEM FORM Subject: Review of the Permitted Use Table Current Ordinance/Requirement: Appendix C - Zoning Ordinance Section 7. Schedule of District Regulations
Headline and Core Inflation February 2018
 Feb-16 Feb-13 May-13 Aug-13 Nov-13 Feb-1 May-1 Aug-1 Nov-1 Feb-15 May-15 Aug-15 Nov-15 Feb-16 Central Bank of Egypt Headline and Core Inflation February 218 Annual headline 1/ and core 2/ (urban) inflation
MARYLAND DEPARTMENT OF LABOR, LICENSING AND REGULATION Office of Workforce Information and Performance 1100 North Eutaw Street Baltimore, MD 21201
 AND PAYROLLS "Check Out Our Web Site: www.dllr.state.md.us/lmi/index.htm" MARYLAND DEPARTMENT LABOR, LICENSING AND REGULATION Office of Workforce Information and Performance 1100 North Eutaw Street Baltimore,
THE CAYMAN ISLANDS CONSUMER PRICE INDEX REPORT: SEPTEMBER 2017 (Inaugural Report Using the 2016 CPI Basket) (Date of release: November 24, 2017)
 (Date of release: November 24, 2017)") THE CAYMAN ISLANDS CONSUMER PRICE INDEX REPORT: SEPTEMBER 2017 (Inaugural Report Using the 2016 CPI Basket) (Date of release: November 24, 2017) CPI Increased by 1.4% in the Third Quarter of 2017 This
THE CAYMAN ISLANDS CONSUMER PRICE INDEX REPORT: SEPTEMBER 2017 (Inaugural Report Using the 2016 CPI Basket) (Date of release: November 24, 2017) CPI Increased by 1.4% in the Third Quarter of 2017 This
CONSUMER PRICE INDEX (Base: November 1996=100) ANNUAL REVIEW & DETAILED SUB-INDICES RELEASE. December 2000
 ANNUAL REVIEW & DETAILED SUB-INDICES RELEASE. December 2000") CONSUMER PRICE INDEX (Base: November 1996=100) ANNUAL REVIEW & DETAILED SUB-INDICES RELEASE December 2000 This release provides a summary analysis of the major price developments within the main CPI commodity
CONSUMER PRICE INDEX (Base: November 1996=100) ANNUAL REVIEW & DETAILED SUB-INDICES RELEASE December 2000 This release provides a summary analysis of the major price developments within the main CPI commodity
2 Broadway Methuen Site: Primary Market
 2 Broadway Methuen Site: mi.5 1 1.5 Copyright 1988-23 Microsoft Corp. and/or its suppliers. All rights reserved. http://www.microsoft.com/mappoint Copyright 22 by Geographic Data Technology, Inc. All rights
For Sale ± 1.25 Acres 2 Bay Chevron Service Station East John Ralston Road, Houston, TX 77029
 For Sale ± 1.25 Acres 2 Bay Chevron Service Station 11103 East Freeway @ John Ralston Road, Houston, TX 77029 DAC REALTY GROUP, INC CenterPointe Hotels SITE Description: Location: Land Size: Building Size:
Manchester-by-the-Sea Economic Development & Public Facilities Work Group. May 25, 2017 Manchester Community Center
 Manchester-by-the-Sea Economic Development & Public Facilities Work Group May 25, 2017 Manchester Community Center Manchester Master Plan What is it? A comprehensive plan for the entire community, the
Egypt. A: Identification. B: CPI Coverage. Title of the CPI: Consumer Price Index
 Egypt A: Identification Title of the CPI: Consumer Price Index Organisation responsible: Central Agency for Public Mobilization and Statistics (CAPMAS) Periodicity: Monthly Price reference period: January
Kansas Department of Revenue Office of Policy and Research State Sales Tax Collections by NAICS Calendar Year 2007 January-07.
 January-07 February-07 March-07 April-07 11 Agriculture, Forestry, Fishing and Hunting 111 Crop Production $ 112 Animal Production $ 114 Fishing, Hunting and Trapping $ 115 Agriculture and Forestry Support
Sole Proprietorship Returns, 2004
 by Kevin Pierce and Michael Parisi F or Tax Year 2004, there were approximately 20.6 million individual income tax returns that reported nonfarm sole proprietorship activity. Nearly every sole proprietor
CAYMAN ISLANDS CONSUMER PRICE REPORT: 2010 ANNUAL INFLATION (Date: February 9, 2011)
") CAYMAN ISLANDS CONSUMER PRICE REPORT: 2010 ANNUAL INFLATION (Date: February 9, 2011) Consumer Price Index (CPI) Increased by 0.3% in 2010 This report is a consolidated report of the average CPI in 2010
CAYMAN ISLANDS CONSUMER PRICE REPORT: 2010 ANNUAL INFLATION (Date: February 9, 2011) Consumer Price Index (CPI) Increased by 0.3% in 2010 This report is a consolidated report of the average CPI in 2010
Organisation responsible: Australian Bureau of Statistics (ABS)
") Australia A: Identification Title of the CPI: Consumer Price Index Organisation responsible: Australian Bureau of Statistics (ABS) Periodicity: Quarterly Price reference period: 12 months ended 30 June
Australia A: Identification Title of the CPI: Consumer Price Index Organisation responsible: Australian Bureau of Statistics (ABS) Periodicity: Quarterly Price reference period: 12 months ended 30 June
Demographics for 2020 S Main St, South Jacksonville, Illinois, United States
 Demographics for 2020 S Main St, South Jacksonville, Illinois, United States Population Population Total Population (US Census 2010) 3,200 19,103 24,773 Total Population (Current Year) 3,168 18,852 24,419
Consumer Price Index Monthly September 2006
 Consumer Price Index Monthly September 2006 CPI and Inflation Figure 1: change CPI per Month of 2005-2006 The consumer price index (CPI) 1 of the total population for the month of September 2006 is 121.7.
3.4 For the purposes of the Promotion, the following terms are defined as follows:-
 UOB PRVI Miles Card - 4.8 miles per S$1 Spent on Overseas Dining, Shopping and Accommodation Campaign (the Promotion ) Terms and Conditions (the Terms and Conditions ) 1. Eligibility This Promotion is
Rhode Island. A publication of the Labor Market Information Unit
 Rhode Island Employment & Wage Analysis 2012 A publication of the Labor Market Information Unit Summary of Findings The annual Rhode Island Employment and Wage Analysis report highlights Rhode Island s
Harmonised Index of Consumer Prices (HICP) April 2013
 April 2013") Apr-12 May-12 June-12 July-12 Aug-12 Sep-12 Oct-12 Nov-12 Dec-12 Jan-13 Feb-13 Mar-13 Apr-13 MONTENEGRO STATISTICAL OFFICE RELEASE No: 137 Podgorica, 17 May 2013 When using the data please name the source
Apr-12 May-12 June-12 July-12 Aug-12 Sep-12 Oct-12 Nov-12 Dec-12 Jan-13 Feb-13 Mar-13 Apr-13 MONTENEGRO STATISTICAL OFFICE RELEASE No: 137 Podgorica, 17 May 2013 When using the data please name the source
Industry Employment Projections. Overview of Employment Growth. Ashley Leach, Economist. 1 Projected Employment Growth by Substate Area
 2016-2026 Industry Employment Projections Ashley Leach, Economist The New Mexico Department of Workforce Solutions (NMDWS) Economic Research and Analysis Bureau (ER&A) produces long-term industry and occupational
Nominal price of a burger in 1955 is $0.15. Nominal price of a burger in 2002 is $0.79.
 Applications: Real versus nominal prices. Nominal price actual selling price. Real price deflated for inflation price. The Consumer Price Index for Urban Wage Earners and Clerical Workers (CPI-W) increased
The Consumer Price Index
 Catalogue no. 62-001-X The Consumer Price Index How to obtain more information For information about this product or the wide range of services and data available from Statistics Canada, visit our website
CONSUMER PRICE INDEX DETAILED SUB-INDICES RELEASE. March 2003
 CONSUMER PRICE INDEX (Base: December 2001 =100) DETAILED SUB-INDICES RELEASE March 2003 Annual Inflation falls to 4.9 in March This release provides a summary analysis of the major price developments within
Savannah Agee Direct:
 Demographics for 7071 S Bilbo Rd, Orange, Texas 77632, United States Savannah Agee Direct: 409-833-5055 Population Population Total Population (US Census 2010) 358 4,419 8,486 Total Population (Current
BERNALILLO MAINSTREET: COMMUNITY ECONOMIC ASSESSMENT
 University of New Mexico Bureau of Business and Economic Research BERNALILLO MAINSTREET: COMMUNITY ECONOMIC ASSESSMENT Dr. Jeffrey Mitchell With Molly Bleecker Joshua M. Akers October 2007 Funding provided
Village of Manchester Retail Market Analysis
 Village of Manchester Retail Market Analysis Proposal Prepared for: Village of Manchester, Michigan Submitted by: Manchester, Michigan RETAIL MARKET STUDY Figure 1: The Manchester study area is shown above
The Consumer Price Index
 Catalogue no. 62-001-X The Consumer Price Index How to obtain more information For information about this product or the wide range of services and data available from Statistics Canada, visit our website
Headline and Core Inflation December 2009
 Headline and Core Inflation December 2009 Headline CPI published by the Central Agency for Public Mobilization and Statistics (CAPMAS) on January 10, 2010, declined by 1.3 percent (m/m) in December 2009,
Headline and Core Inflation December 2010
 Headline and Core Inflation December 2010 Headline CPI published by CAPMAS on January 10, 2011 decelerated by 0.68 percent (m/m) in December following the 0.82 percent (m/m) decline in November. Despite
IAG Commercial. Albertville Retail - Land. For Sale. Prepared By:
 Albertville Retail - Land For Sale Albertville Retail - Land 6600 Laketowne Place Albertville, MN 55301 Prepared By: IAG Commercial 222 South Ninth Street, Suite 1600 Minneapolis, MN 55402 Jeff LaFavre,
June Namibia Consumer Price Index. Tel: Fax:
 Namibia Consumer Price Index N C P I June 2017 Namibia Statistics Agency P.O. Box 2133, FGI House, Post Street Mall, Windhoek, Namibia Tel: +264 61 431 3200 Fax: +264 61 431 3253 Email: info@nsa.org.na
Commercial Business Registration Fee $35.00 per year
 Commercial Business Registration Fee $35.00 per year City Ordinance #1172-81 requires that all businesses apply for and obtain a business registration prior to engaging in business. Please fill out the
Outline of presentation. National Accounts Office September 2016 Chiba, Japan
 25-27 September 2016 Chiba, Japan National Accounts Office Office of the National Economic and Social Development Board (NESDB) Outline of presentation Short Term Indicator Quarterly Gross Domestic Product
The Consumer Price Index
 Catalogue no. 62-001-X The Consumer Price Index How to obtain more information For information about this product or the wide range of services and data available from Statistics Canada, visit our website
Consumer Price Index (CPI). Base 2016 Harmonised Index of Consumer Prices (HICP). Base 2015 October 2018
. Base 2016 Harmonised Index of Consumer Prices (HICP). Base 2015 October 2018") 14 November 2018 Consumer Price Index (CPI). Base 2016 Harmonised Index of Consumer Prices (HICP). Base 2015 October 2018 Main results The annual variation rate of CPI in October is 2.3%, the same as that
14 November 2018 Consumer Price Index (CPI). Base 2016 Harmonised Index of Consumer Prices (HICP). Base 2015 October 2018 Main results The annual variation rate of CPI in October is 2.3%, the same as that
NCPI. August Namibia Consumer Price index. Namibia Consumer Price index - August
 NCPI Namibia Consumer Price index August 2018 Namibia Consumer Price index - August 2018 1 Mission Statement Leveraging on partnerships and innovative technologies, to produce and disseminate relevant,
Statistical release P0141
 Statistical release Consumer Price Index June 2015 Embargoed until: 22 July 2015 10:00 Enquiries: Forthcoming issue: Expected release date Marietjie Bennett / Anita Voges July 2015 19 August 2015 (012)
Consumer Price Index (CPI). Base 2016 Harmonised Index of Consumer Prices (HICP). Base 2015 September 2018
. Base 2016 Harmonised Index of Consumer Prices (HICP). Base 2015 September 2018") 11 October 2018 Consumer Price Index (CPI). Base 2016 Harmonised Index of Consumer Prices (HICP). Base 2015 September 2018 Main results The annual rate of CPI for the month of September stands at 2.3%,
11 October 2018 Consumer Price Index (CPI). Base 2016 Harmonised Index of Consumer Prices (HICP). Base 2015 September 2018 Main results The annual rate of CPI for the month of September stands at 2.3%,
Consumer Price Index. June Business and economy
 Consumer Price June 2017 Business and economy Table of Contents A note to the reader...ii 1 MONTHLY CHANGE OF THE CPI... 1 1.1 CPI AND INFLATION... 1 1.2 CHANGES IN SECTOR... 1 1.3 CHANGES IN CATEGORIES
BLS. Consumer Expenditures in U.S. Department of Labor U.S. Bureau of Labor Statisitics March Report 1023
 Consumer Expenditures in 2008 U.S. Department of Labor U.S. Bureau of Labor Statisitics March 2010 Report 1023 C 1 onsumer spent $50,486, on average, in 2008, a 1.7-percent increase over the previous year.
Sales and Use Tax Collection Report April 2013 Issued May 10, 2013
 Financial Services Sales Tax Division 215 N. Mason Street 2 nd Floor PO Box 580Fort Collins, CO 80522-0580 970.221.6780 970.221.6782 - fax fcgov.com Sales and Use Tax Collection Report April 2013 Issued
NCPI. March Namibia Consumer Price index. Namibia Consumer Price index - March
 NCPI Namibia Consumer Price index March 2018 Namibia Consumer Price index - March 2018 1 Mission Statement Leveraging on partnerships and innovative technologies, to produce and disseminate relevant, quality,
Consumer Expenditures in 2000
 Cornell University ILR School DigitalCommons@ILR Federal Publications Key Workplace Documents 4-2002 Consumer Expenditures in 2000 Bureau of Labor Statistics Follow this and additional works at: http://digitalcommons.ilr.cornell.edu/key_workplace
Consumer Price Index. March Business and economy
 Consumer Price March 2018 Business and economy Table of Contents A note to the reader...ii 1 MONTHLY CHANGE OF THE CPI... 1 1.1 CPI AND INFLATION... 1 1.2 CHANGES IN SECTOR... 1 1.3 CHANGES IN CATEGORIES
Small Businesses in Broward There are 33,400 small businesses in Broward County, which provide 135,000 jobs and have a combined payroll of $4 billion.
 Planning Services Division February 2006 Number 43 Small Businesses in Broward There are 33,400 small businesses in Broward County, which provide 135,000 jobs and have a combined payroll of $4 billion.
Consumer Price Index. December Business and economy
 Consumer Price December 2018 Business and economy Table of Contents A note to the reader...ii 1 MONTHLY CHANGE OF THE CPI... 1 1.1 CPI AND INFLATION... 1 1.2 CHANGES IN SECTOR... 1 1.3 CHANGES IN CATEGORIES
Consumer Price Index. February Business and economy
 Consumer Price February 2018 Business and economy Table of Contents A note to the reader...ii 1 MONTHLY CHANGE OF THE CPI... 1 1.1 CPI AND INFLATION... 1 1.2 CHANGES IN SECTOR... 1 1.3 CHANGES IN CATEGORIES
Consumer Price Index. September Business and economy
 Consumer Price September 2018 Business and economy Table of Contents A note to the reader...ii 1 MONTHLY CHANGE OF THE CPI... 1 1.1 CPI AND INFLATION... 1 1.2 CHANGES IN SECTOR... 1 1.3 CHANGES IN CATEGORIES
Overall index Monthly change Change over last Annual change
 13 February 2015 Consumer Price Index (CPI). Base 2011 January 2015 all index Monthly change Change over last Annual change January 1.6 1.6 1.3 Main results The annual change of the CPI for the of January
NCPI. Namibia Consumer Price index. January 2018
 NCPI Namibia Consumer Price index January 2018 Namibia Consumer Price index - January 2018 1 Mission Statement Leveraging on partnerships and innovative technologies, to produce and disseminate relevant,
Great Lakes & St. Lawrence Region 2015 Economy Profile Update
 Great Lakes & St. Lawrence Region 2015 Economy Profile Update Great Lakes & St. Lawrence Region Best available data as of March 2011 2 Non-Farm Economy $5.5 trillion GDP (83% states / 17% Canadian provinces)
Charlotte County SOUTHWEST FLORIDA Economic Development Office
 Charlotte County SOUTHWEST FLORIDA Economic Development Office QUARTERLY ECONOMIC INDICATOR REPORT October 2017 18501 Murdock Circle, Suite 302 Port Charlotte, FL 33948 Office: 941.764.4941 www.cleared4takeoff.com
Haralson County Community Profile
 Haralson County Community Profile 113th in order of county creation January 26, 1856 Prepared for Haralson County Cooperative Extension by the Center for Agribusiness and Economic Development The University
The Consumer Price Index
 Catalogue no. 62-001-X The Consumer Price Index How to obtain more information Specific inquiries about this product and related statistics or services should be directed to: Client Services Unit, Consumer
Consumer Price Index (CPI). Base 2011 January Monthly change Change over last Annual change
. Base 2011 January Monthly change Change over last Annual change") 14 February 2014 Consumer Price Index (CPI). Base 2011 January 2014 all index Monthly change Change over last Annual change January January 1.3 1.3 Main results The annual change of the CPI for the of
14 February 2014 Consumer Price Index (CPI). Base 2011 January 2014 all index Monthly change Change over last Annual change January January 1.3 1.3 Main results The annual change of the CPI for the of
Data Source: National Bureau of Statistics
 ( Report Date: August 2017 Data Source: National Bureau of Statistics Brief Methodology 1 All Items Index 5 Food Index 6 All Items Less Farm Produce 7 Infographics 9 Statistical News 13 Acknowledgements/Contacts
Animal Production, Dairy, Beef, Sheep, Chickens, Etc $ Forestry Management and Sales Standing Timber Only $350.
 111998 Crop Production, Agriculture, Farming, Nursery, Fruit Growers, Etc $100.00 112990 Animal Production, Dairy, Beef, Sheep, Chickens, Etc $100.00 113110 Forestry Management and Sales Standing Timber
Polk County Community Profile
 Polk County Community Profile 96th in order of county creation December 20, 1851 Prepared for Polk County Cooperative Extension by the Center for Agribusiness and Economic Development The University of
Overall index Monthly variation Accumulated variation Annual variation January
 15 February 2017 Consumer Price Index (CPI). Base 2016 January 2017 all index Monthly variation Accumulated variation Annual variation January -0.5-0.5 3.0 Main results The annual variation of the CPI
Consumer Price Index (CPI). Base 2016 Harmonised Index of Consumer Prices (HICP). Base 2015 January 2019
. Base 2016 Harmonised Index of Consumer Prices (HICP). Base 2015 January 2019") 15 February 2019 Consumer Price Index (CPI). Base 2016 Harmonised Index of Consumer Prices (HICP). Base 2015 January 2019 Main results In January, the annual variation rate of the CPI was 1.0%, two tenths
15 February 2019 Consumer Price Index (CPI). Base 2016 Harmonised Index of Consumer Prices (HICP). Base 2015 January 2019 Main results In January, the annual variation rate of the CPI was 1.0%, two tenths
Empowerment of social dialogue in trade sector as a contribution to the overarching EU employment and social policy challenges
 PROJECT TRASDEM: Empowerment of social dialogue in trade sector as a contribution to the overarching EU employment and social policy challenges International workshop /project meeting of project partners
Report Date: May Data Source: National Bureau of Statistics. Brief Methodology 1. All Items Index 5
 ( Report Date: May 2017 Data Source: National Bureau of Statistics Brief Methodology 1 All Items Index 5 Food Index 6 All Items Less Farm Produce 6 Infographics 7 Statistical News 11 Acknowledgements/Contacts
Statistical release P0141
 Statistical release Consumer Price Index September 2010 Embargoed until: 27 October 2010 11:30 Enquiries: Forthcoming issue: Expected release date User information services October 2010 24 November 2010
Study Area Maps. Profile Tables. The CORE Shopping Centre Pitney Bowes 2018 Consumer Spend Potential
 Powered by Sitewise Page 1 Study Area Maps Profile Tables s Summary Food Shelter Oation Clothing and Accessories Transportation Health Care Personal Care Recreation Education and Reading Materials Tobacco
The Economic Base of San Juan County, NM. PREPARED BY: The Office of Policy Analysis at Arrowhead Center, New Mexico State University.
 The Economic Base of San Juan County, NM PREPARED BY: The Office of Policy Analysis at Arrowhead Center, New Mexico State University DATE: July 2015 The Economic Base of San Juan County, New Mexico Introduction
Subnational PPP toward Integration of ICP and CPI: The Case of the Philippines
 Subnational PPP toward Integration of ICP and CPI: The Case of the Philippines Yuri Dikhanov 3 rd Regional Coordinating Agencies meeting October 28-30, 2015 Washington, DC losure Authorized Public Disclosure
MASS LAYOFFS DECEMBER 2012 ANNUAL TOTALS 2012
 For release 10:00 a.m. (EST) Friday, January 25, 2013 USDL-13-0106 Technical information: (202) 691-6392 mlsinfo@bls.gov www.bls.gov/mls Media contact: (202) 691-5902 PressOffice@bls.gov MASS LAYOFFS DECEMBER
SKECHERS HERMOSA BEACH DESIGN CENTER & EXECUTIVE OFFICES
 SKECHERS HERMOSA BEACH DESIGN CENTER & EXECUTIVE OFFICES NET FISCAL IMPACT & ECONOMIC BENEFIT ANALYSIS HERMOSA BEACH, CA Prepared For: SKECHERS U.S.A., INC. Prepared By: KOSMONT COMPANIES 1601 N. Sepulveda
FOR SALE. For More Information:
 FOR SALE 67th Street 3415 67th Place, Vero Beach, FL 32967 PARCEL ID #: 32391000000100000009.1 LOCATION: Great location on the corner of US 1 and Quay Dock Rd with approximately 54 feet of US 1 frontage.
Oregon s Unemployment Rate Was Essentially Unchanged at 8.4 Percent in January, as Payroll Employment Grew by 4,200. Millions
 NEWS 875 Union Street NE Salem, Oregon 97311 PH: 503.947.1394 TTY-TDD 711 www.qualityinfo.org FOR IMMEDIATE RELEASE: March 5, 2013 PRESS CONFERENCE PRESENTER: Nick Beleiciks, State Employment Economist
Employment Situation: Ohio and U.S. (Seasonally Adjusted) 20,000 15,000 10,000 5,000 -5,000. In This Issue
 20,000 15,000 10,000 5,000 -5,000. In This Issue") Civilian Labor Force Ohio s unemployment rate was 4.8 percent in November 217, down from 5.1 percent in October 217. The number of unemployed in Ohio in November was 279,, down 17, from 296, in October.
Civilian Labor Force Ohio s unemployment rate was 4.8 percent in November 217, down from 5.1 percent in October 217. The number of unemployed in Ohio in November was 279,, down 17, from 296, in October.
PRESS RELEASE. The evolution of the Consumer Price Index (CPI) of April 2018 (reference year 2009=100.0) is depicted as follows:
 of April 2018 (reference year 2009=100.0) is depicted as follows:") HELLENIC REPUBLIC HELLENIC STATISTICAL AUTHORITY Piraeus, 10 May 2018 PRESS RELEASE CONSUMER PRICE INDEX: April 2018, annual inflation 0.0% The evolution of the Consumer Price Index (CPI) of April 2018
HELLENIC REPUBLIC HELLENIC STATISTICAL AUTHORITY Piraeus, 10 May 2018 PRESS RELEASE CONSUMER PRICE INDEX: April 2018, annual inflation 0.0% The evolution of the Consumer Price Index (CPI) of April 2018
Oregon s Payroll Employment Dropped by 6,400 in February While the Unemployment Rate Held Steady at 8.8 Percent
 FOR IMMEDIATE RELEASE: March 20, 2012 PRESS CONFERENCE PRESENTER: Nick Beleiciks, State Employment Economist CONTACT INFORMATION: David Cooke, Economist (503) 947 1272 Oregon s Payroll Employment Dropped
Report Contents. PCensus Online Sample Report AGS Consumer Spending. Powered by PCensus Page 1
 Powered by PCensus Page 1 Report Contents Map Consumer Spending Summary Consumer Spending Apparel Consumer Spending Footwear, Apparel Services and Accessories Consumer Spending Contributions and Education
DRAFT ECONOMIC ANALYSIS OF THE PROPOSED RINCON DEL RIO SENIOR HOUSING PROJECT IN NEVADA COUNTY, CALIFORNIA MAY 28, 2009
 DRAFT ECONOMIC ANALYSIS OF THE PROPOSED RINCON DEL RIO SENIOR HOUSING PROJECT IN NEVADA COUNTY, CALIFORNIA MAY 28, 2009 Prepared for Jim and Carol Young Prepared by Applied Development Economics 100 Pringle
Lee s Summit EDC May 28, 2015
 Lee s Summit EDC May 28, 2015 May You Live in Interesting Times Technology Talent Quality of Life Technology Getting More Done With Less 10% U.S. GDP and Employment Performance % Change Since 2007 8% 6%
HELLENIC REPUBLIC HELLENIC STATISTICAL AUTHORITY Piraeus, 31 August 2018 PRESS RELEASE. TURNOVER INDEX IN RETAIL TRADE: June 2018, y-o-y increase 3.
 Rates of HELLENIC REPUBLIC HELLENIC STATISTICAL AUTHORITY Piraeus, 31 August 2018 PRESS RELEASE TURNOVER INDEX IN RETAIL TRADE: 2018, y-o-y increase 3.3% The Hellenic Statistical Authority announces the
Employment Situation: Ohio and U.S. (Seasonally Adjusted) 25,000 20,000 15,000 10,000 5,000. In This Issue
 25,000 20,000 15,000 10,000 5,000. In This Issue") Civilian Labor Force Ohio s unemployment rate was 4.5 percent in June 218, up from 4.3 percent in May. The number of unemployed in Ohio in June was 259,, up 9, from 25, in May. The number of unemployed
Civilian Labor Force Ohio s unemployment rate was 4.5 percent in June 218, up from 4.3 percent in May. The number of unemployed in Ohio in June was 259,, up 9, from 25, in May. The number of unemployed
Oregon s Unemployment Rate Was Unchanged at 8.4 Percent in February, as Payroll Employment Grew by 6,800. Millions
 NEWS 875 Union Street NE Salem, Oregon 97311 PH: 503.947.1394 TTY-TDD 711 www.qualityinfo.org FOR IMMEDIATE RELEASE: March 19, 2013 PRESS CONFERENCE PRESENTER: Nick Beleiciks, State Employment Economist
Consumer Price Index Detailed Sub-Indices
 An Phríomh-Oifig Staidrimh Central Statistics Office 9 August 2012 Comparison of main CPI divisions to the overall CPI annual - July 2012 01 02 03 04 All Items 1.6 Consumer Price Detailed Sub-Indices July
Kentucky Cabinet for Economic Development Office of Workforce, Community Development, and Research
 Table 3 Kentucky s Exports to the World by Industry Sector - Inclusive of Year to Date () Values in $Thousands 2016 Year to Date - Total All Industries $ 29,201,010 $ 30,857,275 5.7% $ 20,030,998 $ 20,925,509
Consumer Expenditures in 2001
 Cornell University ILR School DigitalCommons@ILR Federal Publications Key Workplace Documents 4-2003 Consumer Expenditures in 2001 Bureau of Labor Statistics Follow this and additional works at: http://digitalcommons.ilr.cornell.edu/key_workplace