PROPERTY OFFERING. 32 Audette Rd, Franklin CT 06254
|
|
|
- Gavin Chandler
- 5 years ago
- Views:
Transcription


1 PROPERTY OFFERING 32 Audette Rd, Franklin CT 06254


2 32 Audette Rd ~ Land & Location Map Information deemed to be reliable but not guaranteed. Parties are required to verify all information independently as the Owner and Representatives have no liability as to the accuracy or completeness of the material. All images, verbiage, layout and marketing materials herein are protected by copyright law.


3 32 Audette Rd ~ Topo Map Information deemed to be reliable but not guaranteed. Parties are required to verify all information independently as the Owner and Representatives have no liability as to the accuracy or completeness of the material. All images, verbiage, layout and marketing materials herein are protected by copyright law.


4 32 Audette Rd ~ Fema Flood Information deemed to be reliable but not guaranteed. Parties are required to verify all information independently as the Owner and Representatives have no liability as to the accuracy or completeness of the material. All images, verbiage, layout and marketing materials herein are protected by copyright law.


5 32 Audette Rd ~ State Wetlands Information deemed to be reliable but not guaranteed. Parties are required to verify all information independently as the Owner and Representatives have no liability as to the accuracy or completeness of the material. All images, verbiage, layout and marketing materials herein are protected by copyright law.


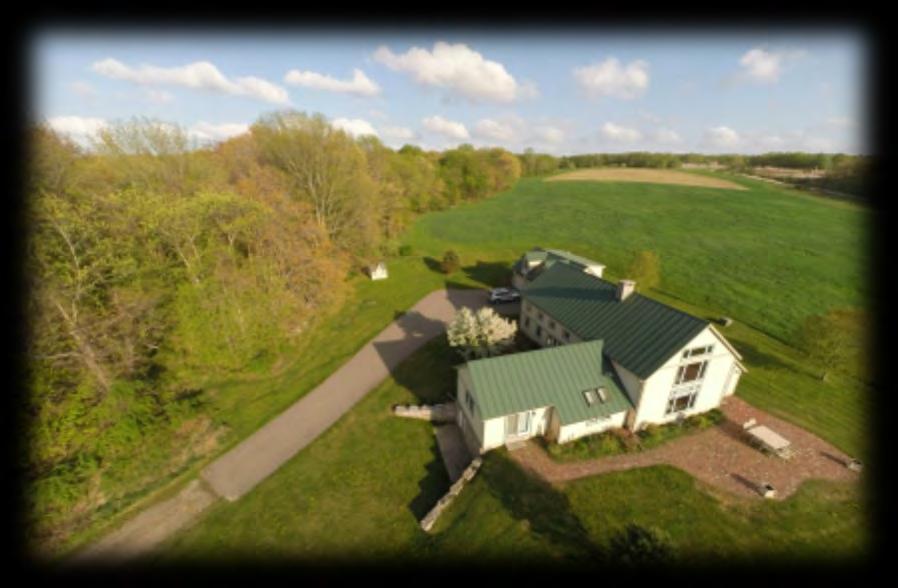
6 Exterior Photo Highlights Information deemed to be reliable but not guaranteed. Parties are required to verify all information independently as the Owner and Representatives have no liability as to the accuracy or completeness of the material.


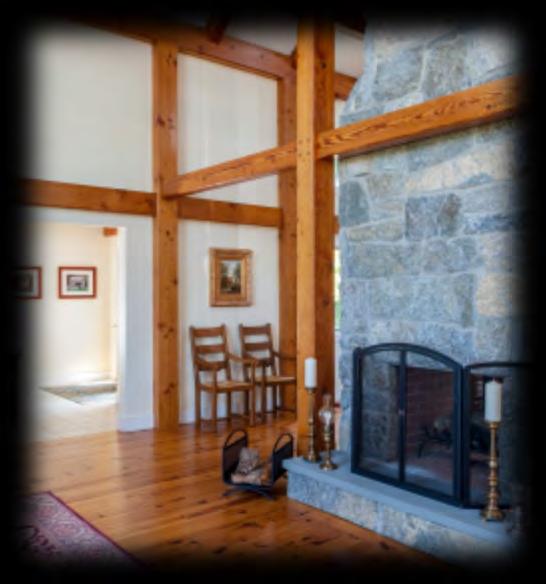
7 Interior Photo Highlights Information deemed to be reliable but not guaranteed. Parties are required to verify all information independently as the Owner and Representatives have no liability as to the accuracy or completeness of the material.
8
9
10
11
12
13
14
15
16
17
18 Franklin, Connecticut CERC Town Profile 2014 Town Hall 7 Meetinghouse Hill Franklin, CT (860) Demographics Population (2012) '12-'20 Growth / Yr Belongs to New London County LMA Norwich - New London Southeast Economic Dev. Region Southeastern Connecticut Planning Area Town County State 1,835 1,924 1,984 1, % 259, , , , % 3,405,565 3,545,837 3,572,213 3,690, % Land Area (sq. miles) Pop./ Sq. Mile (2012) , Median Age (2012) Households (2012) ,817 1,360,184 Med HH Inc. (2012) $88,333 $68,310 $69,519 Economics Race/Ethnicity (2012) White Black Asian Pacific Native American Other/Multi-Race Hispanic (any race) Poverty Rate (2012) Educational Attainment (2012) Persons Age 25 or Older High School Graduate Associates Degree Bachelors or Higher Incorporated in 1786 Town County State 1, ,453 14,834 12,047 1,472 2,802, , ,827 8, , , , ,185 Business Profile (2013) Top Five Grand List (2013) Amount Sector Units Employment NOG Realty Holdings LLC $3,693,340 Connecticut Light & Power $3,257,830 Total - All Industries Moark $3,141, Agri, Forestry, Fishing, Hunting Southern New England Eggs LLC $2,445, Construction Piotrkowski Samual $1,941, Manufacturing NA NA Net Grand List (2013) $189,115, Wholesale Trade Major Employers (2014) 44 Retail Trade 62 Health Care and Social Assistance Total Government Moark Egg Backus Hospital Plant Group Inc Norwich Orthopedic Group Sterling Superior Education School Year Town State Total Town School Enrollment ,313 Most public school students through grade 8 attend Franklin School District, which has 222 students. Students then go to multiple school districts including Norwich Free Academy, Lebanon School District. For more education data see: Students per Computer Town State Elementary: WEB/ResearchandReports/SS PReports.aspx Middle: Secondary: Town Profiles October, Page % Town % 124 9% % Average Class Size Grade K 20.0 Grade Grade Grade High School NA 8.1% Connecticut Mastery Test Percent Above Goal Reading Math Writing 10.0% % State % 677,253 28% 177,531 7% 879,089 36% Age Distribution (2012) Total Male 46 2% 181 9% 85 4% % % 132 7% 1,005 Female 55 3% 146 7% 61 3% % % 164 8% 979 County Total 14,771 5% 44,233 16% 27,177 10% 91,182 33% 57,129 21% 39,231 14% 273,723 State Total 200,031 6% 612,181 17% 328,661 9% 1,194,793 33% 726,725 20% 509,822 14% 3,572,213 % of Net 2.0% 1.7% 1.7% 1.3% 1.0% Grade 4 Grade 6 Grade 8 Town State Town State Town State Average SAT Score Town State Reading Writing NA NA Math NA 506 No representation or warranties, expressed or implied, are given regarding the accuracy of this information.

19 Franklin Connecticut Government Government Form: Selectman-Town Meeting Total Revenue (2012) Tax Revenue Non-tax Revenue Intergovernmental Per Capita Tax (2012) As % of State Average $6,172,683 $4,380,123 $1,792,560 $1,600,115 $2, % Total Expenditures (2012) Education Other Total Indebtness (2012) As % of Expenditures Per Capita As % of State Average $6,116,532 $4,364,345 $1,752,187 $2,191, % $1, % Annual Debt Service (2012) $230,195 As % of Expenditures Eq. Net Grand List (2010) 3.8% $291,331,006 Per Capita $146,840 As % of State Average 101% Moody's Bond Rating (2012) Actual Mill Rate (2012) Equalized Mill Rate (2012) % of Grand List Com/Ind (2010) NA % Housing/Real Estate Housing Stock (2012) Town County State Total Units % Single Unit New Permits Auth. (2012) % 1 120, % 291 1,485, % 4,669 As % Existing Units Demolitions (2012) 0.13% % % 955 House Sales (2011) ,847 Median Price $205,000 $238,000 $291,000 Built Pre 1950 share (2012) 22.1% 30.1% 30.2% Labor Force Place of Residence (2013) Labor Force Employed Unemployed Unemployment Rate Place of Work (2013) Units Total Employment 2000-'13 AAGR Mfg Employment Other Information Crime Rate (2012) Per 100,000 Residents Library (2013) Public Web Computers Circulation per Capita Families Receiving (2014) Temporary Assistance Population Receiving (2014) Food Stamps Town Profiles October, Page 2 Town County State 1, ,217 1,859,934 1, ,813 1,715, , , % 7.9% 7.8% 100 7, , ,143 1,640, % -0.3% 0.2% NA 14, ,828 Town State 1,395 2, Distance to Major Cities Hartford Boston New York City Providence Owner Occupied Dwellings (2012) As % Total Dwellings Subsidized Housing (2012) Distribution of House Sales (2011) Number of Sales Less than $100,000 $100,000-$199,999 $200,000-$299,999 $300,000-$399,999 $400,000 or More Town County State ,205 3,494 2,086 4,670 Connecticut Commuters (2011) Commuters into Town from: Town Residents Commuting to: Norwich 150 Norwich 166 Windham 85 Groton 78 Franklin 77 Franklin 77 Lebanon 64 Montville 69 Plainfield 51 Windham 61 Griswold 41 Waterford 55 Sprague 31 Ledyard 40 Bozrah 29 Lebanon 33 Colchester 25 Hartford 33 Miles Residential Utilities Electric Provider Connecticut Light & Power (800) Gas Provider Yankee Gas Company (800) Water Provider Municipal Provider Local Contact Cable Provider Comcast Norwich (800) , ,560 86% 60% 63% 17 12, , No representation or warranties, expressed or implied, are given regarding the accuracy of this information.
FOR LEASE. 540 Federal Road, Brookfield, CT. Scott Lavelle
 FOR LEASE 540 Federal Road, Brookfield, CT R E TA I L M E D I C A L O F F I C E Retail Retail Retail PROPERTY OVERVIEW 540 Federal Road, OFFERING SUMMARY: Available SF: 952 SF 5,712 SF Lease Rate: $16
PROPERTY OFFERING 55 Otter Cove DR Old Saybrook CT 06475
 PROPERTY OFFERING 55 Otter Cove DR Old Saybrook CT 06475 Welcome to Old Saybrook, CT Welcome to Old Saybrook, Connecticut, where the Connecticut River Meets the Sound. We are one of the oldest towns in
Tyler Area Economic Overview
 Tyler Area Economic Overview Demographic Profile. 2 Unemployment Rate. 4 Wage Trends. 4 Cost of Living Index...... 5 Industry Clusters. 5 Occupation Snapshot. 6 Education Levels 7 Gross Domestic Product
SDs from Regional Peer Group Mean. SDs from Size Peer Group Mean
 Family: Population Demographics Population Entire MSA 602894 Central Cities (CC) 227,818 Outside Central Cities 375,076 Percent of Entire MSA 37.79% Population in CC Percent Change in Population from 1999
SDs from Regional Peer Group Mean. SDs from Size Peer Group Mean
 Family: Population Demographics Population Entire MSA 1187941 Central Cities (CC) 511,843 Outside Central Cities 676,098 Percent of Entire MSA 43.09% Population in CC Percent Change in Population from
SDs from Regional Peer Group Mean. SDs from Size Peer Group Mean
 Family: Population Demographics Population Entire MSA 661645 Central Cities (CC) 247,057 Outside Central Cities 414,588 Percent of Entire MSA 37.34% Population in CC Percent Change in Population from 1999
SDs from Regional Peer Group Mean. SDs from Size Peer Group Mean
 Family: Population Demographics Population Entire MSA 583845 Central Cities (CC) 316,649 Outside Central Cities 267,196 Percent of Entire MSA 54.24% Population in CC Percent Change in Population from 1999
SDs from Regional Peer Group Mean. SDs from Size Peer Group Mean
 Family: Population Demographics Population Entire MSA 1251509 Central Cities (CC) 540,423 Outside Central Cities 711,086 Percent of Entire MSA 43.18% Population in CC Percent Change in Population from
SDs from Regional Peer Group Mean. SDs from Size Peer Group Mean
 Family: Population Demographics Population Entire MSA 1135614 Central Cities (CC) 677,766 Outside Central Cities 457,848 Percent of Entire MSA 59.68% Population in CC Percent Change in Population from
SDs from Regional Peer Group Mean. SDs from Size Peer Group Mean
 Family: Population Demographics Population Entire MSA 591932 Central Cities (CC) 260,970 Outside Central Cities 330,962 Percent of Entire MSA 44.09% Population in CC Percent Change in Population from 1999
SDs from Regional Peer Group Mean. SDs from Size Peer Group Mean
 Family: Population Demographics Population Entire MSA 1100491 Central Cities (CC) 735,617 Outside Central Cities 364,874 Percent of Entire MSA 66.84% Population in CC Percent Change in Population from
SDs from Regional Peer Group Mean. SDs from Size Peer Group Mean
 Family: Population Demographics Population Entire MSA 540258 Central Cities (CC) 198,915 Outside Central Cities 341,343 Percent of Entire MSA 36.82% Population in CC Percent Change in Population from 1999
SDs from Regional Peer Group Mean. SDs from Size Peer Group Mean
 Family: Population Demographics Population Entire MSA 1249763 Central Cities (CC) 691,295 Outside Central Cities 558,468 Percent of Entire MSA 55.31% Population in CC Percent Change in Population from
SDs from Regional Peer Group Mean. SDs from Size Peer Group Mean
 Family: Population Demographics Population Entire MSA 1088514 Central Cities (CC) 272,953 Outside Central Cities 815,561 Percent of Entire MSA 25.08% Population in CC Percent Change in Population from
SDs from Regional Peer Group Mean. SDs from Size Peer Group Mean
 Family: Population Demographics Population Entire MSA 922516 Central Cities (CC) 470,859 Outside Central Cities 451,657 Percent of Entire MSA 51.04% Population in CC Percent Change in Population from 1999
SDs from Regional Peer Group Mean. SDs from Size Peer Group Mean
 Family: Population Demographics Population Entire MSA 687249 Central Cities (CC) 198,500 Outside Central Cities 488,749 Percent of Entire MSA 28.88% Population in CC Percent Change in Population from 1999
SDs from Regional Peer Group Mean. SDs from Size Peer Group Mean
 Family: Population Demographics Population Entire MSA 542149 Central Cities (CC) 181870 Outside Central Cities 360279 Percent of Entire MSA 33.55% Population in CC Percent Change in Population from 1999
SDs from Regional Peer Group Mean. SDs from Size Peer Group Mean
 Family: Population Demographics Population Entire MSA 1025598 Central Cities (CC) 293,834 Outside Central Cities 731,764 Percent of Entire MSA 28.65% Population in CC Percent Change in Population from
SDs from Regional Peer Group Mean. SDs from Size Peer Group Mean
 Family: Population Demographics Population Entire MSA 875583 Central Cities (CC) 232,835 Outside Central Cities 642,748 Percent of Entire MSA 26.59% Population in CC Percent Change in Population from 1999
SDs from Regional Peer Group Mean. SDs from Size Peer Group Mean
 Family: Population Demographics Population Entire MSA 716998 Central Cities (CC) 448,275 Outside Central Cities 268,723 Percent of Entire MSA 62.52% Population in CC Percent Change in Population from 1999
SDs from Regional Peer Group Mean. SDs from Size Peer Group Mean
 Family: Population Demographics Population Entire MSA 1333914 Central Cities (CC) 284,943 Outside Central Cities 1,048,971 Percent of Entire MSA 21.36% Population in CC Percent Change in Population from
SDs from Regional Peer Group Mean. SDs from Size Peer Group Mean
 Family: Population Demographics Population Entire MSA 712738 Central Cities (CC) 448,607 Outside Central Cities 264,131 Percent of Entire MSA 62.94% Population in CC Percent Change in Population from 1999
SDs from Regional Peer Group Mean. SDs from Size Peer Group Mean. Population Entire MSA
 Family: Population Demographics Population Entire MSA 1169641 Central Cities (CC) 0 Outside Central Cities 1,169,641 Percent of Entire MSA 0% Population in CC Percent Change in Population from 1999 to
ECONOMIC OVERVIEW DuPage County, Illinois
 ECONOMIC OVERVIEW DuPage County, Illinois DEMOGRAPHIC PROFILE... 3 EMPLOYMENT TRENDS... 5 UNEMPLOYMENT RATE... 5 WAGE TRENDS... 6 COST OF LIVING INDEX... 7 INDUSTRY SNAPSHOT... 8 OCCUPATION SNAPSHOT...
SDs from Regional Peer Group Mean. SDs from Size Peer Group Mean
 Family: Population Demographics Population Entire MSA 3251876 Central Cities (CC) 2,078,750 Outside Central Cities 1,173,126 Percent of Entire MSA 63.92% Population in CC Percent Change in Population from
SDs from Regional Peer Group Mean. SDs from Size Peer Group Mean
 Family: Population Demographics Population Entire MSA 1592383 Central Cities (CC) 1,181,140 Outside Central Cities 411,243 Percent of Entire MSA 74.17% Population in CC Percent Change in Population from
SDs from Regional Peer Group Mean. SDs from Size Peer Group Mean
 Family: Population Demographics Population Entire MSA 1776062 Central Cities (CC) 716,793 Outside Central Cities 1,059,269 Percent of Entire MSA 40.36% Population in CC Percent Change in Population from
SDs from Regional Peer Group Mean. SDs from Size Peer Group Mean
 Family: Population Demographics Population Entire MSA 4112198 Central Cities (CC) 416,474 Outside Central Cities 3,695,724 Percent of Entire MSA 10.13% Population in CC Percent Change in Population from
SDs from Regional Peer Group Mean. SDs from Size Peer Group Mean
 Family: Population Demographics Population Entire MSA 9519338 Central Cities (CC) 4408996 Outside Central Cities 5110342 Percent of Entire MSA 46.32% Population in CC Percent Change in Population from
SDs from Regional Peer Group Mean. SDs from Size Peer Group Mean
 Family: Population Demographics Population Entire MSA 1623018 Central Cities (CC) 152397 Outside Central Cities 1470621 Percent of Entire MSA 9.39% Population in CC Percent Change in Population from 1999
SDs from Regional Peer Group Mean. SDs from Size Peer Group Mean
 Family: Population Demographics Population Entire MSA 1731183 Central Cities (CC) 776733 Outside Central Cities 954450 Percent of Entire MSA 44.87% Population in CC Percent Change in Population from 1999
SDs from Regional Peer Group Mean. SDs from Size Peer Group Mean
 Family: Population Demographics Population Entire MSA 2968806 Central Cities (CC) 669,769 Outside Central Cities 2,299,037 Percent of Entire MSA 22.56% Population in CC Percent Change in Population from
SDs from Regional Peer Group Mean. SDs from Size Peer Group Mean
 Family: Population Demographics Population Entire MSA 2846289 Central Cities (CC) 809063 Outside Central Cities 2037226 Percent of Entire MSA 28.43% Population in CC Percent Change in Population from 1999
SDs from Regional Peer Group Mean. SDs from Size Peer Group Mean
 Family: Population Demographics Population Entire MSA 4441551 Central Cities (CC) 1147720 Outside Central Cities 3293831 Percent of Entire MSA 25.84% Population in CC Percent Change in Population from
SDs from Regional Peer Group Mean. SDs from Size Peer Group Mean
 Family: Population Demographics Population Entire MSA 1500741 Central Cities (CC) 661799 Outside Central Cities 838942 Percent of Entire MSA 44.1% Population in CC Percent Change in Population from 1999
SDs from Regional Peer Group Mean. SDs from Size Peer Group Mean
 Family: Population Demographics Population Entire MSA 2552994 Central Cities (CC) 686992 Outside Central Cities 1866002 Percent of Entire MSA 26.91% Population in CC Percent Change in Population from 1999
SDs from Regional Peer Group Mean. SDs from Size Peer Group Mean
 Family: Population Demographics Population Entire MSA 2414616 Central Cities (CC) 764431 Outside Central Cities 1650185 Percent of Entire MSA 31.66% Population in CC Percent Change in Population from 1999
PROPOSED SHOPPING CENTER
 PROPOSED SHOPPING CENTER Southeast Corner I-95 & Highway 192 Melbourne, Florida In a 5 Mile Radius 80,862 Population 32,408 Households $61K Avg HH Income SOONER INVESTMENT Commercial & Investment Real
Urban Action Agenda Community Profiles COVER TO GO HERE. City of Beacon
 Urban Action Agenda Community Profiles COVER TO GO HERE City of Beacon COMMUNITY OVERVIEW MAP POPULATION & DEMOGRAPHICS Population Basics 27,828 Population (2015) Population Change 9.6% since 2000 5.1
Economic Overview York County, South Carolina. February 14, 2018
 Economic Overview York County, February 14, 2018 DEMOGRAPHIC PROFILE... 3 EMPLOYMENT TRENDS... 5 UNEMPLOYMENT RATE... 5 WAGE TRENDS... 6 COST OF LIVING INDEX... 6 INDUSTRY SNAPSHOT... 7 OCCUPATION SNAPSHOT...
Economic Overview. Lawrence, KS MSA
 Economic Overview Lawrence, KS MSA March 5, 2019 DEMOGRAPHIC PROFILE... 3 EMPLOYMENT TRENDS... 5 UNEMPLOYMENT RATE... 5 WAGE TRENDS... 6 COST OF LIVING INDEX... 7 INDUSTRY SNAPSHOT... 8 OCCUPATION SNAPSHOT...
Town Profiles: Demographic, Economic, and Housing Statistics for De Smet City and Wall Town, SOuth Dakota
 South Dakota State University Open PRAIRIE: Open Public Research Access Institutional Repository and Information Exchange Census Data Center News Releases SDSU Census Data Center 12-7-2017 Town Profiles:
Economic Overview City of Tyler, TX. January 8, 2018
 Economic Overview City of Tyler, TX January 8, 2018 DEMOGRAPHIC PROFILE...3 EMPLOYMENT TRENDS...5 WAGE TRENDS...5 COST OF LIVING INDEX...6 INDUSTRY SNAPSHOT...7 OCCUPATION SNAPSHOT...9 INDUSTRY CLUSTERS...
Urban Action Agenda Community Profiles COVER TO GO HERE. City of Beacon
 Urban Action Agenda Community Profiles COVER TO GO HERE City of Beacon COMMUNITY OVERVIEW MAP POPULATION & DEMOGRAPHICS Population Basics 2,212 Population (2015) Population Change 2. since 2000 0.5 Square
Monte Vista Population, ,744 4,651 4,564 4,467 4,458 4,432 4,451
 1 Monte Vista 4,8 4,7 4,6 4,5 4,4 4,3 4,2 4,1 4,61 4,612 4,61 4,676 Monte Vista, 2-213 4,744 4,651 4,564 4,467 4,458 4,432 4,451 4,418 4,412 4,355 2 21 22 23 24 25 26 27 28 29 21 211 212 213 Year Monte
Economic Overview Loudoun County, Virginia. October 23, 2017
 Economic Overview October 23, 2017 DEMOGRAPHIC PROFILE... 3 EMPLOYMENT TRENDS... 5 UNEMPLOYMENT RATE... 5 WAGE TRENDS... 6 COST OF LIVING INDEX... 6 INDUSTRY SNAPSHOT... 7 OCCUPATION SNAPSHOT... 9 INDUSTRY
The Trails. 1,500 sf Space Available. In a 3 Mile Radius 69,985 Population 25,450 Households $78,216 Avg HH Inc. 1,500 sf Corner Space
 1,500 sf Space Available The Trails Edmond Rd (2nd St) & Santa Fe Ave ~ Edmond, Oklahoma Current Tenancy: Edmond YMCA Spinal Wellness Clinic Lemongrass Thai Cuisine Kumon Learning Center Katie s Family
LAND FOR SALE Blair Road, Mint Hill, NC PROPERTY OVERVIEW. Large parcel with I-485 access via Blair Road exit in the path of. growth.
 LAND FOR SALE 10395 Blair Road, Mint Hill, NC 28227 OFFERING SUMMARY SALE PRICE: $1,000,000 PROPERTY OVERVIEW Large parcel with I485 access via Blair Road exit in the path of growth. LOT SIZE: 9.28 Acres
Independence, MO Data Profile 2015
 , MO Data Profile 2015 5 year American Community Survey (ACS) Jackson County, Missouri Data sources: U.S. Census Bureau, American Community Survey (ACS), 2011 2015 (released December 8, 2016), compared
Economic Overview Monterey County, California. July 22, 2016
 Economic Overview Monterey July 22, 2016 DEMOGRAPHIC PROFILE... 3 EMPLOYMENT TRENDS... 5 UNEMPLOYMENT RATE... 5 WAGE TRENDS... 6 COST OF LIVING INDEX... 6 INDUSTRY SNAPSHOT... 7 OCCUPATION SNAPSHOT...
For Lease. Free-standing Retail / Office Building 1304 Saratoga Avenue San Jose, CA
 For Lease Free-standing Retail / Office Building 1304 Saratoga Avenue San Jose, CA 95117 Description Approximately 4,500 sf plus mezzanine Outstanding identity and visibility In neighborhood shopping center
Economic Overview Long Island
 Report created on August 29, 2017 Economic Overview Long Island Contact: Lisa.Montiel@suny.edu DEMOGRAPHIC PROFILE... 3 EMPLOYMENT TRENDS... 5 UNEMPLOYMENT RATE... 5 WAGE TRENDS... 6 COST OF LIVING INDEX...
 http://www.tennessee.gov/tacir/_profile/hardin_profile.htm Page 1 of 13 I. Geography & Demographics VI. Government Finance II. Income & Poverty VII. Public Infrastructure Needs Inventory III. Health &
DEMOGRAPHIC PROFILE...3 EMPLOYMENT TRENDS...5 UNEMPLOYMENT RATE...5 WAGE TRENDS...6 COST OF LIVING INDEX...6 INDUSTRY SNAPSHOT...7
 March 14, 2017 DEMOGRAPHIC PROFILE...3 EMPLOYMENT TRENDS...5 UNEMPLOYMENT RATE...5 WAGE TRENDS...6 COST OF LIVING INDEX...6 INDUSTRY SNAPSHOT...7 OCCUPATION SNAPSHOT...9 INDUSTRY CLUSTERS... 12 EDUCATION
TEMPE CROSSING II - RETAIL PAD
 Excellent infill pad opportunity in dynamic retail corridor, 1 mi. East of I-10 Fully finished pad. Over $250,000 worth of site work already completed. Buildable up to 8,500 square feet. Excellent parking!
Economic Overview Western New York
 Report created on August 29, 2017 Economic Overview Western New Contact: Lisa.Montiel@suny.edu DEMOGRAPHIC PROFILE... 3 EMPLOYMENT TRENDS... 5 UNEMPLOYMENT RATE... 5 WAGE TRENDS... 6 COST OF LIVING INDEX...
October 28, Economic Overview Yellowstone County, Montana
 October 28, 2016 Economic Overview Yellowstone DEMOGRAPHIC PROFILE...3 EMPLOYMENT TRENDS...5 UNEMPLOYMENT RATE...5 WAGE TRENDS...6 COST OF LIVING INDEX...6 INDUSTRY SNAPSHOT...7 OCCUPATION SNAPSHOT...9
Economic Overview Fairfax / Falls Church. October 23, 2017
 Economic Overview Fairfax / Falls Church October 23, 2017 DEMOGRAPHIC PROFILE... 3 EMPLOYMENT TRENDS... 5 UNEMPLOYMENT RATE... 5 WAGE TRENDS... 6 COST OF LIVING INDEX... 6 INDUSTRY SNAPSHOT... 7 OCCUPATION
Commission District 4 Census Data Aggregation
 Commission District 4 Census Data Aggregation 2011-2015 American Community Survey Data, U.S. Census Bureau Table 1 (page 2) Table 2 (page 2) Table 3 (page 3) Table 4 (page 4) Table 5 (page 4) Table 6 (page
Northwest Census Data Aggregation
 Northwest Census Data Aggregation 2011-2015 American Community Survey Data, U.S. Census Bureau Table 1 (page 2) Table 2 (page 2) Table 3 (page 3) Table 4 (page 4) Table 5 (page 4) Table 6 (page 5) Table
Economic Overview Capital District
 August 29, 2017 Economic Overview Capital District Contact: Lisa.Montiel@suny.edu DEMOGRAPHIC PROFILE... 3 EMPLOYMENT TRENDS... 5 UNEMPLOYMENT RATE... 5 WAGE TRENDS... 6 COST OF LIVING INDEX... 6 INDUSTRY
Riverview Census Data Aggregation
 Riverview Census Data Aggregation 2011-2015 American Community Survey Data, U.S. Census Bureau Table 1 (page 2) Table 2 (page 2) Table 3 (page 3) Table 4 (page 4) Table 5 (page 4) Table 6 (page 5) Table
Zipe Code Census Data Aggregation
 Zipe Code 66101 Census Data Aggregation 2011-2015 American Community Survey Data, U.S. Census Bureau Table 1 (page 2) Table 2 (page 2) Table 3 (page 3) Table 4 (page 4) Table 5 (page 4) Table 6 (page 5)
Zipe Code Census Data Aggregation
 Zipe Code 66103 Census Data Aggregation 2011-2015 American Community Survey Data, U.S. Census Bureau Table 1 (page 2) Table 2 (page 2) Table 3 (page 3) Table 4 (page 4) Table 5 (page 4) Table 6 (page 5)
Economic Overview Mohawk Valley
 Report created on August 29, 2017 Economic Overview Mohawk Valley Contact: Lisa.Montiel@suny.edu DEMOGRAPHIC PROFILE... 3 EMPLOYMENT TRENDS... 5 UNEMPLOYMENT RATE... 5 WAGE TRENDS... 6 COST OF LIVING INDEX...
Economic Overview 45-Minute Commute From Airport Park. June 6, 2017
 Economic Overview 45-Minute Commute From Airport Park June 6, 2017 DEMOGRAPHIC PROFILE... 3 EMPLOYMENT TRENDS... 5 WAGE TRENDS... 5 COST OF LIVING INDEX... 6 INDUSTRY SNAPSHOT... 7 OCCUPATION SNAPSHOT...
Economic Overview Prince William/Manassas. October 23, 2017
 Economic Overview Prince William/Manassas October 23, 2017 DEMOGRAPHIC PROFILE... 3 EMPLOYMENT TRENDS... 5 UNEMPLOYMENT RATE... 5 WAGE TRENDS... 6 COST OF LIVING INDEX... 6 INDUSTRY SNAPSHOT... 7 OCCUPATION
Economic Overview Plant City Region. April 5, 2017
 Economic Overview Plant City Region April 5, 2017 DEMOGRAPHIC PROFILE... 3 EMPLOYMENT TRENDS... 5 WAGE TRENDS... 5 COST OF LIVING INDEX... 6 INDUSTRY SNAPSHOT... 7 OCCUPATION SNAPSHOT... 9 INDUSTRY CLUSTERS...
Economic Profile. Capital Crossroads. a vision forward
 Economic Profile Capital a vision forward This profile was prepared by: Liesl Eathington Department of Economics State University phone: (515) 294 2954 email: leathing@iastate.edu 5/23/2012 Distribution
Economic Overview New York
 Report created on October 20, 2015 Economic Overview Created using: Contact: Lisa.Montiel@suny.edu DEMOGRAPHIC PROFILE...3 EMPLOYMENT TRENDS...5 UNEMPLOYMENT RATE...5 WAGE TRENDS...6 COST OF LIVING INDEX...6
Economic Overview Long Island
 Report created on October 20, 2015 Economic Overview Long Island Created using: Contact: Lisa.Montiel@suny.edu DEMOGRAPHIC PROFILE...3 EMPLOYMENT TRENDS...5 UNEMPLOYMENT RATE...5 WAGE TRENDS...6 COST OF
Everett. Change in 38,037 41,689 3,652
 Everett The percentage of Everett residents who speak English less than very well nearly doubled over the last decade, to 29.1%, while the percentage of foreign-born rose to 39.9%. More than half (51.7%)
APPENDICES Fair Housing and Equity Assessment
 APPENDICES 77 APPENDIX A: DATA TABLES Data is provided for Racially Concentrated Areas of Poverty (RCAPs) and Opportunity Areas (OAs). The RCAPs, as defined in Chapter 3, include: RCAP 1: West Kansas City,
Shingle Creek. Minneapolis neighborhood profile. About this area. Trends in the area. Neighborhood in Minneapolis. October 2011
 neighborhood profile October 2011 About this area The neighborhood is bordered by 53rd Avenue North, Humboldt Avenue North, 49th Avenue North, and Xerxes Avenue North. It is home to Olson Middle School.
GERMANTOWN-PARISTOWN NEIGHBORHOOD PROFILE
 GERMANTOWN-PARISTOWN NEIGHBORHOOD PROFILE July 2017 Prepared in Partnership Between the Kentucky State Data Center at the University of Louisville and Metro United Way Louisville s traditional urban neighborhoods
University of Minnesota
 neighborhood profile October 2011 About this area The University neighborhood is bordered by 11th Avenue Southeast, University Avenue, 15th Avenue Southeast, the railroad tracks, Oak Street, and the Mississippi
June 9, Economic Overview Billings, MT MSA
 June 9, 2016 Economic Overview Billings, MT MSA DEMOGRAPHIC PROFILE... 3 EMPLOYMENT TRENDS... 5 UNEMPLOYMENT RATE... 5 WAGE TRENDS... 6 COST OF LIVING INDEX... 6 INDUSTRY SNAPSHOT... 7 OCCUPATION SNAPSHOT...
SHELBY PARK NEIGHBORHOOD PROFILE
 SHELBY PARK NEIGHBORHOOD PROFILE July 2017 Prepared in Partnership Between the Kentucky State Data Center at the University of Louisville and Metro United Way Louisville s traditional urban neighborhoods
4575 Bay Rd, Saginaw, MI 48603
 Georges 4575 Bay Rd, Saginaw, MI 48603 Listing ID: 30340682 Status: Active Property Type: Business Opportunity For Sale Industry: Professional Services Size: 6,600 SF Sale Price: $852,000 Sale Terms: Cash
PORTLAND NEIGHBORHOOD PROFILE
 PORTLAND NEIGHBORHOOD PROFILE July 2017 Prepared in Partnership Between the Kentucky State Data Center at the University of Louisville and Metro United Way Louisville s traditional urban neighborhoods
Enrollment Type. Proportion of Non AAS Students by Enrollment Type. UW Colleges Campus Profile: UW Fox Valley
 Ten Year Enrollment Trends by Enrollment Type Fall AAS High School Special Audit Other Total Enrollment 2008 1473 62 88 5 13 1641 2009 1520 111 106 1 10 1748 2010 1583 118 97 9 24 1831 2011 1615 105 79
Roseville Towne Center Gratiot Avenue Roseville, MI 48066
 Retail Space Available 65,000 SF Second Level Space and Outparcel Florence Street Massachusetts Street Gratiot Avenue E. 12 Mile Road Property Highlights is shadow-anchored by Walmart and includes national
Enrollment Type. UW Colleges Campus Profile: UW Marathon County. Proportion of Non AAS Students by Enrollment Type
 Ten Year Enrollment Trends by Enrollment Type Fall AAS High School Special Audit Other Total Enrollment 2008 1250 12 62 11 28 1363 2009 1292 22 57 13 15 1399 2010 1315 25 41 14 14 1409 2011 1266 15 41
Enrollment Type. UW Colleges Campus Profile: UW Manitowoc. Proportion of Non AAS Students by Enrollment Type
 Ten Year Enrollment Trends by Enrollment Type Fall AAS High School Special Audit Other Total Enrollment 2008 507 10 16 1 6 540 2009 489 14 31 5 9 548 2010 573 11 20 4 4 612 2011 624 10 20 4 6 664 2012
2016 Labor Market Profile
 2016 Labor Market Profile Prepared by The Tyler Economic Development Council Tyler Area Sponsor June 2016 The ability to demonstrate a regions availability of talented workers has become a vital tool
Economic Overview Marlboro County Labor Shed. June 29, 2016
 Economic Overview Marlboro County Labor June 29, 2016 DEMOGRAPHIC PROFILE...3 EMPLOYMENT TRENDS...5 UNEMPLOYMENT RATE...5 WAGE TRENDS...6 COST OF LIVING INDEX...6 INDUSTRY SNAPSHOT...7 OCCUPATION SNAPSHOT...9
LAKE FOREST NEIGHBORHOOD PROFILE
 LAKE FOREST NEIGHBORHOOD PROFILE July 2017 Prepared in Partnership Between the Kentucky State Data Center at the University of Louisville and Metro United Way This data profile uses 2010 census tract boundaries
Commercial Land for Sale. Messina Highlands Acres / W. Market St. & Richland Ave West Market Street; York, PA SITE
 3 2018 Messina Highlands 2.21 Acres / W. Market St. & Richland Ave. ; SITE York Fuel Stop / Tobacco Outlet T & D Car Wash 2.21 Acres Commercial Land Available for Sale 12,000 CPD on West Market Street
CHEROKEE-SENECA NEIGHBORHOOD PROFILE
 CHEROKEE-SENECA NEIGHBORHOOD PROFILE July 2017 Prepared in Partnership Between the Kentucky State Data Center at the University of Louisville and Metro United Way Louisville s traditional urban neighborhoods
TABLE 1. PROFILE OF GENERAL DEMOGRAPHIC CHARACTERISTICS
 Waterloo city, Iowa TABLE 1. PROFILE OF GENERAL DEMOGRAPHIC CHARACTERISTICS Estimate Lower Bound Upper Bound Total population 66,659 64,093 69,225 SEX AND AGE Male 32,096 30,415 33,777 Female 34,563 33,025
2018:IIIQ Nevada Unemployment Rate Demographics Report*
 2018:IIIQ Nevada Unemployment Rate Demographics Report* Department of Employment, Training & Rehabilitation Research and Analysis Bureau Dr. Tiffany Tyler-Garner, Director Dennis Perea, Deputy Director
Mid - City Industrial
 Minneapolis neighborhood profile October 2011 Mid - City Industrial About this area The Mid-City Industrial neighborhood is bordered by I- 35W, Highway 280, East Hennepin Avenue, and Winter Street Northeast.
AVAILABLE FOR LEASE Mayfield Road. Mayfield Heights, Ohio
 1,700 SF Retail Space For Lease Property Highlights Below market lease rates Refurbished in 2016 Furniture, fixtures and equipment available for purchase Fully built out restaurant space with hood Excellent
Contact: Larry Hausman (502) Outer Loop, Louisville, KY Knobview Shopping Center
 Outer Loop, Louisville, KY Knobview Shopping Center") 5603-5637 Outer Loop, Louisville, KY 40219 Knobview Shopping Center Jefferson Mall Academy Sports Center SUBJECT Knobview Shopping Center offers a diverse mix of local and national tenants. The center
5603-5637 Outer Loop, Louisville, KY 40219 Knobview Shopping Center Jefferson Mall Academy Sports Center SUBJECT Knobview Shopping Center offers a diverse mix of local and national tenants. The center
Camden Industrial. Minneapolis neighborhood profile. About this area. Trends in the area. Neighborhood in Minneapolis.
 Minneapolis neighborhood profile October 2011 Camden Industrial About this area The Camden Industrial neighborhood is bordered by 48th Avenue North, the Mississippi River, Dowling Avenue North, Washington
Economic Overview Charlotte-Concord-Gastonia, NC-SC MSA. October 27, 2017
 Economic Overview Charlotte-Concord-Gastonia, NC-SC MSA October 27, 2017 DEMOGRAPHIC PROFILE...3 EMPLOYMENT TRENDS...5 UNEMPLOYMENT RATE...5 WAGE TRENDS...6 COST OF LIVING INDEX...6 INDUSTRY SNAPSHOT...7
Institute of Government & Public Affairs University of Illinois. Illinois County Statistical Abstract. Cook
 Illinois County Statistical Abstract Cook Melike Bulu and Hilal Yilmaz, Editors Robert W. Resek, Director The Institute of Government and Public Affairs at the University of Illinois (IGPA) has been working
99TH AVENUE AND GLENDALE AVENUE
 N ATHAN & A SSOCIATES, I NC. 7600 East Doubletree Ranch Road Suite #150 Scottsdale Arizona 85258 Phone: 480.367.0700 Fax: 480.367.8341 www.nathanandassociatesinc.com 99TH AVENUE AND GLENDALE AVENUE S URROUNDING
Economic Indicators for the Laramie Area Annual Trends Edition
 Economic Indicators for the Laramie Area Annual Trends Edition Wyoming Center for Business and Economic Analysis, LLC 1912 Capitol Avenue, Suite 407, Cheyenne, WY 82001 Volume IX, Number 1 March, 2006
TitleMax INVESTMENT OFFERING. Todd Bunke South Western Avenue Blue Island, IL 60406
 INVESTMENT OFFERING TitleMax 12434 South Western Avenue Blue Island, IL 60406 Todd Bunke 404.964.9048 tbunke@atlantaregroup.com Confidentiality Agreement This is a confidential Memorandum intended solely