Thank you For Reading
|
|
|
- Abner Mills
- 5 years ago
- Views:
Transcription
1
2 Thank you For Reading Welcome to the second issue of the TradingFibz, LLC weekly supplemental newsletter. It is my hope that over the next month, the newsletter will take on a new look and add in additional features to make this a useful weekly tool in addition to my weekly video recap and outlook. This will be the last week I will cover index futures as these are covered in great detail in each weeks video recap and outlook. In replacement I will be adding in additional ETF s and FX pairs in the weeks to come.
3 Disclaimer Trading Futures, options on futures and retail off-exchange foreign currency transactions involves substantial risk of loss and is not suitable for all investors. You should carefully consider whether trading is suitable for you in light of your circumstances, knowledge, and financial resources. You may lose all or more of your initial investment. The lower the day trade margin, the higher the leverage and riskier the trade. Leverage can work for you as well as against you; it magnifies gains as well as losses. Past performance is not necessarily indicative of future results. Trading Futures, Options on Futures, and retail off-exchange foreign currency transactions involves substantial risk of loss and is not suitable for all investors. Past Performance is not indicative of future results
4 CFTC HYPOTHETICAL PERFORMANCE RESULTS HAVE MANY INHERENT LIMITATIONS, SOME OF WHICH ARE DESCRIBED BELOW. NO REPRESENTATION IS BEING MADE THAT ANY ACCOUNT WILL OR IS LIKELY TO ACHIEVE PROFITS OR LOSSES SIMILAR TO THOSE SHOWN; IN FACT, THERE ARE FREQUENTLY SHARP DIFFERENCES BETWEEN HYPOTHETICAL PERFORMANCE RESULTS AND THE ACTUAL RESULTS SUBSEQUENTLY ACHIEVED BY ANY PARTICULAR TRADING PROGRAM. ONE OF THE LIMITATIONS OF HYPOTHETICAL PERFORMANCE RESULTS IS THAT THEY ARE GENERALLY PREPARED WITH THE BENEFIT OF HINDSIGHT. IN ADDITION, HYPOTHETICAL TRADING DOES NOT INVOLVE FINANCIAL RISK, AND NO HYPOTHETICAL TRADING RECORD CAN COMPLETELY ACCOUNT FOR THE IMPACT OF FINANCIAL RISK OF ACTUAL TRADING. FOR EXAMPLE, THE ABILITY TO WITHSTAND LOSSES OR TO ADHERE TO A PARTICULAR TRADING PROGRAM IN SPITE OF TRADING LOSSES ARE MATERIAL POINTS WHICH CAN ALSO ADVERSELY AFFECT ACTUAL TRADING RESULTS. THERE ARE NUMEROUS OTHER FACTORS RELATED TO THE MARKETS IN GENERAL OR TO THE IMPLEMENTATION OF ANY SPECIFIC TRADING PROGRAM WHICH CANNOT BE FULLY ACCOUNTED FOR IN THE PREPARATION OF HYPOTHETICAL PERFORMANCE RESULTS AND ALL WHICH CAN ADVERSELY AFFECT TRADING RESULTS. Trading Futures, Options on Futures, and retail off-exchange foreign currency transactions involves substantial risk of loss and is not suitable for all investors. Past Performance is not indicative of future results
5 Markets can remain irrational longer than you can remain solvent. John Maynard Keynes
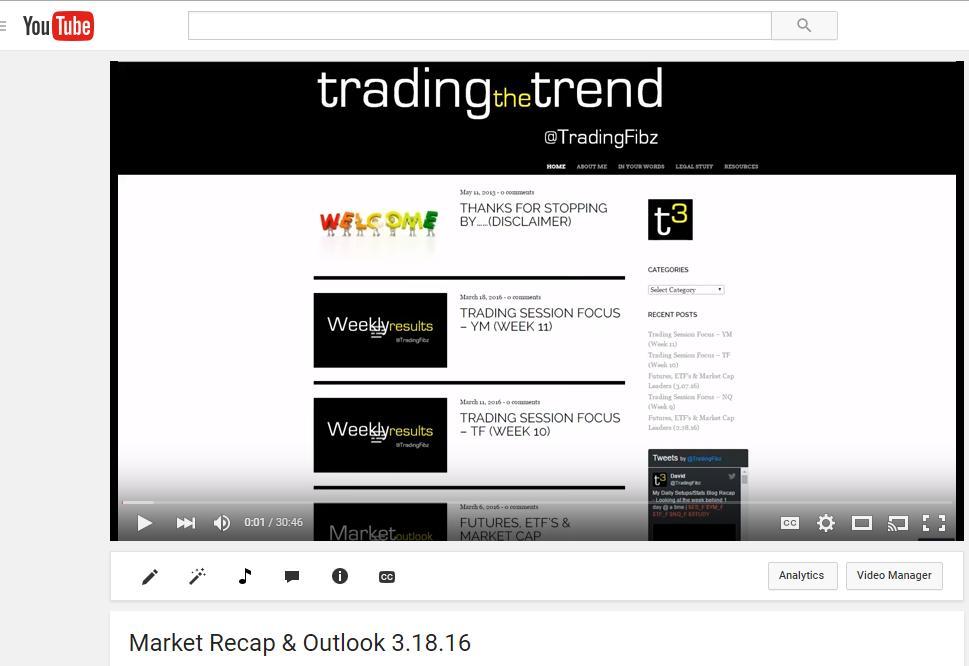
6 Recap/Outlook Video
7 Is there really a Crystal Ball? While there are a plethora of weekend forecasts of where the market may be headed in the next week, in the end, only a margin of those who claim to know where we are going get it right. The other half get it wrong. Truth is I have no clue and this is the core of my belief to simply trade the charts in front of me. My outlook is simply based on a where we are currently in technical momentum and what you should know may lie ahead or behind wether you are an intraday, short or long term trader. So.take my charts/comments for the value that it all may go in either direction and always be prepared regardless of where you think it should be. You ll be a more profitable trader for it.

8 Index Futures

9 ES
10 ES Technical Momentum BULLISH T3 Moving average above the 50/144ema on a 4 hour chart Between 50/200 daily moving average Watch for pullbacks Daily 50/200ma 4 hour 50/144ema

11 ES Daily Gaps closed

12 ES Daily Fib New Draw

13 NQ

14 NQ Technical Momentum BULLISH T3 Moving average pullback above the 50/144ema on a 4 hour daily moving 61,8% fib retrace Watch for pullbacks Daily 50ma 4 hour 50/144ema

15 NQ Daily - Fib

16 TF

17 TF Technical Momentum BULLISH T3 Moving average above the 50/144ema on a 4 hour chart Between 50/200 daily moving 50% fib retrace open gaps prior to 200ma

18 TF Daily - Fib
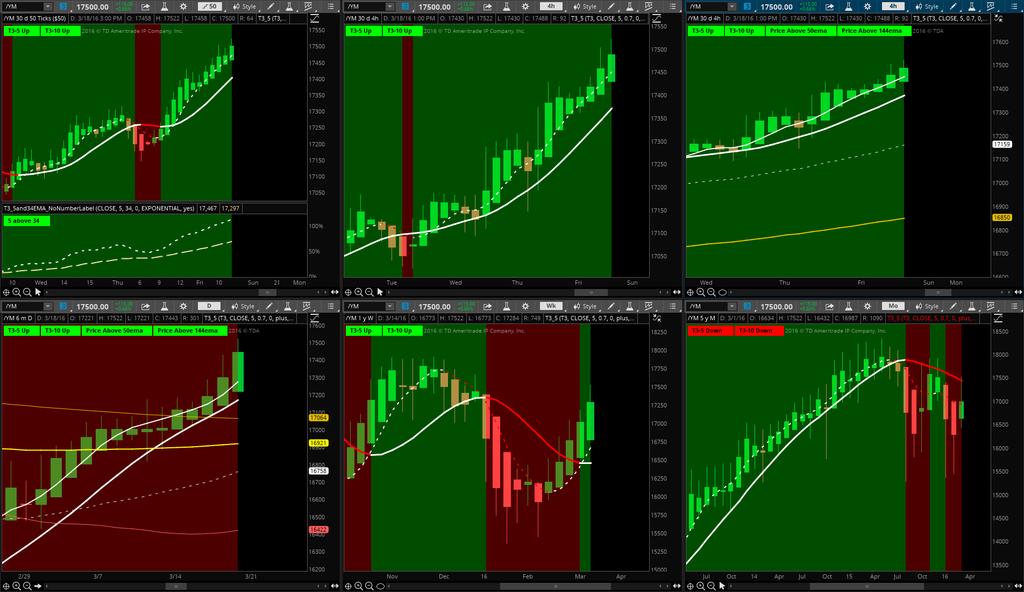
19 YM
20 YM Technical Momentum BULLISH T3 Moving average above the 50/144ema on a 4 hour chart Above 200 daily moving average Watch for 2015 highs Watch for pullbacks Daily 50/200ma 4 hour 50/144ema

21 YM Daily Fib Gap Closed

22 YM Daily New Draw

23 6E

24 6E Technical Momentum BULLISH T3 Moving average above the 50/144ema on a 4 hour chart Above 50/200 daily moving average Fib extension upside on breakout above previous highs Open gap above/below Watch for pullbacks Daily 50/200ma 4 hour 50/144ema

25 6E Daily - Fib

26 6E Daily - Open Gaps

27 Futures

28 CL

29 CL Technical Momentum BULLISH T3 Moving average above the 50/144ema on a 4 hour chart Above 50 and daily moving average Break above 200ma look for 44 an up to 50 to close out open gaps. Open gaps below on the pullback and 50ema on a 4 hour chart.

30 CL Daily - Fib

31 CL Daily Fib NEW Draw

32 GC

33 GC Technical Momentum BULLISH T3 Moving average above the 50/144ema on a 4 hour chart Support on 4hr fib level support Above 50/200 daily moving average Open gaps below

34 GC Daily - Fib

35 GC Daily Open Gaps

36 ETF Futures


37 DIA Technical Momentum BEARISH T3 Moving average Bullish above the 50/144ema Bullish on a 4 hour chart Above 50/200 daily moving average Stronger trend if daily 50 crosses 144ema Watch for pullback to the 50ema on a 4 hour chart.


38 FXE Technical Momentum BULLISH T3 Moving average above the Bullish 50/144ema on a 4 hour 50/200 daily moving average Stronger trend if daily 50 crosses 144ema


39 IWM Technical Momentum BEARISH/NEUTRAL T3 Moving average struggling above the Bearish 50/144ema on a 4 hour chart Between 50/200 daily moving Daily chart Stronger trend if 4hour 50ema crosses 144ema


40 QQQ Technical Momentum BEARISH/NEUTRAL T3 Moving average above the Bearish 50/144ema on a 4 hour Daily 200 daily moving average Stronger trend if 4hour 50ema crosses 144ema and breaks above 200 daily moving average


41 SPY Technical Momentum BULLISH T3 Moving average above the Bullish 50/144ema on a 4 hour chart Above the 200 daily moving average Stronger trend if daily 50ema crosses 144ema

42 ETF s


43 GLD Technical Momentum BULLISH T3 Moving average Bullish above the Bullish 50/144ema on a 4 hour chart Above 50/200 daily moving average Last time: Watch for pullback to 50ema as first line of defense and upside.50ema holds


44 USO Technical Momentum BEARISH/NEUTRAL T3 Moving average Bullish above the Bearish 50/144ema on a 4 hour chart Inside 50/200 daily moving average gap Watch for Daily 144ema upside resistance

45 Market Cap Leaders


46 AAPL Technical Momentum BEARISH/NEUTRAL 4hr: T3 Moving average Bullish above the Bearish 50/144ema Daily: Inside 50/144ema GAP Inside 50/200 GAP Last Week: Watch for 144ema as next resistance on daily chart This Week: Watch for Daily 144ema resistance and 4 hour trend change or pullbacks to moving averages.


47 AMZN Technical Momentum BEARISH 4hr: T3 Moving average Bearish below the Bearish 50/144ema Daily: Bullish consolidated daily moving average Last Week: Watch for the breakthrough This Week: Bearish and watch for break through of daily 200ma.


48 FB Technical Momentum BULLISH 4hr: T3 Moving average Bullish above the Bullish 50/144ema Daily: Above 200 daily moving average Two weeks ago: 50ema first line for the pullback This Week: Watch for 50ema pullback or continued Bullish trend tick chart will show first signs of pullback.


49 GOOG Technical Momentum BULLISH 4hr: T3 Moving average Bullish above the Bullish 50/144ema daily moving average Two Weeks Ago: Price support on 4 hour needs to breakthrough daily 200ma resistance This Week: Watch for daily/4hr 50ema pullback or continued Bullish trend. 1000tick chart will show first signs of pullback.


50 NFLX Technical Momentum BEARISH 4hr: T3 Moving average Bullish inside the Bearish 50/144ema GAP daily moving average Last Time: Brakes on need to push through resistance This Week: Decision time. Shorter time frame trend upside. May lead 4hr higher and break above daily 200ma. Otherwise pullback to 50ema on 4hr. chart.


51 SBUX Technical Momentum BEARISH/NEUTRAL 4hr: T3 Moving average Bullish above the Bearish 50/144ema GAP Daily: Above 200 daily moving average Last Time: Watch for support here and below at the 50ema on a 4hour chart and 144 on a daily This Week: Follow though on break upside on 4hr chart. Pullback to 50/144ema if no follow through.
52 Looking Ahead Will be adding in the weeks to come FX Pairs Industry ETF Additional ETF s
Thank you For Reading
 Thank you For Reading Welcome to the FIFTH issue of the TradingFibz, LLC weekly supplemental newsletter. It is my hope that the newsletter will take on a new look and add in additional features to make
Thank you For Reading
 Thank you For Reading Welcome to the 7th issue of the TradingFibz, LLC weekly supplemental newsletter. Templates now available for purchase and added video each week. At some point in the near future,
Using Volume Based Bars in Your Trading Exclusive Presentation for Infinity Futures
 Using Volume Based Bars in Your Trading Exclusive Presentation for Infinity Futures Trading Futures, Options on Futures, and retail off-exchange foreign currency transactions involves substantial risk
Weekly outlook for Nov. 27 Dec
 Weekly outlook for Nov. 27 Dec. 1 2017 Summary For the ES we expect a minor pullback in the early part of the week, followed by a rally into the weekly close. There are four option expirations this week
11-Hour Options 2.0 The Next Evolution of Success
 presented by Thomas Wood MicroQuant SM Identifying Key Support and Resistance Levels 11-Hour Options 2.0 The Next Evolution of Success Risk Disclaimer Trading or investing carries a high level of risk,
Trading Success Principles Floor Trader Pivots
 Trading Success Principles Floor Trader Pivots Trading Concepts, Inc. Trading Success Principles Floor Trader Pivots By Todd Mitchell Copyright 2014 by Trading Concepts, Inc. All Rights Reserved This training
5G Networks. Chart Patterns & Algo. Trader. Trading Rectangle Channel Patterns. Daily/Weekly/Monthly Analysis. Auto Generated Chart Patterns/Analysis
 surinotes.com s Feb. 05, 2018 Chart Patterns & Algo. Trader A Weekly Publication Trading Rectangle Channel Patterns Daily/Weekly/Monthly Analysis Auto Generated Chart Patterns/Analysis Algorithmic Trading
Market Line Weekly Newsletter
 Market Line Weekly Newsletter December 17, 2017 Stock Watch: The trend is up and the bulls have the momentum. A close below the 12/1 low in any of the major indices (the Dow, the S&P, the QQQ, IWM, and
Weekly outlook for April 23, 2018
 Weekly outlook for April 23, 2018 Summary The S&P 500 index is expected to go down further if price stays below the 2700 level. A weekly doji candle formed on the intermediate-term chart, and the short-term
Agenda. Who is Recognia. Event Driven Technical Analysis. Types of Technical Events. Finding and Validating Ideas using Recognia Q & A
 Disclaimer The information presented here is for educational and informational purposes only. The inclusion of any specific securities detailed is for illustrative purposes only. No information contained
Fintech $tocks. Chart Patterns & Algo. Trader. Trading Symmetric Triangle Patterns
 surinotes.com s Feb. 19, 2018 Chart Patterns & Algo. Trader Trading Symmetric Triangle Patterns A Weekly Publication Stocks/Futures/FX/Commodities Daily/Weekly/Monthly Analysis Auto Generated Chart Patterns/Analysis
Chart Patterns & Algo. Trader
 surinotes.com s 1 Sep. 25, 2017 Chart Patterns & Algo. Trader A Weekly Magazine Stocks/Options/Futures Commodities/FX Daily/Weekly/Monthly Analysis Watchlists Auto Generated Chart Patterns/Analysis Algorithmic
Major Trends Update Jan. 10, 2019
 Prepared By Robert Miner, Dynamic Traders Group, Inc. Major Trends Update Jan. 10, 2019 This Major Trends Report of most of the markets we follow on a regular basis in the DT Reports is a summary of the
Weekly outlook for May 7 May 11, 2018
 Weekly outlook for May 7 May 11, 2018 Summary The S&P500 index is expected to declare its breakout direction soon. The triangle pattern is defined by 2725 on the upside and 2575 on the down side. A weekly
Weekly outlook for April 30 May
 Weekly outlook for April 30 May 4 2018 Summary The S&P500 index is having trouble deciding if it will rally or decline. This indecision makes trading less profitable. Wait for a break-out direction to
Weekly outlook for May 28/9 - June 1, 2018
 Weekly outlook for May 28/9 - June 1, 2018 Summary The S&P500 index is expected to be dull due to the short week, barring major news. A minor pullback maybe seen, but it should be a very short-lived. It
Active Trend Trading Rules Review
 Active Trend Trading Rules Review Active Trend Trader: Dennis W. Wilborn A Trend Should Be Assumed to Continue in Effect Until Such Time as Its Reversal Has Been Definitely Signaled Edwards & Magee Disclaimer
MTF Volatility Squeeze Version 4.0
 MTF Volatility Squeeze Version 4.0 Description: The Multiple Time Frame Volatility Squeeze (MTFVS) indicator shows when there is a reduction in volatility that usually means that consolidation is occurring.
Trade Strategies for: Jan. 28-Feb. 1, 2019
 Prepared By Robert Miner, Dynamic Traders Group, Inc. Trade Strategies for: Jan. 28-Feb. 1, 2019 This written report is a summary of the technical position of each market with key time and price targets
Weekly outlook for May 21 - May 25, 2018
 Weekly outlook for May 21 - May 25, 2018 Summary The S&P500 index is expected to hold up for a higher level. The market broke to the upside from a symmetrical triangle pattern and is consolidating above
How You Can Find Better Trade Entries With Two Award-Winning Trading Setups That Are Working Right Now Presented by:
 How You Can Find Better Trade Entries With Two Award-Winning Trading Setups That Are Working Right Now Presented by: Rob Hoffman BecomeABetterTrader.com Copyright 2017 Become A Better Trader, Inc. All
presented by Thomas Wood MicroQuant SM Divergence Trading Workshop Day One Bond Trading Success
 presented by Thomas Wood MicroQuant SM Divergence Trading Workshop Day One Bond Trading Success Risk Disclaimer Trading or investing carries a high level of risk, and is not suitable for all persons. Before
SALE. Travel & Airlines. Chart Patterns & Algo. Trader. Trading Cup & Handle Patterns BOOK + POSTER. surinotes.com s. Jan.
 surinotes.com s Jan. 08, 2018 Chart Patterns & Algo. Trader A Weekly Publication BOOK + POSTER SALE Trading Cup & Handle Patterns Travel & Airlines Chart Patterns & Algorithmic Trader 2018 ALL RIGHTS RESERVED
Weekly outlook for Mar
 Weekly outlook for Mar. 26 30 2018 Summary The S&P500 index is expected to test February's low first and bounce from it before the Good Friday holiday. The end of the month and the end of the quarter may
Chart Patterns & Algo. Trader
 surinotes.com s Dec. 04, 2017 Chart Patterns & Algo. Trader A Weekly Publication Trading Parabolic Arc Patterns Daily/Weekly/Monthly Analysis Auto Generated Chart Patterns/Analysis Algorithmic Trading
Weekly outlook for May 1 May
 Weekly outlook for May 1 May. 5 2017 TREND DIRECTION S&P 500 Oil Gold Short Term Intermediate-Term Long Term strong weak strong strong neutral Strong weak weak weak Summary The S&P500 index is expected
Intraday Charts Hidden Clues!
 Intraday Charts Hidden Clues! Where to Buy & Sell Mid-Week Market Sanity Check Disclaimer U.S. Government Required Disclaimer Commodity Futures Trading Commission Futures and Options trading has large
The Dow Theory by
 The Dow Theory by www.surefire-trading.com Ty Young Anyone who s ever purchased a DVD knows the difference between a wide screen production and a full screen production. To elaborate; when a movie is viewed
MTF Volatility Squeeze Version 6.0
 MTF Volatility Squeeze Version 6.0 Description: The Multiple Time Frame Volatility Squeeze (MTFVS) indicator shows when there is a reduction in volatility that usually means that consolidation is occurring.
RISK DISCLOSURE STATEMENT / DISCLAIMER AGREEMENT
 RISK DISCLOSURE STATEMENT / DISCLAIMER AGREEMENT Trading any financial market involves risk. This report and all and any of its contents are neither a solicitation nor an offer to Buy/Sell any financial
The Strategies Working Best in Today s E-Mini Market
 The Strategies Working Best in Today s E-Mini Market Todd Mitchell Craig Hill Legal Disclaimer No claim is made by Trading Concepts, Inc. that the trading strategies shown here will result in profits and
Chart Patterns & Algo. Trader. Watchlists Auto Generated Chart Patterns/Analysis
 surinotes.com s Dec. 18, 2017 Chart Patterns & Algo. Trader A Weekly Publication HAPPY HOLIDAYS SALE Trading Dragon Chart Patterns Stocks/Options/Futures Commodities/FX Daily/Weekly/Monthly Analysis Watchlists
Weekly outlook for June 5 June
 Weekly outlook for June 5 June 9 2017 TREND DIRECTION S&P 500 Oil Gold Short Term Intermediate-Term Long Term Weak buy buy neutral neutral sell buy buy buy Summary The S&P500 index is expected to hold
Prepared by Jaime Johnson and Robert Miner Tuesday, Sept. 1, 2015
 Prepared by Jaime Johnson and Robert Miner Tuesday, Sept. 1, 2015 Today s Video Update provides more detail of the current position and probable future trends and trade strategies. Weekly / Daily Charts
Trading Lessons from the Intraday Frame (study)
") 1 Daily "Idealized Trades" Report Trading Lessons from the Intraday Frame (study) 1 2018 TheoTrade LLC. All rights reserved. 2 Trading Lessons from the Intraday Frame (1-mi) 2 2018 TheoTrade LLC. All rights
1 Daily "Idealized Trades" Report Trading Lessons from the Intraday Frame (study) 1 2018 TheoTrade LLC. All rights reserved. 2 Trading Lessons from the Intraday Frame (1-mi) 2 2018 TheoTrade LLC. All rights
Buy Now, Paid Later. Learning LEAP Leverage Strategies. By Markay Latimer
 Buy Now, Paid Later Learning LEAP Leverage Strategies By Markay Latimer Neither Better Trades or any of its personnel are registered broker-dealers or investment advisers. I will mention that I consider
The Launchpad Strategy
 presented by Thomas Wood MicroQuant SM Divergence Trading Workshop Day One The Launchpad Strategy Risk Disclaimer Trading or investing carries a high level of risk, and is not suitable for all persons.
Part 1. ForEx Easy Mode
 Part 1 DISCLAIMER Any income claims are typical of top performers not all users and your results will vary. Past performance of any system is not indicative of future results. Trading foreign exchange
Trading Lessons from the Intraday Frame (study)
") 1 Daily "Idealized Trades" Report Trading Lessons from the Intraday Frame (study) 1 2018 TheoTrade LLC. All rights reserved. 2 Trading Lessons from the Intraday Frame (1-mi) 2 2018 TheoTrade LLC. All rights
1 Daily "Idealized Trades" Report Trading Lessons from the Intraday Frame (study) 1 2018 TheoTrade LLC. All rights reserved. 2 Trading Lessons from the Intraday Frame (1-mi) 2 2018 TheoTrade LLC. All rights
Forex Renko Charts FX Trading System
 Forex Renko Charts FX Trading System Disclaimer FOREX trading, online foreign exchange trading, foreign currency trading and Forex options trading involves risk of loss and is not appropriate for all investors.
Chart Patterns & Algo. Trader
 surinotes.com s Jan. 15, 2018 Chart Patterns & Algo. Trader S : Bo &Pos A Weekly Publication Trading Megaphone Patterns Chart Patterns & Algorithmic Trader 2018 ALL RIGHTS RESERVED No part of this document
Different Classes Of Divergence
 Russ Horn Presents Different Classes Of Divergence RISK DISCLOSURE STATEMENT / DISCLAIMER AGREEMENT Trading any financial market involves risk. This report and all and any of its contents are neither a
Master Trader Joe Ross
 The purpose of the Trader's Trick Entry (TTE) is to get us into a trade prior to entry by most other traders. Trading is a business in which the more knowledgeable have the advantage over the less knowledgeable.
Chart Patterns & Algo. Trader
 surinotes.com s Feb. 26, 2018 Chart Patterns & Algo. Trader Trading ABC Bearish Patterns A Weekly Publication Chart Patterns & Algorithmic Trader 2018 ALL RIGHTS RESERVED No part of this document may be
Naked Trading and Price Action
 presented by Thomas Wood MicroQuant SM Divergence Trading Workshop Day One Naked Trading and Price Action Risk Disclaimer Trading or investing carries a high level of risk, and is not suitable for all
Trading Lessons from the Intraday Frame (study)
") 1 Daily "Idealized Trades" Report Trading Lessons from the Intraday Frame (study) 1 2018 TheoTrade LLC. All rights reserved. 2 Trading Lessons from the Intraday Frame (1-min) 2 2018 TheoTrade LLC. All
1 Daily "Idealized Trades" Report Trading Lessons from the Intraday Frame (study) 1 2018 TheoTrade LLC. All rights reserved. 2 Trading Lessons from the Intraday Frame (1-min) 2 2018 TheoTrade LLC. All
Trading Lessons from the Intraday Frame (study)
") 1 Daily "Idealized Trades" Report Trading Lessons from the Intraday Frame (study) 1 2018 TheoTrade LLC. All rights reserved. 2 Trading Lessons from the Intraday Frame (1-mi) 2 2018 TheoTrade LLC. All rights
1 Daily "Idealized Trades" Report Trading Lessons from the Intraday Frame (study) 1 2018 TheoTrade LLC. All rights reserved. 2 Trading Lessons from the Intraday Frame (1-mi) 2 2018 TheoTrade LLC. All rights
SALE. Bank Stocks. Chart Patterns & Algo. Trader. Trading Confluence Chart Patterns HAPPY HOLIDAYS
 surinotes.com s Dec. 11, 2017 Chart Patterns & Algo. Trader Trading Confluence Chart Patterns A Weekly Publication HAPPY HOLIDAYS SALE Daily/Weekly/Monthly Analysis Auto Generated Chart Patterns/Analysis
NOFT Order Flow Pro Software Suite
 NOFT Order Flow Pro Software Suite Tick Replay Data * Days to Load Recommended Type and Value 3, 5 and 10 Minutes 10 Range 1000 Ticks Order Flow Sequence Tracker YES 5 10000 Volume Order Flow Trade Location
ACCELERATOR- ES HYPOTHETICAL PERFORMANCE CAPSULE - Trading One Lot. Jul- 09. Jul- 10. Jan- 10. Jan- 11
 System Name: Accelerator- ES Auto Trade Developer: Addwins LLC dba Trading Systems Live System Type: Intraday Futures Trades: Emini S&P Subscription Cost: $650 USD Year Dates Covered: Jan 2007- Mar 31
The Strategies Working Best in Today s E-Mini Market
 The Strategies Working Best in Today s E-Mini Market Todd Mitchell Craig Hill Legal Disclaimer No claim is made by Trading Concepts, Inc. that the trading strategies shown here will result in profits and
Trading Lessons from the Intraday Frame (study)
") 1 Daily "Idealized Trades" Report Trading Lessons from the Intraday Frame (study) 1 2018 TheoTrade LLC. All rights reserved. 2 Trading Lessons from the Intraday Frame (1-mi) 2 2018 TheoTrade LLC. All rights
1 Daily "Idealized Trades" Report Trading Lessons from the Intraday Frame (study) 1 2018 TheoTrade LLC. All rights reserved. 2 Trading Lessons from the Intraday Frame (1-mi) 2 2018 TheoTrade LLC. All rights
Forex Price Direction Analysis.
 Forex Price Direction Analysis. September 24 2010 1 Sign Up Now to Upshots forex trade signals disclaimer The information provided in this report is for educational purposes only. It is not a recommendation
Trading Lessons from the Intraday Frame (study)
") 1 Daily "Idealized Trades" Report Trading Lessons from the Intraday Frame (study) 1 2018 TheoTrade LLC. All rights reserved. 2 Trading Lessons from the Intraday Frame (1-mi) 2 2018 TheoTrade LLC. All rights
1 Daily "Idealized Trades" Report Trading Lessons from the Intraday Frame (study) 1 2018 TheoTrade LLC. All rights reserved. 2 Trading Lessons from the Intraday Frame (1-mi) 2 2018 TheoTrade LLC. All rights
Technical Analysis Basics. Identifying Tops
 Technical Analysis Basics. Identifying Tops June 2011 1 Sign Up Now to Upshots forex trade signals disclaimer The information provided in this report is for educational purposes only. It is not a recommendation
Trading Lessons from the Intraday Frame (study)
") 1 Daily "Idealized Trades" Report Trading Lessons from the Intraday Frame (study) 1 2018 TheoTrade LLC. All rights reserved. 2 Trading Lessons from the Intraday Frame (1-mi) 2 2018 TheoTrade LLC. All rights
1 Daily "Idealized Trades" Report Trading Lessons from the Intraday Frame (study) 1 2018 TheoTrade LLC. All rights reserved. 2 Trading Lessons from the Intraday Frame (1-mi) 2 2018 TheoTrade LLC. All rights
- My 4 Favorite Trades - Essential Trades of a Professional Trader
 presented by Thomas Wood MicroQuant SM Divergence Trading Workshop Day One - My 4 Favorite Trades - Essential Trades of a Professional Trader Risk Disclaimer Trading or investing carries a high level of
14 th November General Outlook. Ian Copsey
 2006 General Outlook The Dollar is higher across the board and looks generally positive for one more rally to marginal new highs at least. The 1.2745 EURUSD, 1.2523 USDCHF and 1.8925-45 GBPUSD areas all
Weekly outlook for Jan 16 Jan
 Weekly outlook for Jan 16 Jan 20 2017 TREND DIRECTION S&P 500 Oil Gold Short Term Intermediate-Term Long Term weak strong strong weak Strong Less strong strong weak strong Conclusion: S&P500 indicator
Trading Lessons from the Intraday Frame (study)
") 1 Daily "Idealized Trades" Report Trading Lessons from the Intraday Frame (study) 1 2018 TheoTrade LLC. All rights reserved. 2 Trading Lessons from the Intraday Frame (1-mi) Major Companies Reporting Earnings
1 Daily "Idealized Trades" Report Trading Lessons from the Intraday Frame (study) 1 2018 TheoTrade LLC. All rights reserved. 2 Trading Lessons from the Intraday Frame (1-mi) Major Companies Reporting Earnings
An Overview of the Super Stochastics MTF Indicator Page 2. The Advantages and Features of MTF Indicators Page 3
 An Overview of the Super Stochastics MTF Indicator Page 2 The Advantages and Features of MTF Indicators Page 3 The Various Methods of MTF Analysis: Unlocking New Possibilities Page 5 - Different Time Frames
HEIKIN-ASHI NEWSLETTER
 HEIKIN-ASHI NEWSLETTER A WEEKLY SUMMARY FOR HEIKIN-ASHI AFICIONADOS Issue 96 January 12, 2014 Site: www.educofin.com Blog: http://heikinashi.wordpress.com Heikin-Ashi Book: http://www.educofin.com/heikinashi-book.htm
Trading Lessons from the Intraday Frame (study)
") 1 Daily "Idealized Trades" Report Trading Lessons from the Intraday Frame (study) 1 2018 TheoTrade LLC. All rights reserved. 2 Trading Lessons from the Intraday Frame (1-mi) 2 2018 TheoTrade LLC. All rights
1 Daily "Idealized Trades" Report Trading Lessons from the Intraday Frame (study) 1 2018 TheoTrade LLC. All rights reserved. 2 Trading Lessons from the Intraday Frame (1-mi) 2 2018 TheoTrade LLC. All rights
How to Fix the Top 10 Fatal Errors of Trading One Flaw at a Time. #2 Trading Strategies before Knowing Systems. From the Active Trend Trader
 How to Fix the Top 10 Fatal Errors of Trading One Flaw at a Time #2 Trading Strategies before Knowing Systems From the Active Trend Trader Disclaimer U.S. GOVERNMENT REQUIRED DISCLAIMER COMMODITY FUTURES
Trading Lessons from the Intraday Frame (study)
") 1 Daily "Idealized Trades" Report Trading Lessons from the Intraday Frame (study) 1 2018 TheoTrade LLC. All rights reserved. 2 Trading Lessons from the Intraday Frame (1-min) 2 2018 TheoTrade LLC. All
1 Daily "Idealized Trades" Report Trading Lessons from the Intraday Frame (study) 1 2018 TheoTrade LLC. All rights reserved. 2 Trading Lessons from the Intraday Frame (1-min) 2 2018 TheoTrade LLC. All
TAS MARKET ABOUT CONTACT US. TAS Market Profile is a global leader in trading technology and market analytics. It's still your trade. Just better.
 TAS MARKET MAP U S E R M A N U A L ABOUT TAS Market Profile is a global leader in trading technology and market analytics. It's still your trade. Just better. CONTACT US Website: www.tasmarketprofile.com
Market Observations - as of May 18, 2018
 Market Observations - as of May 18, 2018 By Carl Jorgensen - For Objective Traders - For educational purposes only. Not Financial Advice. After about 4 weeks of a relatively flat horizontal market (in
FOREX PROFITABILITY CODE
 FOREX PROFITABILITY CODE Forex Secret Protocol Published by Old Tree Publishing CC Suite 509, Private Bag X503 Northway, 4065, KZN, ZA www.oldtreepublishing.com Copyright 2013 by Old Tree Publishing CC,
In this report, I will give you a step by step set of instructions for utilizing The Lazy River Scalping Strategy my favorite scalping method.
 What is Scalping? In short, scalping is the idea of taking quick trades (typically on smaller time frames) that only need to go a short distance before you cash out of the position and then to do this
RISK DISCLOSURE STATEMENT / DISCLAIMER AGREEMENT
 RISK DISCLOSURE STATEMENT / DISCLAIMER AGREEMENT Trading any financial market involves risk. This report and all and any of its contents are neither a solicitation nor an offer to Buy/Sell any financial
Weekly outlook for Aug. 27 Aug. 31, 2018
 Weekly outlook for Aug. 27 Aug. 31, 2018 Summary The S&P500 index is expected to have a monthly adjustment move this week, the volatility expected to be high, and price could have a big swing move. Oil
Market Observations as of Dec 8, 2017
 Market Observations as of Dec 8, 2017 By Carl Jorgensen - For Objective Traders - For educational purposes only. Not Financial Advice. The Market Rotation we saw last week, with an exit from Tech into
Trading Patterns For Stocks And Commodities
 Trading Patterns For Stocks And Commodities It doesn t matter if you are a long-term investor, short swing trader or day trader, you are always looking for an advantageous spot to enter your position.
JaySignal BULLSEYE TRADING
 JaySignal BULLSEYE TRADING JaySignal is a standalone fibonacci confluence Ninja Trader Indicator that we lease for $150.00 a month as an add on to our live trading room. It can be used for additional setups
WELCOME
 www.facebook.com/fxdd www.twitter.com/fxdd WELCOME Part 1: Building the Forex Traders Foundation Greg Michalowski Email: greg@fxdd.com www.livestream.com/fxdd www.fxddnow.com Twitter: gregmikefx Disclaimer
Trading Lessons from the Intraday Frame (study)
") 1 Daily "Idealized Trades" Report Trading Lessons from the Intraday Frame (study) 1 2018 TheoTrade LLC. All rights reserved. 2 Trading Lessons from the Intraday Frame (1-min) 2 2018 TheoTrade LLC. All
1 Daily "Idealized Trades" Report Trading Lessons from the Intraday Frame (study) 1 2018 TheoTrade LLC. All rights reserved. 2 Trading Lessons from the Intraday Frame (1-min) 2 2018 TheoTrade LLC. All
Trade Setups, Rules & Trading Strategies
 Trade Setups, Rules & Trading Strategies dba of FreeTradingVideos.com, Inc. v.1411 Using Technical Analysis to Enter, Manage and Exit Trades Quote of the Day At Grok Trade, we do not trade Trading Patterns.
The content of and this ebook are copyrighted and may not be copied or reproduced.
 All rights reserved. Except for brief quotations in a review of this publication, no part of this publication may be reproduced, stored in a retrieval system, or transmitted in any form or by any means
Trading Lessons from the Intraday Frame (study)
") 1 Daily "Idealized Trades" Report Trading Lessons from the Intraday Frame (study) 1 2018 TheoTrade LLC. All rights reserved. 2 Trading Lessons from the Intraday Frame (1-mi) Major Companies Reporting Earnings
1 Daily "Idealized Trades" Report Trading Lessons from the Intraday Frame (study) 1 2018 TheoTrade LLC. All rights reserved. 2 Trading Lessons from the Intraday Frame (1-mi) Major Companies Reporting Earnings
Chart Pattern Secrets
 Chart Pattern Secrets June 14, 2018 Next Alert: 06/19/18 The Trading System: Application of Trading Chart Patterns with Futures and Option Contracts Copyright 1997 All rights reserved. 1 2 3 4 5 5/15/18:
The Best Technical Indicator in the World
 The Best Technical Indicator in the World Presented by Andrew Keene Past performance is not indicative of future results. RISK DISCLAIMER Day trading, short term trading, options trading, and futures trading
2.0. Learning to Profit from Futures Trading with an Unfair Advantage! Income Generating Strategies Starting the Trading Day
 2.0 Learning to Profit from Futures Trading with an Unfair Advantage! Income Generating Strategies Starting the Trading Day Income Generating Strategies Starting the Trading Day Pre-Market Analysis Before
Presents FOREX ALPHA CODE
 Presents FOREX ALPHA CODE Forex Alpha Code Published by Alaziac Trading CC Suite 509, Private Bag X503 Northway, 4065, KZN, ZA www.tradeology.com Copyright 2014 by Alaziac Trading CC, KZN, ZA Reproduction
USER MANUAL. Version 1.7
 USER MANUAL Version 1.7 1 LEGAL NOTICE NO INVESTMENT ADVICE. The information contained in this user manual has no regard to the specific investment objective, financial situation or particular needs of
Weekly outlook for Jan. 28 Feb
 Weekly outlook for Jan. 28 Feb. 1 2019 Summary The S&P500 index is expected to continue its rally, but there is a lot of economic data due this week and a n abundance of external news events. All of this
CPO PRICE ANALYSIS AND OUTLOOK FOR 2H JULY 2013 Presented by: Benny Lee, Private trader/ Chief Market Strategist
 CPO PRICE ANALYSIS AND OUTLOOK FOR 2H 2013 1-2 JULY 2013 Presented by: Benny Lee, Private trader/ Chief Market Strategist CONTENTS: 1. Technical analysis of crude palm oil Trend Analysis short term 1 Chart
Tommy s Revenge 2.0 Module 2 Part 2
 1 Mark Deaton here with your follow-up to Module 2. Going to cover a few things in this video and try to keep it short and sweet. We re going to look at Stock Fetcher and how we can use Stock Fetcher to
FOREX INCOME BOSS. Presents. SRT Profit System
 FOREX INCOME BOSS Presents SRT Profit System Published by Alaziac Trading CC Suite 509, Private Bag X503 Northway, 4065, KZN, ZA www.forexincomeboss.com Copyright 2014 by Alaziac Trading CC, KZN, ZA Reproduction
Understanding Oscillators & Indicators March 4, Clarify, Simplify & Multiply
 Understanding Oscillators & Indicators March 4, 2015 Clarify, Simplify & Multiply Disclaimer U.S. Government Required Disclaimer Commodity Futures Trading Commission Futures and Options trading has large
Chart Patterns. (High Probability Chart Patterns) By Russ Horn
 By Russ Horn") (High Probability ) By Russ Horn 1 RISK DISCLOSURE STATEMENT / DISCLAIMER AGREEMENT Trading any financial market involves risk. This report and all and any of its contents are neither a solicitation nor
(High Probability ) By Russ Horn 1 RISK DISCLOSURE STATEMENT / DISCLAIMER AGREEMENT Trading any financial market involves risk. This report and all and any of its contents are neither a solicitation nor
Market Observations - as of Sep 28, 2018
 Market Observations - as of Sep 28, 2018 By Carl Jorgensen - For Objective Traders - For educational purposes only. Not Financial Advice. The month week, month and quarter ended with not much change in
Weekly outlook for June 12 June
 Weekly outlook for June 12 June 16 2017 TREND DIRECTION S&P 500 Oil Gold Short Term Intermediate-Term Long Term weak buy buy Weak neutral Strong sell buy buy buy Summary The S&P500 index is expected to
Today s Tech Tip: Special Report
 Today s Tech Tip: Special Report Dennis W. Wilborn, Sr. ActiveTrendTrading.com dww@activetrendtrading.com Breakouts or Bounces both Good, but which is Best? Disclaimer U.S. Government Required Disclaimer
2010. Trading Concepts, Inc. All Rights Reserved. For More Information Please Visit
 E-Mini Volume Breakout System By Todd Mitchell For additional information, please go to http://www.eminisuccessformula.com Copyright 2010 by Trading Concepts, Inc. All Rights Reserved. U.S. Government
No duplication of transmission of the material included within except with express written permission from the author.
 Copyright Option Genius LLC. All Rights Reserved No duplication of transmission of the material included within except with express written permission from the author. Be advised that all information is
Dividend Status - Version 9.0
 Dividend Status - Version 9.0 Description: The Dividend Status (DS) ShowMe allows you to get information about upcoming dividends as well as historical data about prior dividend announcements. DS allows
Inter-market Technical Analysis for April 22, Summary Chart TheoTrade LLC. All rights reserved.
 1 Weekly Inter-market Technical Report Summary Chart 1 2018 TheoTrade LLC. All rights reserved. 2 Intraday Intermarket Volatility is returning to the markets, particularly with the collapse/sell-swing
Trading Lessons from the Intraday Frame (study)
") 1 Daily "Idealized Trades" Report Trading Lessons from the Intraday Frame (study) 1 2018 TheoTrade LLC. All rights reserved. 2 Trading Lessons from the Intraday Frame (1-mi) 2 2018 TheoTrade LLC. All rights
1 Daily "Idealized Trades" Report Trading Lessons from the Intraday Frame (study) 1 2018 TheoTrade LLC. All rights reserved. 2 Trading Lessons from the Intraday Frame (1-mi) 2 2018 TheoTrade LLC. All rights
FOREX INCOME BOSS. Presents. Rejection Spike
 FOREX INCOME BOSS Presents Rejection Spike Published by Alaziac Trading CC Suite 509, Private Bag X503 Northway, 4065, KZN, ZA www.forexincomeboss.com Copyright 2015 by Alaziac Trading CC, KZN, ZA Reproduction
 ADDING THE MACD Forex Strategy Master Published by Old Tree Publishing CC Suite 509, Private Bag X503 Northway, 4065, KZN, ZA www.oldtreepublishing.com Copyright 2013 by Old Tree Publishing CC, KZN, ZA