S&P 500 INDEX/d. % change 5 D. Volat 30 D
|
|
|
- Sylvia Grant
- 5 years ago
- Views:
Transcription

1 31-Oct-17 INDEX COMPANY SECTOR RIC NAME ABSOLUTE TREND LAST INDEX COMPANY % change Volat 30 D S&P 500 INDEX/d LOCKHEED MARTI/d SCORING RSI daily.spx S&P 500 INDEX/d BULL 2 572,83-0,32 4,5 5,4 61,4 1,8 4,2 7,8 0,3 1,7 3,9 7,6 13,3 LMT.N LOCKHEED MARTI/d reduce BULL 308,63 0,20 10,9 7,6 31,3-0,6 4,5 11,0-3,8-0,9 3,9 13,6 21,3 SPREAD = COMPANY - INDEX MA40 MA120 MA250 5 D TRADING ALERT 1 M 3 M 6 M 10 M 6,4 2,2-30,1-2,5 0,3 3,2-4,1-2,6 0,0 6,0 8,0 EQUITY EXPOSURE ASSET MANAGER 80% LONG TRADER 20% SHORT 1/5 LOCKHEED MARTI/d TREND* Reverse Level ** Short Term - 1 Mth BEAR 317,5-322,5 Medium Term - 3 Mths BULL 304,50 Long Term - 10 Mths BULL 282,50 * based on the DAILY chart!!! ** market on close MAIN FACT Lockheed Martin ( cap 88B$) is very impressive. According to our daily absolute LT indicators, the stock has been remaining above our LT yellow since March 2013!!! Some ST warning signs appeared recently but without noticeable voulmes to push the On Balance Volume in the bearish side. The RSI became bearish 3 days ago. Next earning report on Jan 2018 the 22nd. Our trend reversal levels may help you to adjust your exposure in the coming sessions (last page)! Never forget your money management rules. Daily chart : OSCILLATOR LT BULL OSCILLATOR MT REDUCE LONG EXPOSURE OBV BULL Trading ACTION NTL with a positive bias FR Reversal Level RATIO ST BEAR 1,212 RATIO MT BEAR 1,226 RATIO LT BULL 1,088 huteauth@trendandtiming.com Phone : 33 (0)

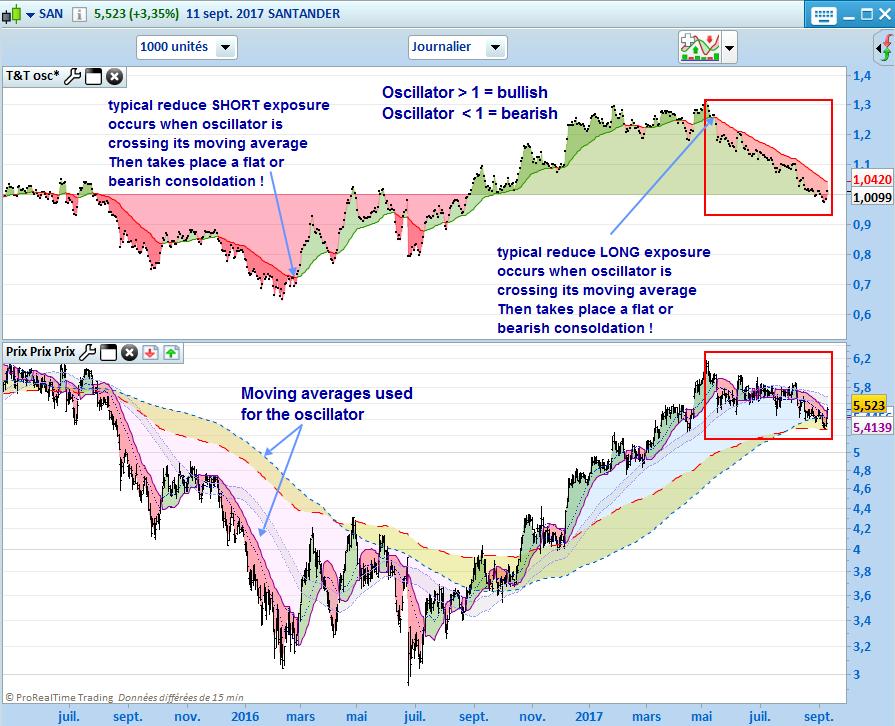
2 2/5 MOVING AVERAGES OSCILLATOR Phone: 33 (0)

 6 11")
3 3/5 RATIO against an INDEX TRADING ACTION Phone: 33 (0)

4 4/5 OBV SCORING Phone : 33 (0)


5 5/5 IMPORTANT : our methodology is a mixed approach with results extracted from: trend following models, support-resistance levels and technical quantitative tools. Charts are edited from ProRealtime.com Rough data are coming from Thomson Reuters. THEORETICAL EXPOSURE for Asset Manager & Trader Based on a daily chart reading. ASSET MANAGER priority is given to the LT trend TRADER priority is given to the ST trend Long term BULL BULL BULL BULL Long term BULL BULL BEAR BEAR Medium term BULL BULL BEAR BEAR Medium term BULL BEAR BULL BEAR Short term BULL BEAR BULL BEAR Short term BULL BULL BULL BULL EQUITY EXPOSURE 100% LONG 80% LONG 70% LONG 60% LONG EQUITY EXPOSURE 100% LONG 70% LONG 40% LONG 20% LONG CASH 0% 20% 30% 40% * of its maximum authorized risk Long term BEAR BEAR BEAR BEAR Long term BEAR BEAR BULL BULL Medium term BEAR BEAR BULL BULL Medium term BEAR BULL BEAR BULL Short term BEAR BULL BEAR BULL Short term BEAR BEAR BEAR BEAR EQUITY EXPOSURE 0% 20% LONG 30% LONG 40% LONG EQUITY EXPOSURE 100% SHORT 70% SHORT 40% SHORT 20% SHORT CASH 100% 80% 70% 60% Disclaimer : This document has been prepared solely for informational purposes, and is intended only fo use be the designated recipient(s). This information was obtained from sources we believe to be reliable, but its accuracy is not guaranteed. All information is subject to change without notice. T his does not constitute a solicitation or offer to buy securities or sell secutities or any other instruments, or a recommandation with respect to any security or inst rument mentioned herein. This is not a confirmation of terms of any transaction. No representations are made herein with respect to availability, pricing or perform ance. Additional information available on request. This document should only be read by those persons to whom it is addressed and is not intended to be relied upon by any person without subsequent written confirmation of its contents. If you have received this message in error, please destroy it and delete it from your computer, Any form of reproduction, dissemination, copying, disclosure, modification, distribution and/or publication of this e -maim message is strictly prohibited. huteauth@trendandtiming,com Phone: 33 (0)
Constellation Brands
 1/7 TRADING ALERT Constellation Brands huteauth@trendandtiming,com Phone: 33 (0) 6 11 88 36 11 5-Jan-18 INDEX COMPANY RIC NAME ABSOLUTE TREND Close INDEX S&P 500 INDEX/d COMPANY CONSTELLATION /d d-1 Volat
S&P 500 INDEX/d DJ CHEMICALS. % change 5 D. Volat 30 D
 9-Nov-17 INDEX SECTOR SECTOR RIC NAME ABSOLUTE TREND LAST INDEX SECTOR % change Volat 30 D S&P 500 INDEX/d DJ CHEMICALS RSI daily.spx S&P 500 INDEX/d 2 584,62-0,38 4,4 5,5 58,3 1,4 4,1 7,8 0,2 1,3 4,7
1/5 TRADING ALERT. Eurostoxx BASICS RESOURCES - SXPE. 26-Oct-16. Phone : 33 (0)
") 1/5 2/5 3/5 4/5 ABSOLUTE SCORING & RANKING RIC NAME 25-Oct-16 AVG AVG AVG AVG AVG AVG AVG AVG AVG AVG AVG.SXPE 199,85 4,14 48% 20,6 20,1 75,7 8,6 12,7 20,4 5,0 12,0 11,7 22,8 47,4 64 339 ABSOLUTE % vol
1/5 2/5 3/5 4/5 ABSOLUTE SCORING & RANKING RIC NAME 25-Oct-16 AVG AVG AVG AVG AVG AVG AVG AVG AVG AVG AVG.SXPE 199,85 4,14 48% 20,6 20,1 75,7 8,6 12,7 20,4 5,0 12,0 11,7 22,8 47,4 64 339 ABSOLUTE % vol
Eurostoxx 50 future. DAILY review. Reversal* Level TREND. Short Term -1 Month BEAR Medium Term - 3 Months BEAR 3 100
 1/7 DAILY review Eurostoxx 50 future 1-Jul-16 Eurostoxx 50 future Reversal* Level Short Term -1 Month BEAR 2940-2976 Medium Term - 3 Months BEAR 3 100 Long Term -10 Months BEAR 3 100 * market on close
Eurostoxx 50 future. DAILY review. Reversal* Level TREND. Short Term -1 Month BULL Medium Term - 3 Months BULL 2 720
 1/7 DAILY review Eurostoxx 50 future 27-Jul-16 Eurostoxx 50 future Reversal* Level Short Term -1 Month BULL 2860 Medium Term - 3 Months BULL 2 720 Long Term -10 Months BEAR 3 020 * market on close (cash
Eurostoxx 50 future. DAILY review. Reversal* Level TREND. Short Term -1 Month BULL Medium Term - 3 Months BULL 2880
 1/7 DAILY review Eurostoxx 50 future 26-Aug-16 Eurostoxx 50 future Reversal* Level Short Term -1 Month BULL 2950 Medium Term - 3 Months BULL 2880 Long Term -10 Months BEAR 3080 * market on close (cash
Eurostoxx 50 future. DAILY review. Reversal* Level TREND. Short Term -1 Month BEAR Medium Term - 3 Months BULL 2910
 DAILY review Eurostoxx 50 future 1/7 29-Nov-16 Eurostoxx 50 future Reversal* Level Short Term -1 Month BEAR 3060 Medium Term - 3 Months BULL 2910 Long Term -10 Months BEAR 3080-3110 * market on close (cash
Eurostoxx 50 future. DAILY review. Reversal* Level TREND. Short Term -1 Month BULL Medium Term - 3 Months BULL 2880
 1/7 DAILY review Eurostoxx 50 future 25-Aug-16 Eurostoxx 50 future Reversal* Level Short Term -1 Month BULL 2950 Medium Term - 3 Months BULL 2880 Long Term -10 Months BEAR 3080 * market on close (cash
EQUITY-FIXED INCOME CURRENCY-COMMODITY
 1 / 5 04/10/2016 USD ETFs 07/04/2017 Absolute Scoring & Ranking EQUITY-FIXED INCOME CURRENCY-COMMODITY Weekly Review www.trendandtiming.com 2/5 Weekly Report USD ETF EQUITIES EQUITY W-1 11-Aug-17 AVG AVG
EQUITY-FIXED INCOME CURRENCY-COMMODITY
 1 / 5 04/10/2016 USD ETFs 07/04/2017 Absolute Scoring & Ranking EQUITY-FIXED INCOME CURRENCY-COMMODITY Weekly Review www.trendandtiming.com 2/5 Weekly Report USD ETF EQUITIES EQUITY W-1 3-Nov-17 AVG AVG
DAILY review Mini S&P 500 future
 DAILY review Mini S&P 500 future 1/12 7-Sep-17 Mini S&P500 future Reversal* Level DJIA components SCORING VOLUME Daily Outperf. 6,9-16,2% ST 1 month BULL 2415 Daily Underperf. -0,6 3,2% MT 3 months BULL
Technical Analysis Workshop Series. Session 11 Semester 2 Week 5 Oscillators Part 2
 Technical Analysis Workshop Series Session 11 Semester 2 Week 5 Oscillators Part 2 DISCLOSURES & DISCLAIMERS This research material has been prepared by NUS Invest. NUS Invest specifically prohibits the
Commodities Corner. REP Synopsis Gold (Play the Range)
") REP-039 www.jamapunji.pk Gold prices set to post fourth consecutive weekly gains GOLD: Gold prices fell initially in the previous session, making a low of US$1,307/oz after traders booked profit as the
REP-039 www.jamapunji.pk Gold prices set to post fourth consecutive weekly gains GOLD: Gold prices fell initially in the previous session, making a low of US$1,307/oz after traders booked profit as the
Forex Sentiment Report Q2 FORECAST WEAK AS LONG AS BELOW April
 Forex Sentiment Report 08 April 2015 www.ads-securities.com Q2 FORECAST WEAK AS LONG AS BELOW 1.1200 Targets on a break of 1.1534/35: 1.1740/50 1.1870/75 1.2230/35 Targets on a break of 1.0580/70: 1.0160
1 P a g e. Executive Summary
 Executive Summary Over the past week we re-introduced some alternative counts, all of which bullish and some simple more bullish than others. The market keeps tracking them well; and we still can t eliminate
Trade NFP based on historical Correlation
 Today we are waiting the big US data to be released NFP (Non-Farm-Payroll); Which markets do expect that the economy successfully will add 210,000 to 216,000 jobs and the unemployment rate would fall to
DAILY review Mini S&P 500 future
 1/13 DAILY review Mini S&P 500 future 12-Jun-18 Mini S&P500 future Reversal* Level DJIA components SCORING VOLUME Daily Outperf. 5,7-17,1 ST 1 month BULL 2700 Daily Underperf. 2,9-9,5 MT 3 months BULL
Adding longs in the SPX zone will be well-rewarded longer term we believe.
 Executive Summary Last week we found, based on our analyses of the charts: Our SPX2146-2069 target zone remains and can now be narrowed down to SPX2117-2069, as the S&P500 closed at SPX2128 yesterday,
Introduction. Leading and Lagging Indicators
 1/12/2013 Introduction to Technical Indicators By Stephen, Research Analyst NUS Students Investment Society NATIONAL UNIVERSITY OF SINGAPORE Introduction Technical analysis comprises two main categories:
1 P a g e. Executive Summary
 Executive Summary We can keep the executive summary very simple, and repeat what we said last week: A break below SPX2405 is now needed to put the Bull-count in jeopardy. Until then we have to look up,
Stock Market Briefing: S&P 500 Trailing P/E Ratios
 Stock Market Briefing: S&P Trailing P/E Ratios January 31, 18 Dr. Edward Yardeni 16-972-7683 eyardeni@ Joe Abbott 732-497-6 jabbott@ Mali Quintana 48-664-1333 aquintana@ Please visit our sites at www.
COMMODITIES CORNER. Gold nudges up amid looming U.S. tariffs on China. Synopsis Gold (Play the Range) 2nd Resistance
 2nd Resistance") COMMODITIES CORNER September 17, 2018 Synopsis Gold (Play the Range) US$1,210 US$1,200 US$1,190 US$1,185 Silver (Play the Range) US$14.50 US$14.30 US$14.00 US$13.80 WTI (Play the Range) US$71.40 US$70.20
COMMODITIES CORNER September 17, 2018 Synopsis Gold (Play the Range) US$1,210 US$1,200 US$1,190 US$1,185 Silver (Play the Range) US$14.50 US$14.30 US$14.00 US$13.80 WTI (Play the Range) US$71.40 US$70.20
The S&P500 is still allowed to tag SPX and then roll over, as it would fit with a c=a relationship on the COMPQ to $6226.
 Yesterday I showed the different possibilities the market has, and since there s not been a >10p move to the opposite direction since the SPX2446.55 low and SPX 2469.64 higher were struck (today s decline
COMMODITIES CORNER. Oil prices rise on lower U.S. crude inventories, looming Iran sanctions. Synopsis Gold (Play the Range) 2nd Resistance
 2nd Resistance") COMMODITIES CORNER September 12, 2018 Synopsis Gold (Play the Range) US$1,210 US$1,200 US$1,190 US$1,185 Silver (Play the Range) US$14.60 US$14.40 US$14.00 US$13.80 WTI (Play the Range) US$71.40 US$70.20
COMMODITIES CORNER September 12, 2018 Synopsis Gold (Play the Range) US$1,210 US$1,200 US$1,190 US$1,185 Silver (Play the Range) US$14.60 US$14.40 US$14.00 US$13.80 WTI (Play the Range) US$71.40 US$70.20
MTA Educational Web Series
 MTA Educational Web Series One Practitioner s Guide to Combining Macro, Fundamentals and Technical Analysis Presented by: Keith Lerner, CFA, CMT Chief Market Strategist SunTrust Bank July 2014 Outline:
COMMODITIES CORNER. Gold prices ease as U.S. rate hike views, trade tensions boost dollar. Synopsis Gold (Play the Range) 2nd Resistance
 2nd Resistance") COMMODITIES CORNER September 11, 2018 Synopsis Gold (Play the Range) US$1,210 US$1,200 US$1,190 US$1,185 Silver (Play the Range) US$14.60 US$14.40 US$14.00 US$13.80 WTI (Play the Range) US$69.20 US$68.70
COMMODITIES CORNER September 11, 2018 Synopsis Gold (Play the Range) US$1,210 US$1,200 US$1,190 US$1,185 Silver (Play the Range) US$14.60 US$14.40 US$14.00 US$13.80 WTI (Play the Range) US$69.20 US$68.70
Technical Analysis Workshop Series. Session Ten Semester 2 Week 4 Oscillators Part 1
 Technical Analysis Workshop Series Session Ten Semester 2 Week 4 Oscillators Part 1 DISCLOSURES & DISCLAIMERS This research material has been prepared by NUS Invest. NUS Invest specifically prohibits the
Commodities Corner. U.S. equities closed at record high; oil prices soar. REP-039
 REP-039 www.jamapunji.pk U.S. equities closed at record high; oil prices soar GOLD: Gold prices plunged to a five-month low as Federal Reserve raised its benchmark interest rates for the third time this
Chart Collection for Morning Briefing
 Chart Collection for Morning Briefing October 25, 1 Dr. Edward Yardeni 5-972-763 eyardeni@ Mali Quintana 4-664-1333 aquintana@ Please visit our sites at www. blog. thinking outside the box 325 3 275 Figure
The Carlucci Indicator
 Third Party Research July 1, 2016 The Carlucci Indicator eresearch Corporation is pleased to provide a weekly chart and table of The Carlucci Indicator, which is billed as the Best Stock Market Indicator
Ichimoku Charts How to read Clouds for Profitable Advantage
 Ichimoku Charts How to read Clouds for Profitable Advantage David Linton Updata david@updata.co.uk What I will cover General Points about Technical Analysis Theory, Cloud Construction, Interpretation Examples
COMMODITIES CORNER. Oil prices rebound slightly after heavy declines over trade dispute. Synopsis Gold (Play the Range) 2nd Resistance
 2nd Resistance") COMMODITIES CORNER Synopsis Gold (Play the Range) US$1,235 US$1,225 US$1,210 US$1,205 Silver (Play the Range) US$15.70 US$15.50 US$15.20 US$14.90 WTI (Play the Range) US$69.40 US$68.10 US$66.40 US$65.50
COMMODITIES CORNER Synopsis Gold (Play the Range) US$1,235 US$1,225 US$1,210 US$1,205 Silver (Play the Range) US$15.70 US$15.50 US$15.20 US$14.90 WTI (Play the Range) US$69.40 US$68.10 US$66.40 US$65.50
Technical Analysis Workshop Series. Session Eight Commodity Channel Index
 Technical Analysis Workshop Series Session Eight DISCLOSURES & DISCLAIMERS This research material has been prepared by NUS Invest. NUS Invest specifically prohibits the redistribution of this material
Figure 1. SPX 60 min & NAS 1-min chart.
 BINGO!? Today we reached the ideal SPX2625 target to the T (SPX2625.76) for wave-a. There s now negative divergence again on the hourly RSI5 and the hourly MACD (see Fig 1), while the daily indicators
COMMODITIES CORNER. Gold prices hold steady amid easing dollar. Synopsis Gold (Play the Range) 2nd Resistance
 2nd Resistance") COMMODITIES CORNER November 05, 2018 Synopsis Gold (Play the Range) US$1,245 US$1,235 US$1,225 US$1,210 Silver (Play the Range) US$15.00 US$14.90 US$14.50 US$14.30 WTI (Play the Range) US$64.90 US$63.90
COMMODITIES CORNER November 05, 2018 Synopsis Gold (Play the Range) US$1,245 US$1,235 US$1,225 US$1,210 Silver (Play the Range) US$15.00 US$14.90 US$14.50 US$14.30 WTI (Play the Range) US$64.90 US$63.90
COMMODITIES CORNER. Gold rises as dollar slips, set for first weekly gain in three. Synopsis
 COMMODITIES CORNER April 12, 2019 Synopsis Gold (Play the Range) US$1,310 US$1,300 US$1,290 US$1,280 Silver (Play the Range) US$15.50 US$15.20 US$14.90 US$14.80 WTI (Play the Range) US$65.50 US$64.50 US$62.50
Trade Room Notes Wednesday January 21 st, 2015
 Trade Room Notes Wednesday January 21 st, 2015 Legal Disclaimer None of The Super Trader or any of its officers, directors, employees, other personnel, representatives, agents or independent contractors
COMMODITIES CORNER. Gold steadies above 5-week lows as market rally pauses. Synopsis
 COMMODITIES CORNER March 06, 2019 Synopsis Gold (Play the Range) US$1,300 US$1,290 US$1,280 US$1,270 Silver (Play the Range) US$15.50 US$15.30 US$15.00 US$14.80 WTI (Play the Range) US$57.30 US$56.30 US$55.30
LMEprecious week four update
 LMEprecious week four update 07 August 2017 SETTING THE GLOBAL STANDARD Lots Volumes for LME Gold and LME Silver Combined ADV for week four was 7,728 lots, up from 7,467 lots in week three 14,000 LMEprecious
GLOBAL FX STRATEGY FX SENTIMENT REPORT
 Friday, January 5, 218 Bullish EUR Position Reaches Fresh Record High Data in this report cover up to Tuesday January 2nd & were released Friday January 5th. The EUR net position has climbed to a fresh
1 P a g e. Executive Summary
 Executive Summary Price finally reached our expect SPX2112-2120 and the negative divergences that started to creep in on the daily TIs finally also took their toll over the past 2 days. The weekly charts
US Dow Jones Index / US30Cash (DAILY CHART) System price target 15,660.00
 System price target 15,660.00") DAILY TECHNICAL US Dow Jones Index / US30Cash (DAILY CHART) System price target 15,660.00 Thursday, January 30, 2014 S1=15,660.00 Support R1=16,564.00 R2=16,048.00 ADX Signal Comment: Short positions for
DAILY TECHNICAL US Dow Jones Index / US30Cash (DAILY CHART) System price target 15,660.00 Thursday, January 30, 2014 S1=15,660.00 Support R1=16,564.00 R2=16,048.00 ADX Signal Comment: Short positions for
COMMODITIES CORNER. Gold set for biggest weekly loss since August as dollar weighs. Synopsis Gold (Play the Range) 2nd Resistance
 2nd Resistance") COMMODITIES CORNER Synopsis Gold (Play the Range) US$1,230 US$1,225 US$1,215 US$1,210 Silver (Play the Range) US$14.70 US$14.60 US$14.30 US$14.20 WTI (Play the Range) US$61.80 US$60.80 US$58.30 US$57.00
COMMODITIES CORNER Synopsis Gold (Play the Range) US$1,230 US$1,225 US$1,215 US$1,210 Silver (Play the Range) US$14.70 US$14.60 US$14.30 US$14.20 WTI (Play the Range) US$61.80 US$60.80 US$58.30 US$57.00
Sector Methodology. Quality. Scale. Performance.
 Sector Methodology Quality. Scale. Performance. Your Guide to CFRA Sector Methodology Quality. Scale. Performance. CFRA s Investment Policy Committee (IPC) consists of a team of five seasoned investment
Intelligent Investing, LLC Major Indices Daily Update 02/26/ 19
 Elliot Wave Updates Yesterday I found a move below last Friday s high (SPX2794.20) will be a first sign of lower prices as then the decline can t be a 4 th wave because 4 th and 1 st waves can t overlap
Morning Trading Comments
 Monday, September 03, 2018 1 Morning Trading Comments SUMMARY OF TRADING VIEWS European stockmarket indices resumed their downtrend over the last few sessions showing that, despite the recent technical
Morning Trading Comments
 Friday, June 15, 2018 1 Morning Trading Comments SUMMARY OF TRADING VIEWS For the first time since a long time, European indices were able to rally without the USA. Very strong day for DAX, CAC and Euro
Technical Analysis Workshop Series. Session Three
 Technical Analysis Workshop Series Session Three DISCLOSURES & DISCLAIMERS This research material has been prepared by NUS Invest. NUS Invest specifically prohibits the redistribution of this material
NL AIR France Analysis of 25-Jun-2016 Closing price of 24-Jun-2016 EUR Neutral. Risk Zone. Stars
 Industrial Goods & Services - Aerospace BUS GROUP NL0000235190 France Analysis of 25-Jun-2016 Closing price of 24-Jun-2016 EUR 52.11 BUS GROUP active in the sector «Aerospace», belongs to the industry
Leadership Continues To Test Support
 Leadership Continues To Test Support I am going to continue to highlight the pattern of the leader off the 2009 low (Semiconductors) until a breakout of 2000 highs or a breakdown of 2-year rising support
RISK DISCLOSURE STATEMENT / DISCLAIMER AGREEMENT
 RISK DISCLOSURE STATEMENT / DISCLAIMER AGREEMENT Trading any financial market involves risk. This report and all and any of its contents are neither a solicitation nor an offer to Buy/Sell any financial
1 P a g e. Executive Summary
 Executive Summary Last week I was looking for SPX2455-2475 and the S&P500 gave us SPX2454 on Monday and then started to pullback and consolidate causing for many pundits to already start top calling. Close
SPX for the smaller major-4 triangle or SPX to complete the double zigzag. Figure 1.
 Today s break -finally- below SPX2625 (and SPX2613) places the Ball now firmly in the Bears camp, albeit today s strong rally off the lows. And the two main bear counts remain the focus for now: SPX2579-2568
Technical Analysis. Dealing Room Peter Leonidou. Peter Leonidou
 Technical Analysis Dealing Room Questions Traders Should Ask What is the trend? What is the pivot point? What is the support levels? What is the resistance levels? Strong or weaker USD? What 1. Trade
COMMODITIES CORNER. Gold prices slip as Dollar recover. Synopsis
 COMMODITIES CORNER December 21, 2018 Synopsis Gold (Play the Range) US$1,278 US$1,266 US$1,255 US$1,240 Silver (Play the Range) US$15.00 US$14.85 US$14.70 US$14.30 WTI (Play the Range) US$47.85 US$46.90
GLOBAL FX STRATEGY FX SENTIMENT REPORT
 Aggressive Build In CAD Net Short; Aggregate USD Long Extended Data in this report cover up to Tuesday Dec & were released Friday Feb 1. The CFTC releases were interrupted by the US Government shutdown
COMMODITIES CORNER. Gold edges up ahead of G20 meeting; set to post second weekly gain. Synopsis Gold (Play the Range) 2nd Resistance
 2nd Resistance") COMMODITIES CORNER November 23, 2018 Synopsis Gold (Play the Range) US$1,236 US$1,228 US$1,218 US$1,210 Silver (Play the Range) US$14.70 US$14.60 US$14.30 US$14.20 WTI (Play the Range) US$55.50 US$54.50
COMMODITIES CORNER November 23, 2018 Synopsis Gold (Play the Range) US$1,236 US$1,228 US$1,218 US$1,210 Silver (Play the Range) US$14.70 US$14.60 US$14.30 US$14.20 WTI (Play the Range) US$55.50 US$54.50
Chart Collection for Morning Briefing
 Chart Collection for Morning Briefing ober 31, 1 Dr. Edward Yardeni 1-97-73 eyardeni@ Mali Quintana --1333 aquintana@ Please visit our sites at www. blog. thinking outside the box Figure 1. STOCK PRICE:
COMMODITIES CORNER. Gold inches up as retreat of bond yields weigh on dollar. Synopsis Gold (Play the Range) 2nd Resistance
 2nd Resistance") COMMODITIES CORNER October 10, 2018 Synopsis Gold (Play the Range) US$1,200 US$1,195 US$1,185 US$1,180 Silver (Play the Range) US$14.80 US$14.60 US$14.30 US$14.10 WTI (Play the Range) US$75.90 US$74.90
COMMODITIES CORNER October 10, 2018 Synopsis Gold (Play the Range) US$1,200 US$1,195 US$1,185 US$1,180 Silver (Play the Range) US$14.80 US$14.60 US$14.30 US$14.10 WTI (Play the Range) US$75.90 US$74.90
Understanding of Price-Volume -Open Interest in futures market
 Understanding of Price-Volume -Open Interest in futures market Introduction Price, Volume and Open interest are the most important market determinants in futures market. Among these, price is more important.
U.S. ECONOMIC UPDATE. MACRO February 5, 2014
 U.S. ECONOMIC UPDATE MACRO February 5, 2014 LEGAL DISCLAIMER Hedgeye Risk Management is a registered investment advisor, registered with the State of Connecticut. Hedgeye Risk Management is not a broker
We find good Fib-extension overlap at that level between the major and minor wave degrees suggesting it should work as a magnet for price.
 Executive Summary Last week we forecasted an ideal minute iii top at SPX2174-2188, followed by a drop to SPX2250-2235 (likely the high end of the range) for minute iv before the market continues to melt
Stock Market Briefing: Valuation Ratios Using Market Capitalization
 Stock Market Briefing: Valuation Ratios Using Market Capitalization December 11, 17 Dr. Edward Yardeni 516-972-7683 eyardeni@ Joe Abbott 732-497-5306 jabbott@ Mali Quintana 480-664-1333 aquintana@ Please
Initial Level (IL) Subsequent Level (SL) IL SL Guar seed Guar gum Guar seed. Above INR Guar seed Long
 Subsequent Level (SL) IL SL Guar seed Guar gum Guar seed. Above INR Guar seed Long") Daily Indian Guar seed and Guar Gum Market Mentor Decision enabling market analysis & price outlook For Jan 1, 212 NCDEX Jan 12 Futures as on 9 th Jan 12 Fundamental Summary Price outlook summary of Guar
Daily Indian Guar seed and Guar Gum Market Mentor Decision enabling market analysis & price outlook For Jan 1, 212 NCDEX Jan 12 Futures as on 9 th Jan 12 Fundamental Summary Price outlook summary of Guar
6:30pm USD High PPI m/m 0.2% 0.2% 6:30pm USD Medium Core PPI m/m 0.2% 0.2% BIPL Securities Limited. 8:00pm USD Medium
 COMMODITIES CORNER November 08, 2018 Synopsis Gold (Play the Range) US$1,240 US$1,230 US$1,220 US$1,210 Silver (Play the Range) US$14.70 US$14.60 US$14.30 US$14.20 WTI (Play the Range) US$64.50 US$63.50
Daily Copper Price Outlook and Strategy
 Decision enabling market analysis & price outlook Feb 02, 2015 Market Recap and Summary Outlook for next 3days LME copper, during Friday s trading session, traded in a positive note amidst a sharp short
Equities: Weekly Technical Overview 2nd October 2016
 Andy Dodd MSTA - +44 020 7031 4651 adodd@louiscapital.com Twitter : @louiscaptech Equities: Weekly Technical Overview 2nd October 2016 Equity Index Technical Dashboard The table below is intended as an
Stock Market Briefing: Valuation Models
 Stock Market Briefing: Valuation Models December 11, 17 Dr. Edward Yardeni 16-972-7683 eyardeni@ Joe Abbott 732-497-36 jabbott@ Mali Quintana 48-664-1333 aquintana@ Please visit our sites at www. blog.
1 P a g e. Executive Summary
 Executive Summary On Thursday, I proclaimed a major-3 top for the S&P500 based on OEW downtrend confirmations on several indices including the S&P500. Today I am terrible sorry to announce that I am not
Subject: Daily report explanatory notes, page 2 Version: 0.9 Date: Dec 29, 2013 Author: Ken Long
 Subject: Daily report explanatory notes, page 2 Version: 0.9 Date: Dec 29, 2013 Author: Ken Long Description Example from Dec 23, 2013 1. Market Classification: o Shows market condition in one of 9 conditions,
S&P 500 Industry Briefing: Independent Power & Energy Traders
 S&P Industry Briefing: Independent Power & Energy Traders February 1, 1 Dr. Ed Yardeni 1-97-73 eyardeni@ Joe Abbott 73-97-3 jabbott@ Please visit our sites at www. blog. thinking outside the box Table
1 P a g e. Executive Summary
 Executive Summary For three weeks we provided a primary (major b) and alternative count (primary V) up and we keep tracking both until one or the other is disproven. Two weeks ago we projected a major
COMMODITIES CORNER. Gold prices nod higher as optimism on US-China trade pressures the dollar. Synopsis Gold (Play the Range) 2nd Resistance
 2nd Resistance") COMMODITIES CORNER August 20, 2018 Synopsis Gold (Play the Range) US$1,205 US$1,195 US$1,180 US$1,160 Silver (Play the Range) US$15.30 US$15.00 US$14.60 US$14.30 WTI (Play the Range) US$67.40 US$66.40
COMMODITIES CORNER August 20, 2018 Synopsis Gold (Play the Range) US$1,205 US$1,195 US$1,180 US$1,160 Silver (Play the Range) US$15.30 US$15.00 US$14.60 US$14.30 WTI (Play the Range) US$67.40 US$66.40
COMMODITIES CORNER. Gold falls to 1-week low on stronger dollar, but holds above $1,300 level. Synopsis
 COMMODITIES CORNER February 07, 2019 Synopsis Gold (Play the Range) US$1,320 US$1,310 US$1,300 US$1,295 Silver (Play the Range) US$16.20 US$16.00 US$15.60 US$15.50 WTI (Play the Range) US$56.60 US$55.60
COMMODITIES CORNER. Gold subdued ahead of Fed Chair speech, G20 summit. Synopsis
 COMMODITIES CORNER November 27, 2018 Synopsis Gold (Play the Range) US$1,236 US$1,228 US$1,218 US$1,210 Silver (Play the Range) US$14.70 US$14.60 US$14.30 US$14.20 WTI (Play the Range) US$53.30 US$52.30
Swing Trading Framework 3 (Time)
") Swing Trading Framework 3 (Time) Prepared for: Pro Trader Subscribers Prepared by: Paul Andre Prepared at: December 11, 2018 EXECUTIVE SUMMARY Objective: The main objective with part 3 of this framework
Swing Trading Framework 3 (Time) Prepared for: Pro Trader Subscribers Prepared by: Paul Andre Prepared at: December 11, 2018 EXECUTIVE SUMMARY Objective: The main objective with part 3 of this framework
WEEKLY LATEST UPDATES
 WEEKLY LATEST UPDATES Gold bulls weathered rising U.S. interest rates, record-high equity markets and an improving global economy to push the metal to its best year since 2010 Bullion futures on the Comex
GLOBAL FX STRATEGY FX SENTIMENT REPORT
 CAD Risk Continues To Build As Speculators Add To Both Sides Data in this report cover up to Tuesday Dec 18 & were released Friday Dec 21. The aggregate USD position climbed a modest $.3bn on the week,
Stock Market Briefing: S&P 500 Sectors Net Earnings Revisions
 Stock Market Briefing: S&P Sectors Net Earnings Revisions November, 1 Dr. Ed Yardeni 1-- eyardeni@ Joe Abbott -- jabbott@ Mali Quintana --1 aquintana@ Please visit our sites at www. blog. thinking outside
GLOBAL FX STRATEGY FX SENTIMENT REPORT
 Friday, December 21, 218 CAD Risk Continues To Build As Speculators Add To Both Sides Data in this report cover up to Tuesday Dec 18 & were released Friday Dec 21. The aggregate USD position climbed a
Weekly Commodity Update Metals & Energy 8 th March Geofin Comtrade Ltd. GEOFIN RESEARCH DESK
 Weekly Commodity Update Metals & Energy 8 th March 2016 Geofin Comtrade Ltd. CONTENTS Currency Dollar Index, USD INR Precious Metals Gold, Silver Energy Crude Oil, Natural Gas Base Metals Copper, Nickel,
Report Summary. LME 3M: USD 2086 ( 0.27%) SHFE 3M: CNY (+0.46%) MCX Dec 13: INR ( 0.36%) Trader should wait for fresh position.
 SHFE 3M: CNY (+0.46%) MCX Dec 13: INR ( 0.36%) Trader should wait for fresh position.") Decision enabling market analysis & price outlook For Dec 31, 2013 Report Summary LME / SHFE / as on 30 th Dec, 2013 Fundamental Summary Technical Summary Price outlook summary Price Ranges Procurement
Decision enabling market analysis & price outlook For Dec 31, 2013 Report Summary LME / SHFE / as on 30 th Dec, 2013 Fundamental Summary Technical Summary Price outlook summary Price Ranges Procurement
Chart Collection for Morning Briefing
 Chart Collection for Morning Briefing August, 1 Dr. Edward Yardeni 1-97-73 eyardeni@ Mali Quintana --1333 aquintana@ Please visit our sites at www. blog. thinking outside the box 3 1 Figure 1. S&P & RECESSIONS
By Tri, Senior Analyst
 1/1/2014 Trend Following By Tri, Senior Analyst NUS Students Investment Society NATIONAL UNIVERSITY OF SINGAPORE Introduction Trend following was introduced by Richard Dennis when he taught trading strategies
Decision enabling cash market analysis & price outlook
 Decision enabling cash market analysis & price outlook For the week beginning Oct 16, 213 Fundamental Summary Technical Summary Price drivers Report Summary Prevailing dryness across Argentina Lower sun
Report Summary. Prices are likely to hold above MYR 2550 and trade on mixed note ahead of turning higher in the coming sessions
 Daily BMD CPO Price Outlook and Strategy Decision enabling market analysis & price outlook For Dec 31, 2013 Report Summary BMD CPO Mar 14 Futures Fundamental Summary MYR 2631( 1) on Dec 30, 2013 Price
You get an optimistic feeling when you see our research analytics.
 You get an optimistic feeling when you see our research analytics. Comfort Securities Limited Evening Round Up Disclosures and Disclaimer : This report must be read with the disclosures in the Disclosure
COMMODITIES CORNER. Gold slips as new U.S. tariffs on China lifts dollar. Synopsis Gold (Play the Range) 2nd Resistance
 2nd Resistance") COMMODITIES CORNER September 18, 2018 Synopsis Gold (Play the Range) US$1,210 US$1,205 US$1,190 US$1,185 Silver (Play the Range) US$14.50 US$14.30 US$14.00 US$13.80 WTI (Play the Range) US$70.20 US$69.20
COMMODITIES CORNER September 18, 2018 Synopsis Gold (Play the Range) US$1,210 US$1,205 US$1,190 US$1,185 Silver (Play the Range) US$14.50 US$14.30 US$14.00 US$13.80 WTI (Play the Range) US$70.20 US$69.20
IndiaNivesh Weekly Pulse
 21st Jan 2019 IndiaNivesh Weekly Pulse TECHNICAL RESEARCH 11000 still remains a real test for the bulls! Close 10907 Chart 1 : NIFTY Weekly Chart R1 / R2 10930 / 11000 S1 / S2 10690 / 10520 50 DEMA 10777
Long-Term trends for each index remains up and nothing of late has changed that!!!
 Long-Term trends for each index remains up and nothing of late has changed that!!! Each index is testing some form of overhead resistance. These are price points where bulls will say No Thank You to selling
Scarsdale Equities llc
 Scarsdale Equities llc Morning Note 10/4/2013 Member FINRA, SIPC SSS Technical Research Morning Note 10/4/2013 Sentiment Remains A Short Term Concern DJI Closes Below Another Support Level Opinion: Although
Chart Collection for Morning Briefing
 Chart Collection for Morning Briefing November 5, 1 Dr. Edward Yardeni 51-97-73 eyardeni@ Mali Quintana --1333 aquintana@ Please visit our sites at www. blog. thinking outside the box 35 3 75 5 Figure
Intelligent Investing, LLC Major Indices Daily Update 02/28/ 19
 Elliot Wave Updates Today the S&P500 was stuck in a less than 6p range. So there s really not much we can learn. All parameters remain the same a step 2: A move below SPX2764.55 (last Thursday s low) will
DEALMONEY MARKET BUZZ
 DEALMONEY MARKET BUZZ 15 th Oct 20 th Oct Index Equity Commodity Currency Equities Commodities Wealth Mutual Funds Insurance 1 Weekly Performance: Equity S.No Equity View Entry Target SL Outcome 1 Godrej
Trailing PE -- Forward PE -- Buy 6 Analysts. 1-Year Return: -34.7% 5-Year Return: -71.6%
 BSM TECHNOLOGIES INC (-T) Last Close 0.81 (CAD) Avg Daily Vol 39,289 52-Week High 1.45 Trailing PE -- Annual Div -- ROE -2.7% LTG Forecast -- 1-Mo -15.6% November 22 TORONTO Exchange Market Cap 70M 52-Week
EU50 Future (VG1) Futures: Short Term View / Levels. Andy Dodd - MSTA adodd 25th April 2018.
 Futures: Short Term View / Levels. Andy Dodd - MSTA adodd 25th April 2018.") Andy Dodd - MSTA +44 20 7031 4651 Twitter @louiscaptech adodd 2018 EU50 Future (VG1) Daily Chart Position Supports Resistances Position Size Short 3391 3354 3336 3319 3282 3418 3441 3481 3502 100% 3286
Andy Dodd - MSTA +44 20 7031 4651 Twitter @louiscaptech adodd 2018 EU50 Future (VG1) Daily Chart Position Supports Resistances Position Size Short 3391 3354 3336 3319 3282 3418 3441 3481 3502 100% 3286
S&P 500 Industry Briefing: S&P 500 Excluding Energy
 S&P Industry Briefing: S&P Excluding Energy October, 18 Dr. Ed Yardeni 16-97-7683 eyardeni@ Joe Abbott 73-97-36 jabbott@ Please visit our sites at www. blog. thinking outside the box Table Of Contents
WEEKLY REPORT 20 NOV.-2017
 WEEKLY REPORT 20 NOV.-2017 Upcoming Week Nifty Movement: The Nifty opened the week at 10322, made a high of 10343, low of 10094 and closed the week at 10283. Thus the Nifty closed the week with a loss
Trailing PE 5.3. Forward PE 7.0. Hold 6 Analysts. 1-Year Return: -52.1% 5-Year Return: -68.3%
 HIGH LINER FOODS INC (-T) Last Close 6.75 (CAD) Avg Daily Vol 83,237 52-Week High 15.67 Trailing PE 5.3 Annual Div 0.58 ROE 12.1% LTG Forecast -- 1-Mo 6.3% December 13 TORONTO Exchange Market Cap 228M
S&P Cash Long Term: Uptrend Intact. Monthly Log Chart
 Andy Dodd MSTA - +44 020 7031 4651 adodd@louiscapital.com Twitter : @louiscaptech S&P Cash Long Term: Uptrend Intact Despite an initial slowdown in momentum following the break above 2120 in July, which