1/5 TRADING ALERT. Eurostoxx BASICS RESOURCES - SXPE. 26-Oct-16. Phone : 33 (0)
|
|
|
- Jonah Carpenter
- 5 years ago
- Views:
Transcription

1 1/5

2 2/5

3 3/5
4 4/5 ABSOLUTE SCORING & RANKING RIC NAME 25-Oct-16 AVG AVG AVG AVG AVG AVG AVG AVG AVG AVG AVG.SXPE 199,85 4,14 48% 20,6 20,1 75,7 8,6 12,7 20,4 5,0 12,0 11,7 22,8 47, ABSOLUTE % vol D / Volat RSI Spread Spread Spread % change % change % change % change % change market LAST SCORING TREND change vol5 D 30 D daily MA40 MA120 MA250 5 D 1 M 3 M 6 M 10 M cap /ISPA.AS ARCELORMITTAL/d BULL 6,29 1,32-15% 32,9 54,0 83,4 14,2 23,7 49,4 8,8 18,3 15,4 50,2 165, /TENR.MI TENARIS/d BULL 13,45 0,98-2% 33,5 20,0 68,3 8,0 8,8 18,4 1,2 19,1 15,5 23,7 42, /UPM1V.HEUPM-KYMMENE OY/d BULL 21,02 10,75 144% 31,7 18,3 84,0 12,3 17,5 23,7 10,1 12,8 16,2 26,9 24, /VOES.VI VOESTALPINE/d BULL 32,65 0,46 14% 17,4 10,1 72,0 5,3 6,5 10,9 4,4 6,3 5,0 5,5 29, /STERV.HE STORA ENSO R/d BULL 8,63 6,88 153% 27,0 9,7 76,2 7,1 10,7 9,2 5,1 8,2 9,7 20,2 5, /IMTP.PA IMERYS/d BULL 67,78-0,21-9% 16,6 8,6 70,6 4,9 8,7 10,9 0,5 7,4 8,6 10,3 17, huteauth@trendandtiming.com phone : +33 (0)
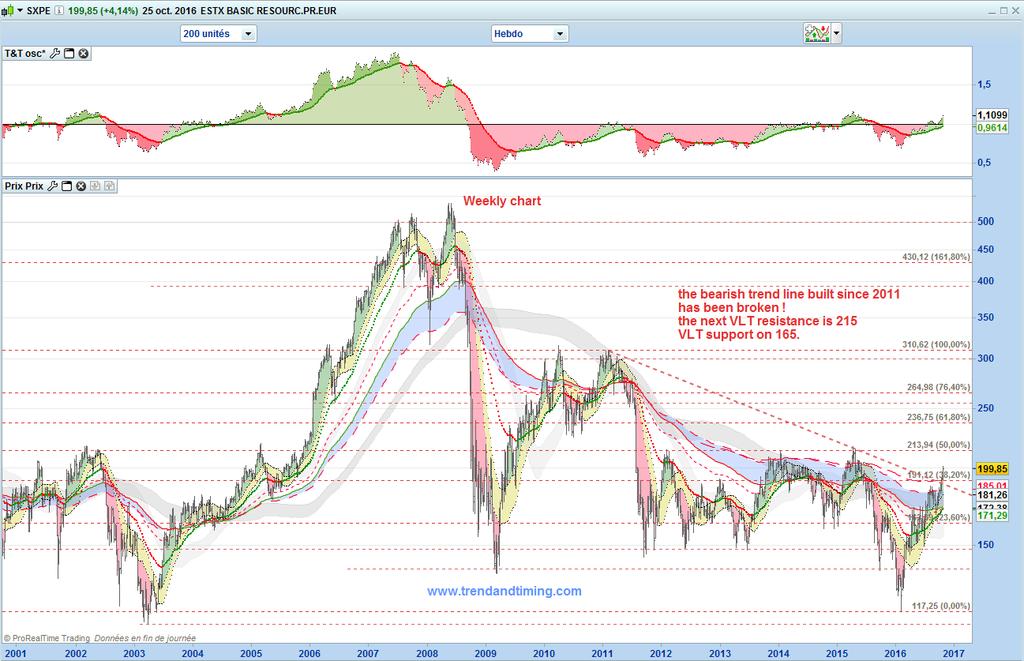
5 5/5 Easy reading for the CHARTS: T&T ST trend : short term indicator (1 month+) showing a bull trend above 0 (green) or a bearish one below 0 (red), For 0, it still get th e previous color trend. T&T osc* : First : to get a bullish trend, we need an oscillator above 1. Second : the MA red or green shows the oscillator momentum. The cross between the indicator and the moving average can be used as trading signal. To be more efficient, you may open a bull trade only if the cross and the indicator are above 1. When the indicator is above 1 and the cross indicates a sell signal, it is not a sell signal, it is only time to close the trade. T&T cumul position : it is a synthesis of several ST and LT T&T indicators: it gives an idea of the trend and its strength. inside this window appears a fat red and green line. This is an additional indicator (T&T triple knot) helping us to see when the asset is losing its momentum. Then it may wise to reduce the iexposure of the original trade. T&T CMF : Chaikin money flow indicates accumulation (green) or distribution (red) volume. On the main chart, we use a channel made of two moving averages to determine the trend. We need a close above the upper one to become bullish. On the opposite, a close below the lowest moving average and we get a bearish signal (red). If a buying trade is already running and then the price comes down between the 2 moving averages, you can accumulate more positions as long as we don't see a close below the lowest moving average. We use also 3 sophisticated moving averages. (small, medium and large red dashes). Even if they their parameters are implemen ted to get a longer perspective, they are conceived to be also short term sensitive. Very often, they are useful as a projected support or resistance. IMPORTANT : our methodology is a mixed approach with results extracted from: trend following models, support -resistance levels, quantitative trend profile based on all index component. Don't be surprised if sometimes, the T&T trend appearing on the chart is different than the one indicated in the table with the ST,MT and LT tre nd and their own reversal levels. Charts are edited from ProRealtime.com Easy reading for the QUALITATIVE RANKING : This spreadsheet gives you a qualitative view of the index components based on technical indicators. On the top, you get the average value obtained from the index components. Just below, for each stocks, you get the difference between the components and the average result obtained with the index components. As usual, we use the green color to light up components beating the index and a red color for the opposite. The scoring is a T&T qualitative tool. It enables us to obtain a notation for each stock. We sort the sample from the best to the worst scoring. On the right of the spread sheet, we can appreciate for several time frame, how each stocks behave compared to the index. For example, If on the longest period a stock has beaten the index and if on the short term it does the opposite, it can be a n opportunity to reduce the exposure on that instrument and if possible to reallocate funds in an instrument improving its short term performance!!! Rough data are coming from Thomson Reuters. Disclaimer : This document has been prepared solely for informational purposes, and is intended only fo use be the designated recipient(s). This information was obtained from sources we believe to be reliable, but its accuracy is not guaranteed. All information is subject to change without notice. This does not constitute a solicitation or offer to buy securities or sell secutities or any other instruments, or a recommandation with respect to any security or instrument mentioned herein. This is not a confirmation of t erms of any transaction. No representations are made herein with respect to availability, pricing or performance. Additional information available on request. This document should only be read by those persons to whom it is addressed and is not intended to be relied upon by any person without subsequent written confirmation of its contents. If you have received this e -mail message in error, please destroy it and delete it from your computer, Any form of reproduction, dissemination, copying, disclosure, modification, distribution and/or publication of this e-maim message is strictly prohibited. huteauth@trendandtiming,com Phone: 33 (0)
Constellation Brands
 1/7 TRADING ALERT Constellation Brands huteauth@trendandtiming,com Phone: 33 (0) 6 11 88 36 11 5-Jan-18 INDEX COMPANY RIC NAME ABSOLUTE TREND Close INDEX S&P 500 INDEX/d COMPANY CONSTELLATION /d d-1 Volat
S&P 500 INDEX/d. % change 5 D. Volat 30 D
 31-Oct-17 INDEX COMPANY SECTOR RIC NAME ABSOLUTE TREND LAST INDEX COMPANY % change Volat 30 D S&P 500 INDEX/d LOCKHEED MARTI/d SCORING RSI daily.spx S&P 500 INDEX/d BULL 2 572,83-0,32 4,5 5,4 61,4 1,8
Eurostoxx 50 future. DAILY review. Reversal* Level TREND. Short Term -1 Month BULL Medium Term - 3 Months BULL 2 720
 1/7 DAILY review Eurostoxx 50 future 27-Jul-16 Eurostoxx 50 future Reversal* Level Short Term -1 Month BULL 2860 Medium Term - 3 Months BULL 2 720 Long Term -10 Months BEAR 3 020 * market on close (cash
Eurostoxx 50 future. DAILY review. Reversal* Level TREND. Short Term -1 Month BEAR Medium Term - 3 Months BEAR 3 100
 1/7 DAILY review Eurostoxx 50 future 1-Jul-16 Eurostoxx 50 future Reversal* Level Short Term -1 Month BEAR 2940-2976 Medium Term - 3 Months BEAR 3 100 Long Term -10 Months BEAR 3 100 * market on close
Eurostoxx 50 future. DAILY review. Reversal* Level TREND. Short Term -1 Month BULL Medium Term - 3 Months BULL 2880
 1/7 DAILY review Eurostoxx 50 future 26-Aug-16 Eurostoxx 50 future Reversal* Level Short Term -1 Month BULL 2950 Medium Term - 3 Months BULL 2880 Long Term -10 Months BEAR 3080 * market on close (cash
Eurostoxx 50 future. DAILY review. Reversal* Level TREND. Short Term -1 Month BEAR Medium Term - 3 Months BULL 2910
 DAILY review Eurostoxx 50 future 1/7 29-Nov-16 Eurostoxx 50 future Reversal* Level Short Term -1 Month BEAR 3060 Medium Term - 3 Months BULL 2910 Long Term -10 Months BEAR 3080-3110 * market on close (cash
Eurostoxx 50 future. DAILY review. Reversal* Level TREND. Short Term -1 Month BULL Medium Term - 3 Months BULL 2880
 1/7 DAILY review Eurostoxx 50 future 25-Aug-16 Eurostoxx 50 future Reversal* Level Short Term -1 Month BULL 2950 Medium Term - 3 Months BULL 2880 Long Term -10 Months BEAR 3080 * market on close (cash
EQUITY-FIXED INCOME CURRENCY-COMMODITY
 1 / 5 04/10/2016 USD ETFs 07/04/2017 Absolute Scoring & Ranking EQUITY-FIXED INCOME CURRENCY-COMMODITY Weekly Review www.trendandtiming.com 2/5 Weekly Report USD ETF EQUITIES EQUITY W-1 11-Aug-17 AVG AVG
S&P 500 INDEX/d DJ CHEMICALS. % change 5 D. Volat 30 D
 9-Nov-17 INDEX SECTOR SECTOR RIC NAME ABSOLUTE TREND LAST INDEX SECTOR % change Volat 30 D S&P 500 INDEX/d DJ CHEMICALS RSI daily.spx S&P 500 INDEX/d 2 584,62-0,38 4,4 5,5 58,3 1,4 4,1 7,8 0,2 1,3 4,7
DAILY review Mini S&P 500 future
 DAILY review Mini S&P 500 future 1/12 7-Sep-17 Mini S&P500 future Reversal* Level DJIA components SCORING VOLUME Daily Outperf. 6,9-16,2% ST 1 month BULL 2415 Daily Underperf. -0,6 3,2% MT 3 months BULL
EQUITY-FIXED INCOME CURRENCY-COMMODITY
 1 / 5 04/10/2016 USD ETFs 07/04/2017 Absolute Scoring & Ranking EQUITY-FIXED INCOME CURRENCY-COMMODITY Weekly Review www.trendandtiming.com 2/5 Weekly Report USD ETF EQUITIES EQUITY W-1 3-Nov-17 AVG AVG
DAILY review Mini S&P 500 future
 1/13 DAILY review Mini S&P 500 future 12-Jun-18 Mini S&P500 future Reversal* Level DJIA components SCORING VOLUME Daily Outperf. 5,7-17,1 ST 1 month BULL 2700 Daily Underperf. 2,9-9,5 MT 3 months BULL
Technical Analysis Workshop Series. Session Six 1, 2, 3 Price-Bars Patterns
 Technical Analysis Workshop Series Session Six 1, 2, 3 Price-Bars Patterns DISCLOSURES & DISCLAIMERS This research material has been prepared by NUS Invest. NUS Invest specifically prohibits the redistribution
Technical Analysis Workshop Series. Session 11 Semester 2 Week 5 Oscillators Part 2
 Technical Analysis Workshop Series Session 11 Semester 2 Week 5 Oscillators Part 2 DISCLOSURES & DISCLAIMERS This research material has been prepared by NUS Invest. NUS Invest specifically prohibits the
Adding longs in the SPX zone will be well-rewarded longer term we believe.
 Executive Summary Last week we found, based on our analyses of the charts: Our SPX2146-2069 target zone remains and can now be narrowed down to SPX2117-2069, as the S&P500 closed at SPX2128 yesterday,
Intelligent Investing, LLC Major Indices Daily Update 02/26/ 19
 Elliot Wave Updates Yesterday I found a move below last Friday s high (SPX2794.20) will be a first sign of lower prices as then the decline can t be a 4 th wave because 4 th and 1 st waves can t overlap
Icoachtrader Consulting Service WELCOME TO. Trading Boot Camp. Day 5
 Icoachtrader Consulting Service www.icoachtrader.weebly.com WELCOME TO Trading Boot Camp Day 5 David Ha Ngo Trading Coach Phone: 1.650.899.1088 Email: icoachtrader@gmail.com The information presented is
Chapter 2.3. Technical Indicators
 1 Chapter 2.3 Technical Indicators 0 TECHNICAL ANALYSIS: TECHNICAL INDICATORS Charts always have a story to tell. However, sometimes those charts may be speaking a language you do not understand and you
Martin Pring s. Weekly InfoMovie Report. April 8, 2014
 Martin Pring s Weekly InfoMovie Report April 8, 2014 Issue 1093 Weekly InfoMovie Report 1 Key level remains $184 on the SPY. US Equity Market - Last time I pointed out that the $184 level on the S&P ETF
McDowell s Special Market Report Using the TradersCoach.com Software Tools
 McDowell s Special Market Report Using the TradersCoach.com Software Tools JULY 2018: Welcome to this month s Market Report! This written report is going to forecast the Dow Jones Industrial Average (hereafter
Chapter 2.3. Technical Analysis: Technical Indicators
 Chapter 2.3 Technical Analysis: Technical Indicators 0 TECHNICAL ANALYSIS: TECHNICAL INDICATORS Charts always have a story to tell. However, from time to time those charts may be speaking a language you
The S&P500 is still allowed to tag SPX and then roll over, as it would fit with a c=a relationship on the COMPQ to $6226.
 Yesterday I showed the different possibilities the market has, and since there s not been a >10p move to the opposite direction since the SPX2446.55 low and SPX 2469.64 higher were struck (today s decline
GETTING STARTED WITH THE SECTOR TIMING REPORT
 Quick start guide to report GETTING STARTED WITH THE SECTOR TIMING REPORT 1. 2. 3. 4. 5. 6. 7. CONSULT WITH FINANCIAL ADVISOR A financial advisor can establish a financial plan and investment guidelines
Trailing PE 7.8. Forward PE 9.3. Hold 10 Analysts. 1-Year Return: -16.2% 5-Year Return: -17.5%
 ARTIS REAL ESTATE INVESTMENT (-T) Last Close 11.46 (CAD) Avg Daily Vol 448,027 52-Week High 14.42 Trailing PE 7.8 Annual Div 1.08 ROE 10.5% LTG Forecast -- 1-Mo -6.5% October 12 TORONTO Exchange Market
Notices and Disclaimer
 Part 2 March 14, 2013 Saul Seinberg Notices and Disclaimer } This is a copyrighted presentation. It may not be copied or used in whole or in part for any purpose without prior written consent from the
Technical Analysis. Dealing Room Peter Leonidou. Peter Leonidou
 Technical Analysis Dealing Room Questions Traders Should Ask What is the trend? What is the pivot point? What is the support levels? What is the resistance levels? Strong or weaker USD? What 1. Trade
Candlesticks Discoveries Probability of Success Aug 6, 2016
 Candlesticks Discoveries Probability of Success Aug 6, 2016 The Art & Science of Active Trend Trading Disclaimer U.S. Government Required Disclaimer Commodity Futures Trading Commission Futures and Options
The Launchpad Strategy
 presented by Thomas Wood MicroQuant SM Divergence Trading Workshop Day One The Launchpad Strategy Risk Disclaimer Trading or investing carries a high level of risk, and is not suitable for all persons.
NIFTY. Momentum oscillator, RSI (14) is in bullish crossover which suggests index momentum to remain on the positive side.
 is in bullish crossover which suggests index momentum to remain on the positive side.") Date: 16 th July 2018 NIFTY The Nifty, which reversed its downwards trend in the previous week has continued rallying during the last week. Moreover, the Index has given a trend-line breakout on the weekly
Date: 16 th July 2018 NIFTY The Nifty, which reversed its downwards trend in the previous week has continued rallying during the last week. Moreover, the Index has given a trend-line breakout on the weekly
Trailing PE 9.2. Forward PE 8.5. Hold 15 Analysts. 1-Year Return: -10.8% 5-Year Return: 20.4%
 CADIAN IMPERIAL BANK (-T) Last Close 107.09 (CAD) Avg Daily Vol 1.9M 52-Week High 125.21 Trailing PE 9.2 Annual Div 5.44 ROE 17.0% LTG Forecast 4.8% 1-Mo -6.5% December 13 TORONTO Exchange Market Cap 47.6B
BUY SELL PRO. Improve Profitability & Reduce Risk with BUY SELL Pro. Ultimate BUY SELL Indicator for All Time Frames
 BUY SELL PRO Improve Profitability & Reduce Risk with BUY SELL Pro Ultimate BUY SELL Indicator for All Time Frames Risk Disclosure DISCLAIMER: Crypto, futures, stocks and options trading involves substantial
Trailing PE Forward PE Buy 13 Analysts. 1-Year Return: -10.6% 5-Year Return: -9.1%
 INTER PIPELINE (-T) Last Close 22.95 (CAD) Avg Daily Vol 1.1M 52-Week High 27.91 Trailing PE 15.6 Annual Div 1.68 ROE 16.3% LTG Forecast 1.3% 1-Mo -4.3% October 02 TORONTO Exchange Market Cap 8.7B 52-Week
Using Oscillators & Indicators Properly May 7, Clarify, Simplify & Multiply
 Using Oscillators & Indicators Properly May 7, 2016 Clarify, Simplify & Multiply Disclaimer U.S. Government Required Disclaimer Commodity Futures Trading Commission Futures and Options trading has large
RISK DISCLOSURE STATEMENT / DISCLAIMER AGREEMENT
 RISK DISCLOSURE STATEMENT / DISCLAIMER AGREEMENT Trading any financial market involves risk. This report and all and any of its contents are neither a solicitation nor an offer to Buy/Sell any financial
TD AMERITRADE Technical Analysis Night School Week 2
 TD AMERITRADE Technical Analysis Night School Week 2 Hosted By Derek Moore Director, National Education For the audio portion of today s webcast, please enable your computer speakers. Past performance
PART 3 - CHART PATTERNS & TECHNICAL INDICATORS
 Tyler Chianelli s EASYOPTIONTRADING by OPTION TRADING COACH PART 3 - CHART PATTERNS & TECHNICAL INDICATORS A SIMPLE SYSTEM FOR TRADING OPTIONS WORKS IN UP, DOWN, AND SIDEWAYS MARKETS PART 3.1 - PRIMARY
Technical Analysis Workshop Series. Session Ten Semester 2 Week 4 Oscillators Part 1
 Technical Analysis Workshop Series Session Ten Semester 2 Week 4 Oscillators Part 1 DISCLOSURES & DISCLAIMERS This research material has been prepared by NUS Invest. NUS Invest specifically prohibits the
52-Week High Trailing PE Week Low Forward PE Buy 15 Analysts. 1-Year Return: 26.7% 5-Year Return: -1.
 MANULIFE FINANCIAL (-T) Last Close 21.74 (CAD) Avg Daily Vol 3.8M 52-Week High 22.73 Trailing PE 10.2 Annual Div 0.62 ROE 16.3% LTG Forecast 11.1% 1-Mo -2.0% September 24, TORONTO Exchange Market Cap (Consol)
Trailing PE Forward PE Buy 16 Analysts. 1-Year Return: 21.5% 5-Year Return: -64.5%
 BONTERRA ENERGY CORP (-T) Last Close 19.70 (CAD) Avg Daily Vol 92,379 52-Week High 20.29 Trailing PE 57.9 Annual Div 1.20 ROE 2.2% LTG Forecast -- 1-Mo 2.2% October 03 TORONTO Exchange Market Cap 640M
RISK DISCLOSURE STATEMENT / DISCLAIMER AGREEMENT
 RISK DISCLOSURE STATEMENT / DISCLAIMER AGREEMENT Trading any financial market involves risk. This report and all and any of its contents are neither a solicitation nor an offer to Buy/Sell any financial
1 P a g e. Executive Summary
 Executive Summary Over the past week we re-introduced some alternative counts, all of which bullish and some simple more bullish than others. The market keeps tracking them well; and we still can t eliminate
IVolatility.com E G A R O N E S e r v i c e
 IVolatility.com E G A R O N E S e r v i c e Stock Sentiment Service User Guide The Stock Sentiment service is a tool equally useful for both stock and options traders as it provides you stock trend analysis
Different Classes Of Divergence
 Russ Horn Presents Different Classes Of Divergence RISK DISCLOSURE STATEMENT / DISCLAIMER AGREEMENT Trading any financial market involves risk. This report and all and any of its contents are neither a
Forex Sentiment Report Q2 FORECAST WEAK AS LONG AS BELOW April
 Forex Sentiment Report 08 April 2015 www.ads-securities.com Q2 FORECAST WEAK AS LONG AS BELOW 1.1200 Targets on a break of 1.1534/35: 1.1740/50 1.1870/75 1.2230/35 Targets on a break of 1.0580/70: 1.0160
1 P a g e. Executive Summary
 Executive Summary Last week I was looking for SPX2455-2475 and the S&P500 gave us SPX2454 on Monday and then started to pullback and consolidate causing for many pundits to already start top calling. Close
Intra-Day Trading Techniques
 Pristine.com Presents Intra-Day Trading Techniques With Greg Capra Co-Founder of Pristine.com, and Co-Author of the best selling book, Tools and Tactics for the Master Day Trader Copyright 2001, Pristine
CHAPTER V TIME SERIES IN DATA MINING
 CHAPTER V TIME SERIES IN DATA MINING 5.1 INTRODUCTION The Time series data mining (TSDM) framework is fundamental contribution to the fields of time series analysis and data mining in the recent past.
Understanding Oscillators & Indicators March 4, Clarify, Simplify & Multiply
 Understanding Oscillators & Indicators March 4, 2015 Clarify, Simplify & Multiply Disclaimer U.S. Government Required Disclaimer Commodity Futures Trading Commission Futures and Options trading has large
Technical analysis & Charting The Foundation of technical analysis is the Chart.
 Technical analysis & Charting The Foundation of technical analysis is the Chart. Charts Mainly there are 2 types of charts 1. Line Chart 2. Candlestick Chart Line charts A chart shown below is the Line
Introduction. Leading and Lagging Indicators
 1/12/2013 Introduction to Technical Indicators By Stephen, Research Analyst NUS Students Investment Society NATIONAL UNIVERSITY OF SINGAPORE Introduction Technical analysis comprises two main categories:
Trailing PE 8.9. Forward PE 8.0. Hold 7 Analysts. 1-Year Return: -17.0% 5-Year Return: -13.9%
 ER CORPORATION OF CANADA (-T) Last Close 27.12 (CAD) Avg Daily Vol 905,847 52-Week High 33.21 Trailing PE 8.9 Annual Div 1.53 ROE 9.9% LTG Forecast 6.3% 1-Mo 0.9% November 15 TORONTO Exchange Market Cap
ICHIMOKU KINKO HYO GUIDELINE
 ICHIMOKU KINKO HYO GUIDELINE This is a complex system made by 5 indicators: 1. Tenkan Sen, LIME in my chart, shows the average price value during the first time interval defined as the sum of maximum and
Trailing PE Forward PE Buy 13 Analysts. 1-Year Return: 5.0% 5-Year Return: 115.5%
 ALGONQUIN POWER & UTILITIES (-T) Last Close 13.75 (CAD) Avg Daily Vol 950,518 52-Week High 14.40 Trailing PE 25.9 Annual Div 0.67 ROE 7.0% LTG Forecast 6.1% 1-Mo 3.3% September 21 TORONTO Exchange Market
Fundametrics Small Cap Equity Q Performance Summary and Observations
 For more on CornerCap s institutional capabilities and past commentaries, click HERE Fundametrics Small Cap Equity Q4 2016 Performance Summary and Observations 4Q 2016 Latest 1 Year Latest 3 Years Latest
52-Week High Trailing PE Week Low Forward PE Hold 14 Analysts. 1-Year Return: 8.7% 5-Year Return: 43.
 CADIAN IMPERIAL BANK (-T) Last Close 114.56 (CAD) Avg Daily Vol 868,326 52-Week High 120.83 Trailing PE 10.4 Annual Div 5.20 ROE 18.0% LTG Forecast 4.6% 1-Mo 1.7% November 23 TORONTO Exchange Market Cap
The Technical Edge Page 1. The Technical Edge. Part 1. Indicator types: price, volume, and moving averages and momentum
 The Technical Edge Page 1 The Technical Edge INDICATORS Technical analysis relies on the study of a range of indicators. These come in many specific types, based on calculations or price patterns. For
Economic Risk Factor Update: July 2017
 Economic Risk Factor Update: July 2017 July 12, 2017 by Brad McMillan of Commonwealth Financial Network The data for June was generally positive, with a rebound in job growth and a surprise increase in
Trailing PE 5.3. Forward PE 7.0. Hold 6 Analysts. 1-Year Return: -52.1% 5-Year Return: -68.3%
 HIGH LINER FOODS INC (-T) Last Close 6.75 (CAD) Avg Daily Vol 83,237 52-Week High 15.67 Trailing PE 5.3 Annual Div 0.58 ROE 12.1% LTG Forecast -- 1-Mo 6.3% December 13 TORONTO Exchange Market Cap 228M
1 P a g e. Executive Summary
 Executive Summary We can keep the executive summary very simple, and repeat what we said last week: A break below SPX2405 is now needed to put the Bull-count in jeopardy. Until then we have to look up,
Technical Analysis Workshop Series. Session Three
 Technical Analysis Workshop Series Session Three DISCLOSURES & DISCLAIMERS This research material has been prepared by NUS Invest. NUS Invest specifically prohibits the redistribution of this material
We find good Fib-extension overlap at that level between the major and minor wave degrees suggesting it should work as a magnet for price.
 Executive Summary Last week we forecasted an ideal minute iii top at SPX2174-2188, followed by a drop to SPX2250-2235 (likely the high end of the range) for minute iv before the market continues to melt
Tradespoon MetaStock Add-on
 Tradespoon MetaStock Add-on An institutional-grade tool for the self-directed trader Overview MetaStock delivers powerful tools, powerful trades, and proprietary scanning, endless customization, comprehensive
Trailing PE -- Forward PE -- NA 0 Analysts. 1-Year Return: 424.7% 5-Year Return: 415.2%
 DIVIDEND 15 SPLIT CORP (-T) Last Close 10.23 (CAD) Avg Daily Vol 41,738 52-Week High 10.32 Trailing PE Annual Div 1.20 ROE LTG Forecast 1-Mo 0.1% 2018 August 17 TORONTO Exchange Market Cap 460M 52-Week
Trailing PE 7.5. Forward PE 9.6. Hold 7 Analysts. 1-Year Return: -15.4% 5-Year Return: -52.0%
 AGF MANAGEMENT (-T) Last Close 6.30 (C) Avg Daily Vol 59,659 52-Week High 8.47 Trailing PE 7.5 Annual Div 0.32 ROE 7.2% LTG Forecast 8.7% 1-Mo -3.5% August 21 TORONTO Exchange Market Cap 507M 52-Week Low
Trailing PE 5.4. Forward PE Buy 18 Analysts. 1-Year Return: -42.0% 5-Year Return: -31.8%
 HUDBAY MINERALS INC (-T) Last Close 5.67 (CAD) Avg Daily Vol 1.8M 52-Week High 12.65 Trailing PE 5.4 Annual Div 0.02 ROE 10.3% LTG Forecast -13.7% 1-Mo -12.4% October 19 TORONTO Exchange Market Cap 1.5B
TDP-Academy Trading SetupGuide
 TDP-Academy Trading SetupGuide Version 1.1. March 2017 Author: Boris Nikolajew & Wiktor Majorkiewicz INDEX 1. Foreword 2. Charts 3. Timeframes 4. Indicators 5. Drawings 6. Chartpatterns 7. Analyzing the
Point and Figure Charting
 Technical Analysis http://spreadsheetml.com/chart/pointandfigure.shtml Copyright (c) 2009-2018, ConnectCode All Rights Reserved. ConnectCode accepts no responsibility for any adverse affect that may result
Trailing PE Forward PE Hold 18 Analysts. 1-Year Return: 28.7% 5-Year Return: 63.9%
 VENTAS INC (-N) Last Close 71.91 (USD) Avg Daily Vol 2.8M 52-Week High 76.80 Trailing PE 55.3 Annual Div 2.92 ROE 4.3% LTG Forecast -- 1-Mo -2.3% September 29, 2016 NEW YORK Exchange Market Cap 25.4B 52-Week
Table of Contents. Risk Disclosure. Things we will be going over. 2 Most Common Chart Layouts Anatomy of a candlestick.
 Table of Contents Risk Disclosure Things we will be going over 2 Most Common Chart Layouts Anatomy of a candlestick Candlestick chart Anatomy of a BAR PLOT Indicators Trend-Lines Volume MACD RSI The Stochastic
Trailing PE Forward PE Buy 10 Analysts. 1-Year Return: -5.1% 5-Year Return: 3328%
 Last Close 13.71 (CAD) Avg Daily Vol 9.0M 52-Week High 22.00 Trailing PE 41.6 Annual Div -- ROE 7.7% LTG Forecast -- 1-Mo 38.2% 2019 February 21 TORONTO Exchange Market Cap 3.2B 52-Week Low 4.76 Forward
Trailing PE Forward PE Buy 14 Analysts. 1-Year Return: 17.8% 5-Year Return: --
 Last Close 1.52 (CAD) Avg Daily Vol 687,694 52-Week High 1.57 Trailing PE 25.3 Annual Div 0.04 ROE 4.5% LTG Forecast -- 1-Mo 11.8% 2019 April 23 TORONTO Exchange Market Cap 510M 52-Week Low 1.20 Forward
Binary Options Trading Strategies How to Become a Successful Trader?
 Binary Options Trading Strategies or How to Become a Successful Trader? Brought to You by: 1. Successful Binary Options Trading Strategy Successful binary options traders approach the market with three
Trailing PE -- Forward PE -- Buy 6 Analysts. 1-Year Return: -34.7% 5-Year Return: -71.6%
 BSM TECHNOLOGIES INC (-T) Last Close 0.81 (CAD) Avg Daily Vol 39,289 52-Week High 1.45 Trailing PE -- Annual Div -- ROE -2.7% LTG Forecast -- 1-Mo -15.6% November 22 TORONTO Exchange Market Cap 70M 52-Week
Trailing PE Forward PE Buy 3 Analysts. 1-Year Return: -35.3% 5-Year Return: 339.3%
 TON CONTROL INC (-T) Last Close 1.34 (CAD) Avg Daily Vol 169,152 52-Week High 2.60 Trailing PE 16.8 Annual Div -- ROE 21.7% LTG Forecast -- 1-Mo 55.8% 2019 January 25 TORONTO Exchange Market Cap 147M 52-Week
Introduction. Technical analysis is the attempt to forecast stock prices on the basis of market-derived data.
 Technical Analysis Introduction Technical analysis is the attempt to forecast stock prices on the basis of market-derived data. Technicians (also known as quantitative analysts or chartists) usually look
- My 4 Favorite Trades - Essential Trades of a Professional Trader
 presented by Thomas Wood MicroQuant SM Divergence Trading Workshop Day One - My 4 Favorite Trades - Essential Trades of a Professional Trader Risk Disclaimer Trading or investing carries a high level of
Trailing PE Forward PE Hold 6 Analysts. 1-Year Return: 3.5% 5-Year Return: 21.4%
 Last Close 11.73 (CAD) Avg Daily Vol 961,084 52-Week High 11.84 Trailing PE 25.3 Annual Div 0.80 ROE 6.9% LTG Forecast -- 1-Mo 8.4% 2019 March 26 TORONTO Exchange Market Cap 1.4B 52-Week Low 9.27 Forward
1 P a g e. Executive Summary
 Executive Summary For three weeks we provided a primary (major b) and alternative count (primary V) up and we keep tracking both until one or the other is disproven. Two weeks ago we projected a major
CMS Prime DAILY MARKET REPORT
 CMS Prime DAILY MARKET REPORT May 14, 2018 EURUSD BULLISH BIAS long position at 1.1960 with SL : 1.1925 and with targets at 1.1990 and 1.2020 short position at 1.1925 with SL : 1.1970 and with targets
An Introduction to Candlesticks for Options Using Nison Candlesticks as the Foundation to your option trading
 Using Nison Candlesticks as the Foundation to your option trading, CMT President: Candlecharts.com Candlestick Benefits Easy to Understand Early Reversals Safety First East + West All markets All Time
Trailing PE Forward PE Buy 11 Analysts. 1-Year Return: 3.0% 5-Year Return: -19.7%
 ENCANA CORP (-T) Last Close 14.70 (CAD) Avg Daily Vol 3.3M 52-Week High 18.54 Trailing PE 188.1 Annual Div 0.08 ROE 0.7% LTG Forecast 36.4% 1-Mo -7.8% October 12 TORONTO Exchange Market Cap 14.0B 52-Week
52-Week High Trailing PE Week Low Forward PE Buy 16 Analysts. 1-Year Return: -14.9% 5-Year Return: 15.
 RIDGE INC (-T) Last Close 49.14 (CAD) Avg Daily Vol 3.3M 52-Week High 58.28 Trailing PE 25.1 Annual Div 2.68 ROE 9.5% LTG Forecast 6.7% 1-Mo 4.5% December 22 TORONTO Exchange Market Cap (Consol) 89.7B
Subject: Daily report explanatory notes, page 2 Version: 0.9 Date: Dec 29, 2013 Author: Ken Long
 Subject: Daily report explanatory notes, page 2 Version: 0.9 Date: Dec 29, 2013 Author: Ken Long Description Example from Dec 23, 2013 1. Market Classification: o Shows market condition in one of 9 conditions,
Trailing PE Forward PE Buy 6 Analysts. 1-Year Return: -13.9% 5-Year Return: 10.8%
 INTERTAPE POLYMER GROUP INC (-T) Last Close 16.75 (CAD) Avg Daily Vol 217,272 52-Week High 22.84 Trailing PE 11.3 Annual Div 0.73 ROE 26.6% LTG Forecast -- 1-Mo -12.6% October 29 TORONTO Exchange Market
Trailing PE -- Forward PE -- Buy 1 Analyst. 1-Year Return: -40.2% 5-Year Return: -93.3%
 Last Close 1.10 (CAD) Avg Daily Vol 39,637 52-Week High 2.42 Trailing PE Annual Div 1.43 ROE -39.1% LTG Forecast 1-Mo -20.9% 2019 April 01 TORONTO Exchange Market Cap 67M 52-Week Low 1.01 Forward PE Dividend
Last week's rating: C Marketperform Percentile Ranking: 60 Data as of 10/12/2018
 SCHWAB EQUITY RATING Percentile Ranking: 61 Data as of 10/19/ A 1-10 Strongly Outperform BUY B 11-30 Outperform C 31-70 Marketperform D 71-90 Underperform BUY HOLD SELL F 91- Strongly Underperform SELL
1 P a g e. Executive Summary
 Executive Summary Our standard sub division (SSD) Elliot Wave count for the S&P500 continues to track the market well, and we ll keep it as is until the market will tell us different. We continue to expect
Trailing PE -- Forward PE -- Hold 13 Analysts. 1-Year Return: -7.6% 5-Year Return: -89.4%
 OBSIDIAN ENERGY (-T) Last Close 1.21 (CAD) Avg Daily Vol 202,689 52-Week High 1.85 Trailing PE -- Annual Div -- ROE -12.3% LTG Forecast -- 1-Mo -6.2% October 04 TORONTO Exchange Market Cap 614M 52-Week
Morning Trading Comments
 Thursday, May 24, 2018 1 Morning Trading Comments SUMMARY OF TRADING VIEWS After two months of ultra-low intraday volatility, core European stockmarket indices corrected sharply yesterday with the overstretched
Trailing PE 7.1. Forward PE 8.5. Hold 7 Analysts. 1-Year Return: 30.2% 5-Year Return: 70.0%
 GENWORTH MI CANADA INC (-T) Last Close 42.30 (CAD) Avg Daily Vol 147,614 52-Week High 44.49 Trailing PE 7.1 Annual Div 1.88 ROE 14.2% LTG Forecast -- 1-Mo 4.2% 2018 June 15 TORONTO Exchange Market Cap
52-Week High Trailing PE Week Low Forward PE Buy 17 Analysts. 1-Year Return: 33.6% 5-Year Return: 36.
 THOMSON REUTERS CORP (-T) Report Date: October 22, Last Close 54.60 (CAD) Avg Daily Vol 1.1M 52-Week High 55.28 Trailing PE 17.2 Annual Div 1.34 ROE 13.4% LTG Forecast 11.0% 1-Mo 1.6% October 21, TORONTO
Trailing PE 4.0. Forward PE Buy 26 Analysts. 1-Year Return: -16.6% 5-Year Return: -60.3%
 CENOVUS ENERGY INC (-T) Last Close 12.08 (CAD) Avg Daily Vol 4.2M 52-Week High 14.84 Trailing PE 4.0 Annual Div 0.20-3.8% LTG Forecast -22.3% 1-Mo -7.5% November 08 TORONTO Exchange Market Cap 14.1B 52-Week
The Carlucci Indicator
 Third Party Research July 1, 2016 The Carlucci Indicator eresearch Corporation is pleased to provide a weekly chart and table of The Carlucci Indicator, which is billed as the Best Stock Market Indicator
Trailing PE Forward PE Buy 7 Analysts. 1-Year Return: 5.1% 5-Year Return: 99.8%
 OPEN TEXT CORP (-T) Last Close 44.09 (CAD) Avg Daily Vol 697,695 52-Week High 51.98 Trailing PE 37.1 Annual Div 0.81 ROE 6.7% LTG Forecast 11.4% 1-Mo -2.0% November 22 TORONTO Exchange Market Cap 11.7B
Research Analysts
 Stocks on the move Scrip IDi I-Direct tcode Action Target Stoploss Sterlite Technologies STETEC Buy in the range of 100.00-102.00 118.00 91.50 Time Frame: 3 Months Research Analysts Dharmesh Shah Pabitro
Strong Buy 2 Analysts
 Last Close 0.36 (CAD) Avg Daily Vol 173,853 52-Week High 0.46 Trailing PE -- Annual Div -- ROE -21.8% LTG Forecast -- 1-Mo 5.9% 2019 April 08 TSX VENTURE Exchange Market Cap 124M 52-Week Low 0.13 Forward
52-Week High Trailing PE Week Low Forward PE Hold 17 Analysts. 1-Year Return: 54.6% 5-Year Return: 104.
 Last Close 78.37 (CAD) Avg Daily Vol 514,211 52-Week High 79.72 Trailing PE 8.4 Annual Div 1.92 ROE 35.7% LTG Forecast 39.4% 1-Mo 8.6% 2019 April 08 TORONTO Exchange Market Cap (Consol) 39.3B 52-Week Low
Trailing PE Forward PE Hold 11 Analysts. 1-Year Return: -1.1% 5-Year Return: 31.1%
 RIDGE INCOME FUND HOLDINGS (-T) Last Close 32.01 (CAD) Avg Daily Vol 725,761 52-Week High 33.05 Trailing PE 58.2 Annual Div 2.26 ROE 1.3% LTG Forecast 4.8% 1-Mo 7.7% July 18 TORONTO Exchange Market Cap
In the weekend update I presented 3 different counts for the S&P in order of probability
 In the weekend update I presented 3 different counts for the S&P in order of probability 1) micro-1 ongoing with nano-iv at SPX2578 and nano-v to SPX2595 underway (60%). 2) Micro-2 topped at SPX2590, micro-c
Date: 10 th Sep 2018 NIFTY
 Date: 10 th Sep 2018 NIFTY Indian market managed to close on positive note after it seen some selling pressure at the start of week on the back of rupee depreciation, higher crude prices and worries over