EMINI We will start promptly at 8 PM Eastern
|
|
|
- Grant Neal Gray
- 5 years ago
- Views:
Transcription

1 EASYEMINITRADE.COM EMINI We will start promptly at 8 PM Eastern

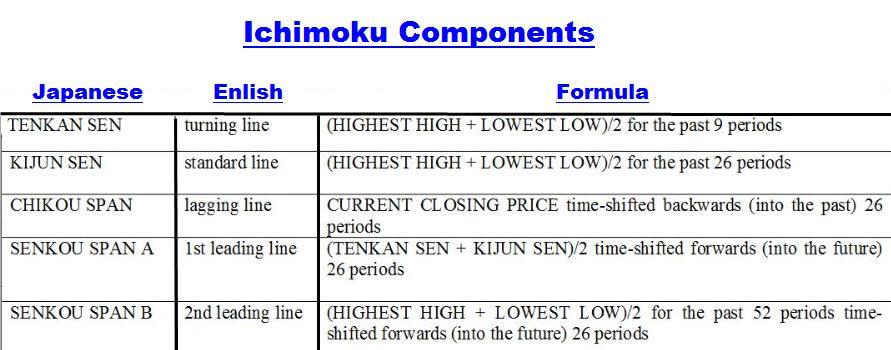
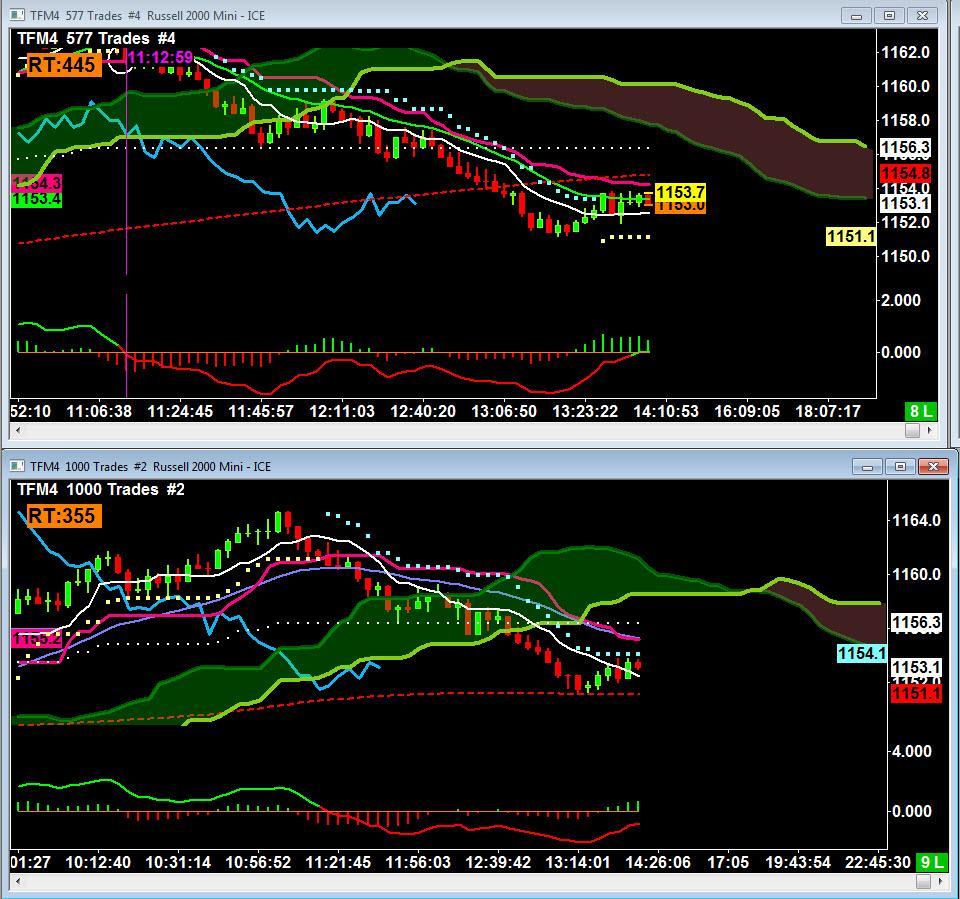
2 EASY EMINI TRADE Ichimoku Kinko Hyo Equilibrium Chart At A Glance Using Multiple Time Frames For Your Analysis
3
4
5
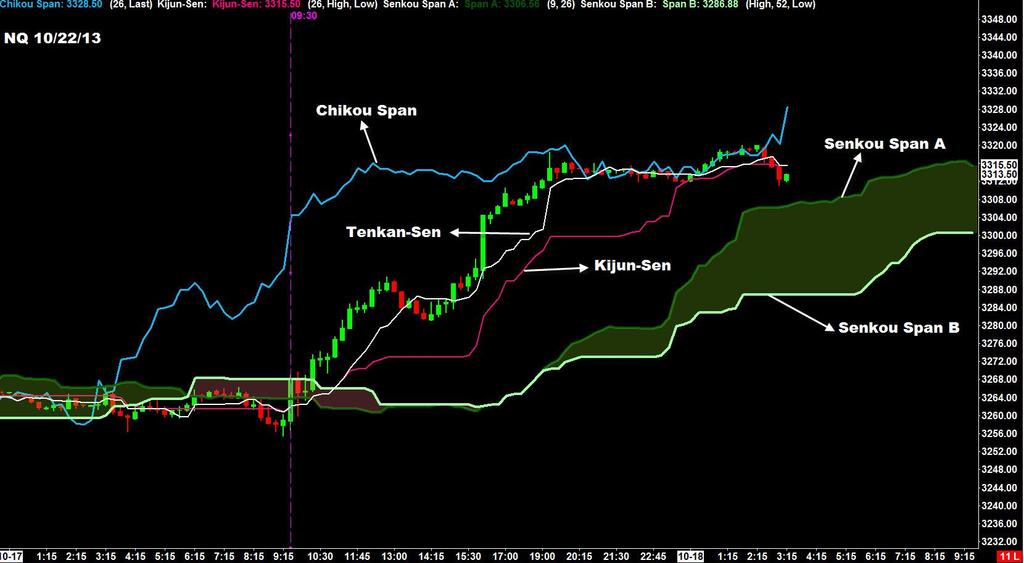
6 Basic Understanding Of Direction Kumo (cloud) price above bullish/below bearish. The cloud is made up of 2 components; Senkou Span A and Senkou Span B. (Senkou Span A above B bullish/senkou B above A bearish) Tenkan line above Kijun line bullish/ below bearish Kijun line price crosses up through Kijun and is above the cloud bullish/price crosses down through Kijun and is below the cloud bearish Chikou line Above the cloud and above price bullish/below the cloud and below price bearish There are strong, neutral and weak signals with each of these indicators mentioned above. Anything that occurs within the cloud is Neutral.
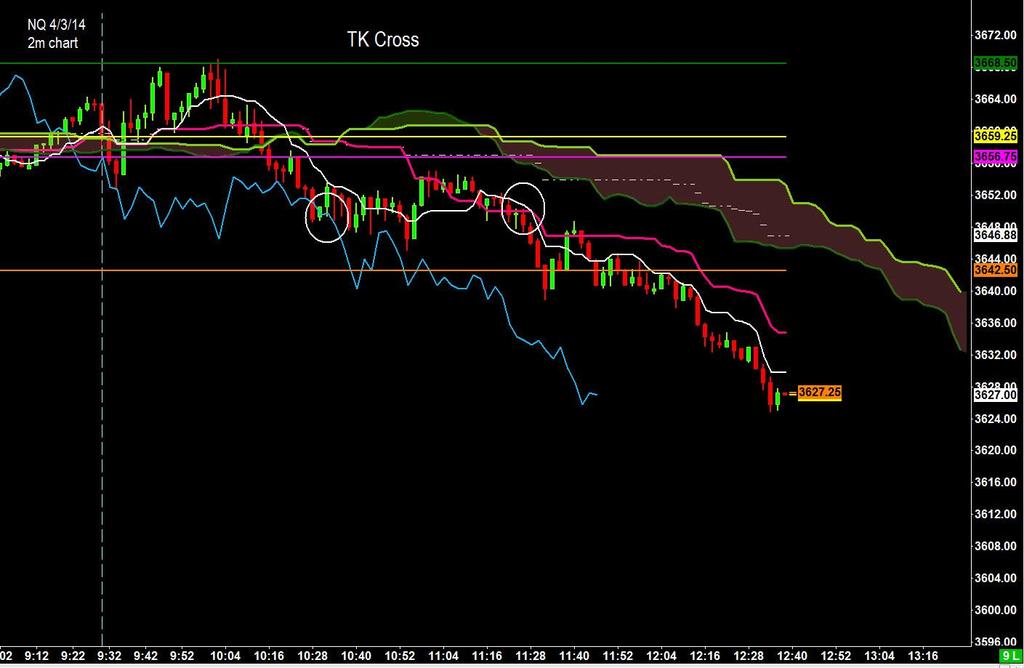
7 Tenken Sen Kijun Sen Cross (TK Cross) Strong buy when the Tenken crosses above the Kijun and you are above the cloud Strong sell when the Tenken crosses below the Kijun and you are below the cloud Neutral When the cross happens inside the cloud Weak buy when Tenken crosses above the Kijun but price is below the cloud Weak sell when Tenken crosses below the Kijun but price is above the cloud * Chikou If Chikou line is above price and you are taking a buy or Chikou is below price and you are taking a short helps strengthen the signal
8
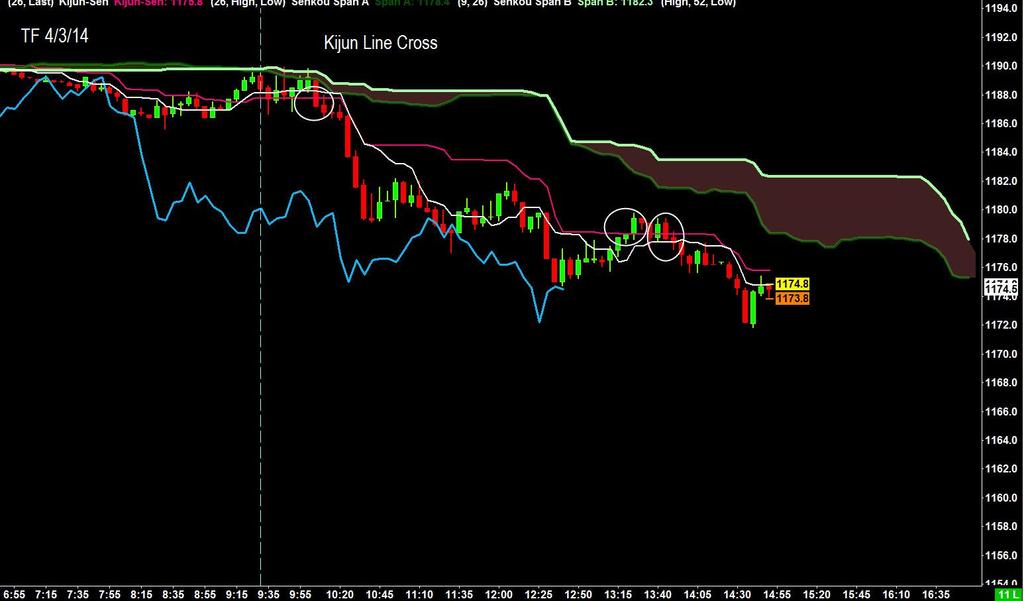
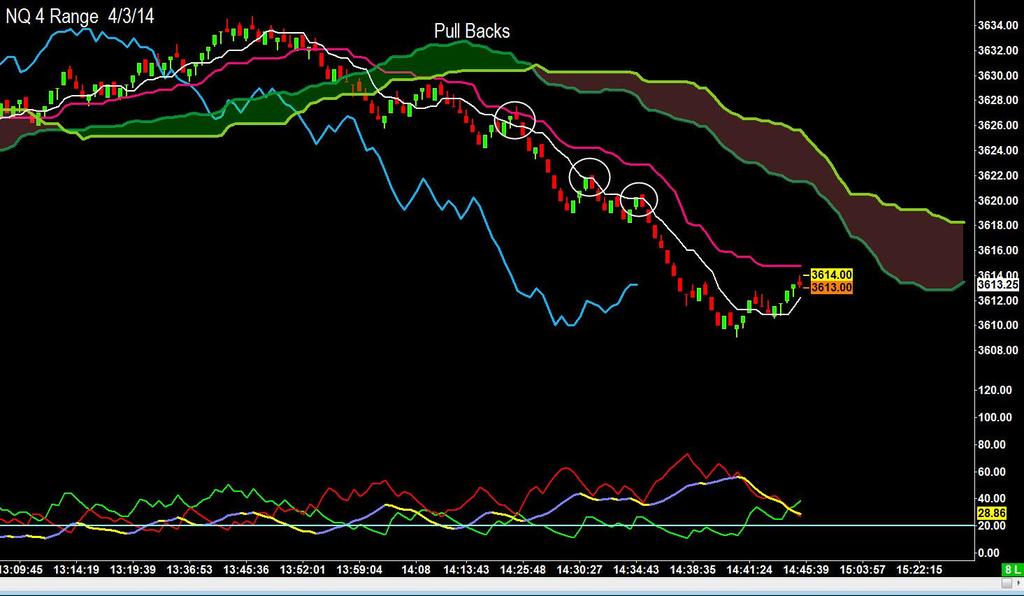
9 Kijun Cross Price crosses above the Kijun Line This is a buy signal Price crosses below the Kijun Line This is a sell signal Strong Price crosses above the Kijun Line and price is above the cloud Price crosses below the Kijun Line and price is below the cloud Neutral In the cloud when price crosses Weak Price crosses above the Kijun Line and price is below the cloud Price crosses below the Kijun Line and price is above the cloud As previously mentioned the Chikou will add strength to this by being above price for buys / below price for sells. I would suggest when taking any entry being on the correct side of the Kijun
10
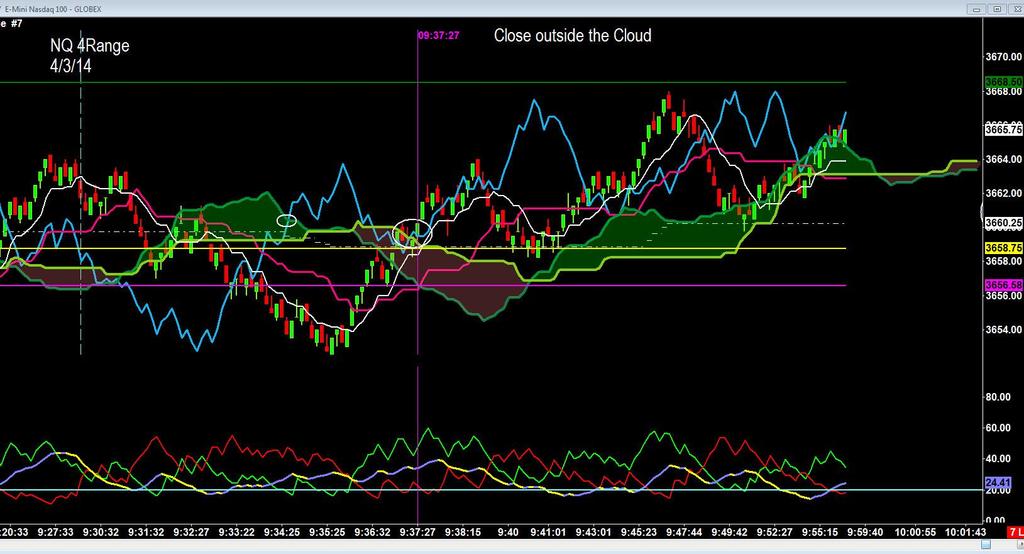
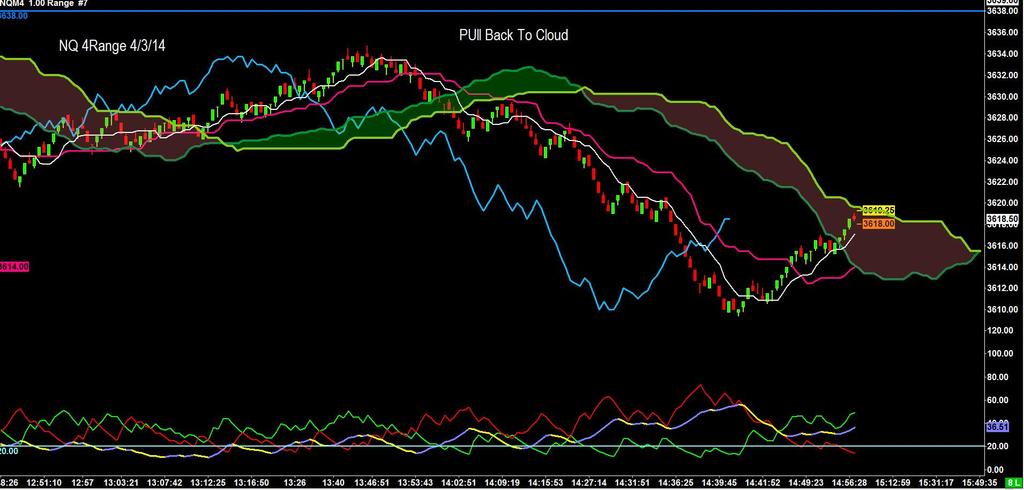
11 Kumo (Cloud) Break out/break Down Price closes outside the top of the cloud this is a buy Price closes outside the bottom of the cloud this is a sell Using the Chikou Line here If Chikou line is also breaking the cloud or already out it adds strength to the set up Flat tops or bottoms on the cloud are more likely to hold as support or resistance If the cloud is very skinny pass on this set up this is telling you the market is sideways. You could still take the trade but I would make sure you know where support and resistance are and be sure you have room to be profitable before hitting those areas. Kumo Twist I don t use it
12
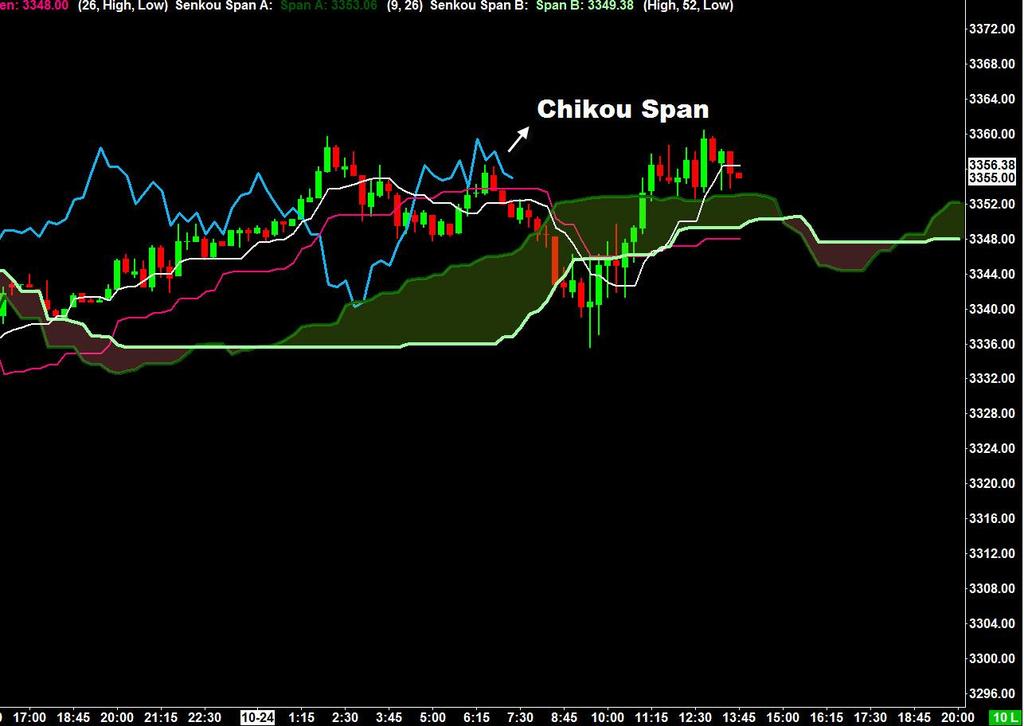
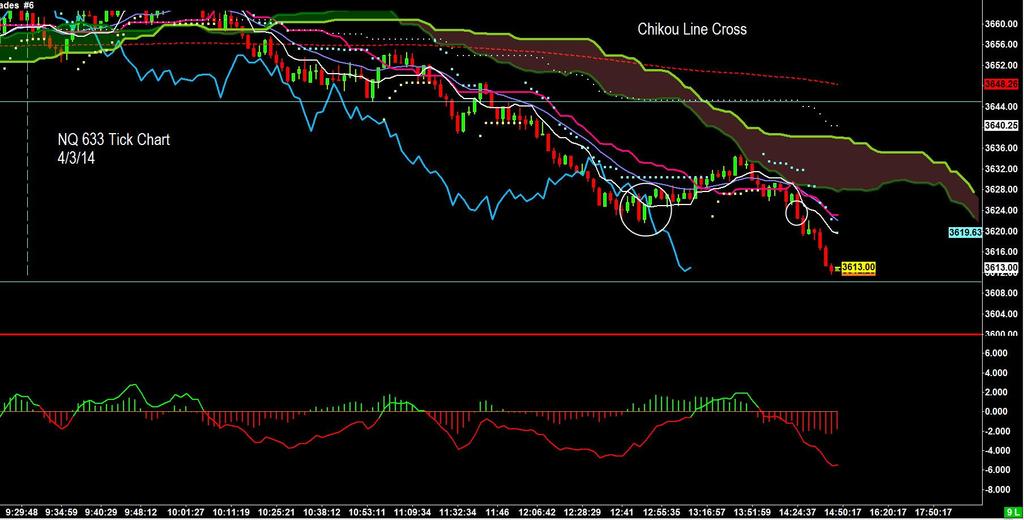
13 Chikou Line Cross Chikou line passes through and above price /Chikou line passes through and below price Using it like this is mainly for confirmation in my opinion Any buy you take and Chikou Line is above price / sell and Chikou Line is below price give you added confirmation As with the other set ups Strong signal buy above the cloud short below Neutral In the cloud Weak Buy and price is below the cloud / sell and price is above the cloud
14
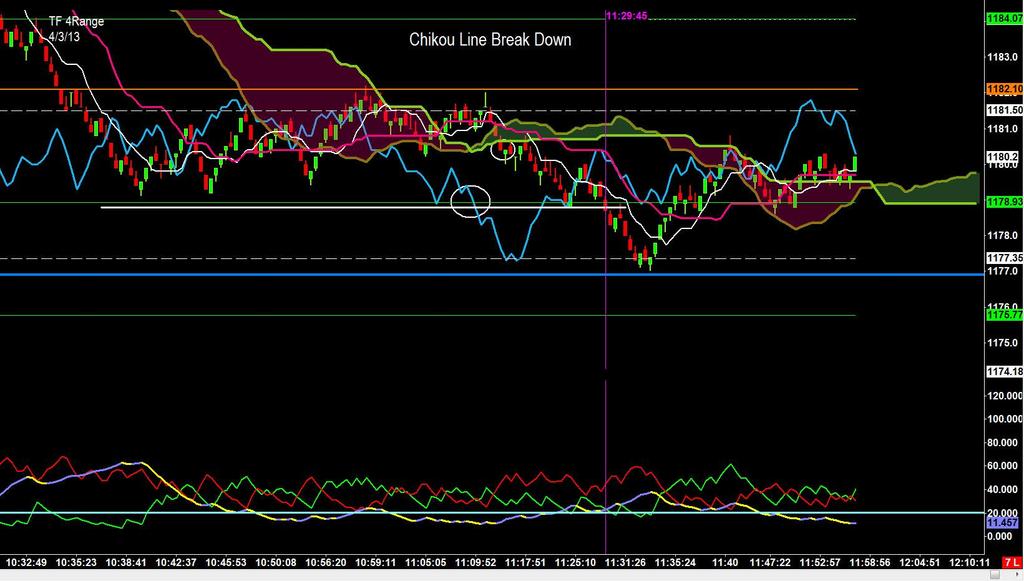
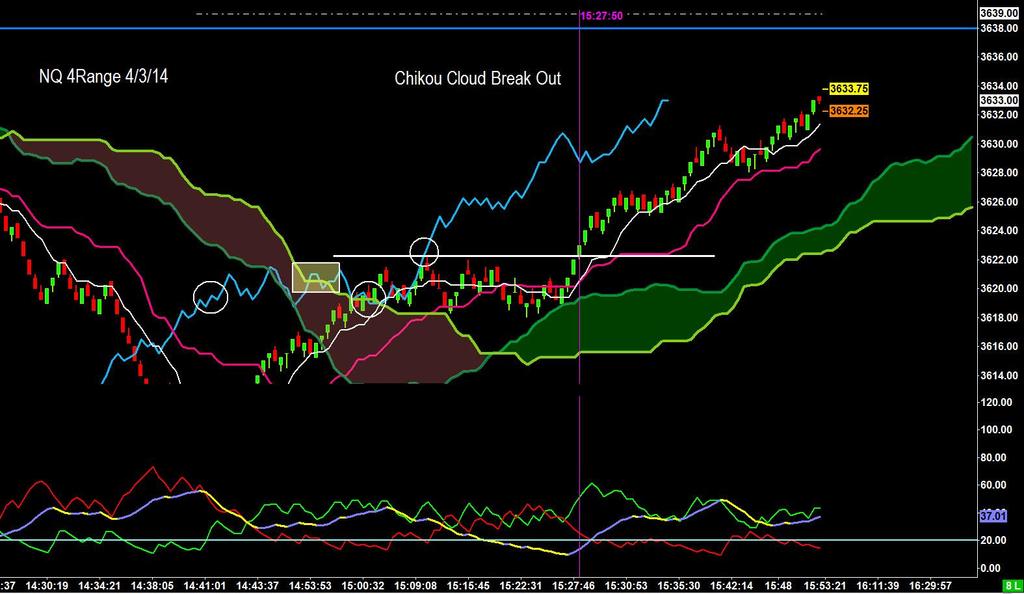
15 Chikou Line Break Out/ Break Down This is one of my favorites! I establish a support / resistance area that has been holding. I draw a Support / Resistance Line, I then watch for the Chikou Line to break this area and the price bar that is giving me that I look to place my order above/below that price bar. I like buy/sell stops for entry on any set up I take I also like the Chikou Line breaking the cloud. You look for the Chikou line to break the cloud and you can enter in above/below the price bar that is giving that to you.
16
17
18
19

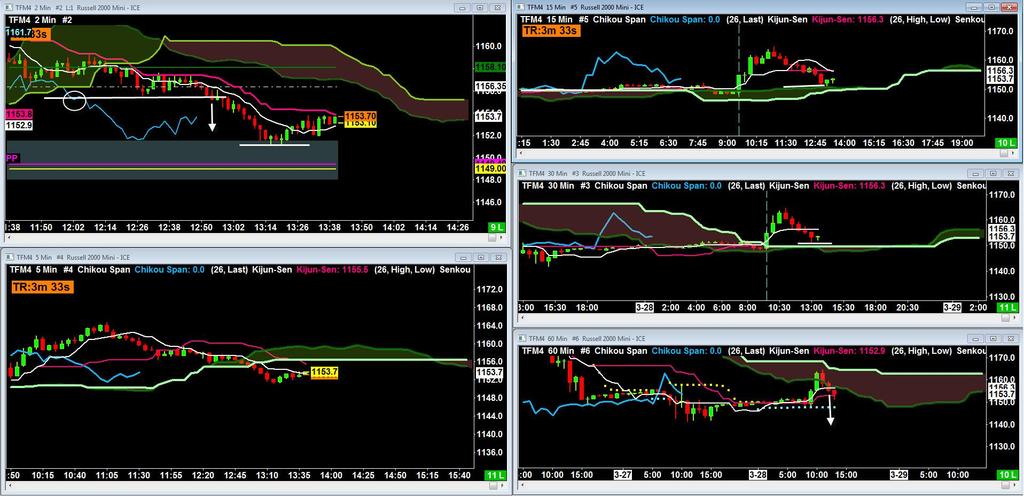
20 Using Multiple Time Frames To Confirm Your Entries If day trading you may just decide to use a 2m, 5m, and 15m If trading from a 2m chart 5m, 15m, 30 or 60m Swing Trading 60m, Daily, Weekly
21
22
23 By chaos Chris Capre or Manesh Patel (Elite Member) Free Ebook great description of indicators and using them Free indicators for Ninja compliments of Integrity Traders Free indicators for Sierra

24
READ THIS FIRST! A. Tenkan Sen/Kijun Sen Cross
 READ THIS FIRST! Ichimoku is a finely-tuned, integrated charting system where the five lines all work in concert to produce the end result. We emphasize the word "system" here because it is absolutely
ICHIMOKU KINKO HYO GUIDELINE
 ICHIMOKU KINKO HYO GUIDELINE This is a complex system made by 5 indicators: 1. Tenkan Sen, LIME in my chart, shows the average price value during the first time interval defined as the sum of maximum and
Ichimoku Kinko Hyo System PDF Strategy Guide + MT4 Indicator Download
 Ichimoku Kinko Hyo System PDF Strategy Guide + MT4 Indicator Download ForexStrategiesWork.com Congratulations! You might not know it yet but you are in for a REAL treat in the Forex World. You now have
The Best Technical Indicator in the World
 The Best Technical Indicator in the World Presented by Andrew Keene Past performance is not indicative of future results. RISK DISCLAIMER Day trading, short term trading, options trading, and futures trading
Ichimoku Kinko Hyo. Ichimoku 101 and history...2. Basic Ichimoku Lines...3. Kumo the cloud...5. Trading signals generated by Ichimoku...
 Ichimoku Kinko Hyo Japan has been undoubtedly the most innovative trading leader for many years now. They have started off by inventing candlestick charts and they are still being used worldwide, during
Ichimoku means "glance", Kinko translates "balance" or "equalibrium", and Hyo is Japanese for "chart".
 Ichomoku Kinko Hyo is a Japanese charting technique developed by a Japanese journalist who wrote under the name "Ichimoku Sanjin" prior to World War II. This study shows where a market is headed and provides
Japanese Cloud Charts Ichimoku Kinko Hyo. Véronique Lashinski, CMT Newedge USA, LLC
 Japanese Cloud Charts Ichimoku Kinko Hyo Véronique Lashinski, CMT Newedge USA, LLC Table of Contents 1. Construction of cloud charts 2. Cloud as support and resistance 3. A look back in time: Weekly, monthly
Stock Market Seminar
 Stock Market Seminar Nik Ihsan Raja Abdullah, MSTA, CFTe President, Malaysian Association of Technical Analysts (MATA) Chartist, Retail Research, Maybank Investment Bank Berhad Full Members of United Kingdom
Ichimoku World Weekly Market Analysis by Gabor Kovacs
 Ichimoku World Weekly Market Analysis by Gabor Kovacs vol.01. 10/09/2010 1 Welcome to the Ichimoku World Weekly Market Analysis! This week produced several nice setups, so let's check them out in chronologic
low-probability trading setups from those of higher probability.
 Ichimoku Kinko Hyo Quick Description Ichimoku Kinko Hyo is a purpose-built trend trading charting system that has been successfully used in nearly every tradable market. It is unique in many ways, but
NEWSLETTER: July 2016
 NEWSLETTER: July 2016 NEWSLETTER: JULY 2016 CONTENTS: Markets Round Up P.3 Look back at June P.4 Trade Of The Month: June - FCoJ P.5 The Month Ahead: July P.6 The Month Ahead: Seasonality For July P.7
Technicals & Time Frame
 Advanced Charting Neither Better Trades or any of its personnel are registered broker-dealers or investment advisers. I will mention that I consider certain securities or positions to be good candidates
- My 4 Favorite Trades - Essential Trades of a Professional Trader
 presented by Thomas Wood MicroQuant SM Divergence Trading Workshop Day One - My 4 Favorite Trades - Essential Trades of a Professional Trader Risk Disclaimer Trading or investing carries a high level of
DAILY DAY TRADING PLAN
 DAILY DAY TRADING PLAN Gatherplace will be used to place all of your trades. You will be using the 5 minute chart for the trade setup and the 1 minute chart for your entry, stop and trailing stop.you will
Advanced Trading Strategies
 Advanced Trading Strategies Traders with certain market experience have a decent idea about their trading style and which time frame they prefer to trade in. We provide different trading systems to cater
IronFX. technical indicators
 IronFX technical indicators Average Directional Index (ADX) The Average Directional Index (ADX) helps traders see if a trend is developing in the charts and whether the trend is strengthening or weakening.
I prefer to use the CCI indicator to trade divergences and it has worked well for me over the past 10 years.
 Make 100 pips Trading Divergences. There are several ways to trade divergences and several indicators that can help you identify the divergence between price and the indicator itself. I prefer to use the
Ichimoku Charts How to read Clouds for Profitable Advantage
 Ichimoku Charts How to read Clouds for Profitable Advantage David Linton Updata david@updata.co.uk What I will cover General Points about Technical Analysis Theory, Cloud Construction, Interpretation Examples
Charting Glossary. September 2008 Version 1
 Charting Glossary September 2008 Version 1 i Contents 1 Price... 1 2 Charts... 1 2.1 Line, Step, Scatter, Histogram/Mountain charts...1 2.2 Open/High/Low/Close charts (Bar Charts)...1 2.3 Candle charts...2
Forex Advantage Blueprint
 Forex Advantage Blueprint Complimentary Report!! www.forexadvantageblueprint.com Copyright Protected www.forexadvantageblueprint.com - 1 - Limits of liability/disclaimer of Warranty The author and publishers
Daily Support & Resistance
 Daily Support & Resistance 30 th July 2010 USDJPY Price continued to decline as expected and stalled at the 85.96 support. The pullback has been firm but has not managed to penetrate both 4-hour & hourly
Chapter 2.3. Technical Analysis: Technical Indicators
 Chapter 2.3 Technical Analysis: Technical Indicators 0 TECHNICAL ANALYSIS: TECHNICAL INDICATORS Charts always have a story to tell. However, from time to time those charts may be speaking a language you
Chapter 3. Price Action
 Chapter 3 Price Action The movement of price in any market is called Price Action. This movement is caused by the beliefs and trading systems of hundreds of thousands of worldwide traders that the market
Welcome to The Ichimoku Trader newsletter!
 The Ichimoku Trader www.ichimokutrade.com EII Capital Volume 1, No. 1 May 18, 2015 Inaugural Issue IN THIS ISSUE Inaugural Issue Welcome...1 Ichimoku: Introduction...2 Global Market Update...3 US Stock
In this report, I will give you a step by step set of instructions for utilizing The Lazy River Scalping Strategy my favorite scalping method.
 What is Scalping? In short, scalping is the idea of taking quick trades (typically on smaller time frames) that only need to go a short distance before you cash out of the position and then to do this
Weekly outlook for April 30 May
 Weekly outlook for April 30 May 4 2018 Summary The S&P500 index is having trouble deciding if it will rally or decline. This indecision makes trading less profitable. Wait for a break-out direction to
Weekly outlook for April 23, 2018
 Weekly outlook for April 23, 2018 Summary The S&P 500 index is expected to go down further if price stays below the 2700 level. A weekly doji candle formed on the intermediate-term chart, and the short-term
2.0. Learning to Profit from Futures Trading with an Unfair Advantage! The Master Trader Price Action Analysis
 2.0 Learning to Profit from Futures Trading with an Unfair Advantage! The Master Trader Is an important concept in trading, whether you re a Day Trader, Swing Trader, or Position Trader. Is in-depth Price
Weekly outlook for Nov. 27 Dec
 Weekly outlook for Nov. 27 Dec. 1 2017 Summary For the ES we expect a minor pullback in the early part of the week, followed by a rally into the weekly close. There are four option expirations this week
Class 8: Trading Neutral. I. Learning to Trade Neutral. Today s Class
 Today s Class Psychology of Trading Neutral Anatomy of a trade Bracket trading/trading neutral Determining stops Journaling Class 8: Trading Neutral I. Learning to Trade Neutral Learning to Trade Neutral/Psychology
presented by Thomas Wood MicroQuant SM Divergence Trading Workshop Day One Black Gold
 presented by Thomas Wood MicroQuant SM Divergence Trading Workshop Day One Black Gold Risk Disclaimer Trading or investing carries a high level of risk, and is not suitable for all persons. Before deciding
How to Spot and Leverage Big Money Moves
 How to Spot and Leverage Big Money Moves 1 Copyright 2016 by Sir Isaac Publishing Inc. 37 N. Orange Ave Suite 500 Orlando, FL 32801 www.sirisaacpublishing.com All rights reserved. Printed in the United
Naked Trading and Price Action
 presented by Thomas Wood MicroQuant SM Divergence Trading Workshop Day One Naked Trading and Price Action Risk Disclaimer Trading or investing carries a high level of risk, and is not suitable for all
Presents. The Trading Information Revealed Here is not the Same as the WizardTrader.com Methods -- But Together They Pack a Powerful Punch
 Presents Killer Patterns Now You Can Have These Trading Gems -- Free! The Trading Information Revealed Here is not the Same as the WizardTrader.com Methods -- But Together They Pack a Powerful Punch 1
Technical Indicators versiunea
 Technical Indicators versiunea 2.0 03.10.2008 Contents 1 Price... 1 2 Charts... 1 2.1 Line, Step, Scatter, Histogram/Mountain charts 1 2.2 Open/High/Low/Close charts (Bar Charts)... 2 2.3 Candle charts...
The Most Important Price Action Patterns for Babon Traders
 The Most Important Price Action Patterns for Babon Traders There are dozens of different Price Action formations and Japanese candles' formations, as a matter of fact almost any so called "expert" and
CONNECING THE DOTS Candlesticks & Convergence of Clues. The Art & Science of Active Trend Trading
 CONNECING THE DOTS Candlesticks & Convergence of Clues The Art & Science of Active Trend Trading Disclaimer U.S. Government Required Disclaimer Commodity Futures Trading Commission Futures and Options
Bollinger Trading Methods. Play 1 - The Squeeze
 Overview: Play 1 - The Squeeze Play 2 - The Trend Trade Play 3 - Reversals Wrap up Bollinger Trading Methods Play 1 - The Squeeze The Squeeze The most popular strategy Looks to enter a trend early on Anticipates
If you have traded forex long enough, you will notice that sometimes, price has an uncanny ability to reverse exactly at or around fibonacci levels.
 Fibonacci Forex Trading Strategy With Reversal Candlesticks The Fibonacci forex trading strategy with reversal candlesticks is simply about using fibonacci retracements in conjunction with reversal candlesticks.
Tommy s Revenge 2.0 Module 2 Part 2
 1 Mark Deaton here with your follow-up to Module 2. Going to cover a few things in this video and try to keep it short and sweet. We re going to look at Stock Fetcher and how we can use Stock Fetcher to
CHARTS. Bar Line Candlestick Charts are the basis of technical analysis They are a graphic display of price action. Notes:
 TECHNICAL ANALYSIS CHARTS Bar Line Candlestick Charts are the basis of technical analysis They are a graphic display of price action Candlestick charts have become the industry standard for technical traders.
The Art & Science of Active Trend Trading
 Candlesticks Looking for U-Turns The Art & Science of Active Trend Trading Copywrite ATTS 2007-2015 1 Disclaimer U.S. Government Required Disclaimer Commodity Futures Trading Commission Futures and Options
Browse through the formulas below, and if there are any you'd like to incorporate into TC2000, follow these procedures to copy and paste them easily:
 Thanks for attending the afternoon session in Phoenix! I've included an adjusted version of the Bottom Rally scan we discussed in class. I've also included all of the PCFs you might like to copy and paste
The One Path Trading System. The foundation of the trading system is Supply and Demand and Support and Resistance.
 The One Path Trading System This trading system is based on Price Action read done by the indicators to make trading simpler and more automated for the trader. All the calculations that are performed in
Hidden Divergence. Hello there, you will be excited about the information contained in this report.
 Hidden Divergence Hello there, you will be excited about the information contained in this report. Isn t it remarkable how people like us who are in the Trading business have taken frequently interesting
Now You Can Have These Trading Gems- Free!
 Presents Killer Patterns Now You Can Have These Trading Gems- Free! The Trading Info Revealed Here is not the Same as the Proven WizardTrader.com Methods But Works Well With Them 1 Copyright Information
Icoachtrader Consulting Service WELCOME TO. Trading Boot Camp. Day 5
 Icoachtrader Consulting Service www.icoachtrader.weebly.com WELCOME TO Trading Boot Camp Day 5 David Ha Ngo Trading Coach Phone: 1.650.899.1088 Email: icoachtrader@gmail.com The information presented is
1 P a g e. Executive Summary
 Executive Summary Last week I was looking for SPX2455-2475 and the S&P500 gave us SPX2454 on Monday and then started to pullback and consolidate causing for many pundits to already start top calling. Close
Presents. SPY the MARKET. With. Bill Corcoran
 Presents SPY the MARKET With Bill Corcoran I am not a registered broker-dealer or investment adviser. I will mention that I consider certain securities or positions to be good candidates for the types
2.0. Learning to Profit from Futures Trading with an Unfair Advantage! Income Generating Strategies Starting the Trading Day
 2.0 Learning to Profit from Futures Trading with an Unfair Advantage! Income Generating Strategies Starting the Trading Day Income Generating Strategies Starting the Trading Day Pre-Market Analysis Before
The Art & Science of Active Trend Trading
 CONNECTING THE DOTS Candlesticks & Convergence of Clues The Art & Science of Active Trend Trading Copywrite ATTS 2007-2015 1 Dennis W. Wilborn, P.E. Founder, President Active Trend Trading dww@activetrendtrading.com
FOREX TRADING STRATEGIES.
 FOREX TRADING STRATEGIES www.ifcmarkets.com www.ifcmarkets.com 2 One of the most powerful means of winning a trade is the portfolio of Forex trading strategies applied by traders in different situations.
Weekly Options Secrets Revealed: A Proven Options Trading Plan
 Weekly Options Secrets Revealed: A Proven Options Trading Plan When talking about stock options there are many common questions that come up. Which strike price should I trade? Should I buy or sell the
PRICE ACTION CONTEXT
 TRADING WITH PRICE ACTION CONTEXT CHRIS CAPRE 2ndSkiesForex.com If you think this ebook is going to be about learning a price action setup, you re wrong. It ll be about something much more powerful. For
RISK DISCLOSURE STATEMENT / DISCLAIMER AGREEMENT
 RISK DISCLOSURE STATEMENT / DISCLAIMER AGREEMENT Trading any financial market involves risk. This report and all and any of its contents are neither a solicitation nor an offer to Buy/Sell any financial
The Art & Science of Active Trend Trading
 CONNECTING THE DOTS Candlesticks & Convergence of Clues The Art & Science of Active Trend Trading Copyright ATTS 2007-2015 1 Dennis W. Wilborn, P.E. Founder, President Active Trend Trading dww@activetrendtrading.com
presented by Thomas Wood MicroQuant SM Divergence Trading Workshop Day One Naked Trading Part 2
 presented by Thomas Wood MicroQuant SM Divergence Trading Workshop Day One Naked Trading Part 2 Risk Disclaimer Trading or investing carries a high level of risk, and is not suitable for all persons. Before
BUY SELL PRO. Improve Profitability & Reduce Risk with BUY SELL Pro. Ultimate BUY SELL Indicator for All Time Frames
 BUY SELL PRO Improve Profitability & Reduce Risk with BUY SELL Pro Ultimate BUY SELL Indicator for All Time Frames Risk Disclosure DISCLAIMER: Crypto, futures, stocks and options trading involves substantial
Lighting the Way: Using Candlestick Patterns. The Art & Science of Active Trend Trading
 Lighting the Way: Using Candlestick Patterns The Art & Science of Active Trend Trading Disclaimer U.S. Government Required Disclaimer Commodity Futures Trading Commission Futures and Options trading has
The Master Trader Counter-Trend Trade Set-Ups
 The Master Trader Counter-Trend Trade Set-Ups Trading Concepts, Inc. The Master Trader Counter-Trend Trade Set-Ups By Todd Mitchell Copyright 2014 by Trading Concepts, Inc. All Rights Reserved This training
Buying stock market winners on Warsaw Stock Exchange - quantitative backtests of a short term trend following strategy
 Proceedings of the Federated Conference on Computer Science and Information Systems pp. 1361 1366 DOI: 10.15439/2015F338 ACSIS, Vol. 5 Buying stock market winners on Warsaw Stock Exchange - quantitative
Knowing When to Buy or Sell a Stock
 Knowing When to Buy or Sell a Stock Overview Review & Market direction Driving forces of market change Support & Resistance Basic Charting Review & Market Direction How many directions can a stock s price
Report for REUTERS. Using your YHOO report
 Trading Report for (YHOO) Using your YHOO report Start Here: Maximize this trading report by first reviewing the short tutorial below. It will help you understand how to use this report, and help you correlate
This is the complete: Fibonacci Golden Zone Strategy Guide
 This is the complete: Fibonacci Golden Zone Strategy Guide In this strategy report, we are going to share with you a simple Fibonacci Trading Strategy that uses the golden ratio which is a special mathematical
Only trade this method when all of the following conditions exist:
 Objective: This method is based on Jesse Livermore s IPO breakout setup. It is conceptually a range breakout swing trading strategy with an objective of profiting from the momentum market anamoly during
2.0. Learning to Profit from Futures Trading with an Unfair Advantage! Income Generating Strategies Essential Trading Tips & Market Insights
 2.0 Learning to Profit from Futures Trading with an Unfair Advantage! Income Generating Strategies Essential Trading Tips & Market Insights Income Generating Strategies Essential Trading Tips & Market
Intra-Day Trading Techniques
 Pristine.com Presents Intra-Day Trading Techniques With Greg Capra Co-Founder of Pristine.com, and Co-Author of the best selling book, Tools and Tactics for the Master Day Trader Copyright 2001, Pristine
TRADING QUALIFIED TRENDS. L.A Little (Author, Professional Trader) Founder of Technical Analysis Today
 Founder of Technical Analysis Today") TRADING QUALIFIED TRENDS L.A Little (Author, Professional Trader) Founder of Technical Analysis Today www.tatoday.com What is Trading? Many loose definitions floating around My definition is that trading
TRADING QUALIFIED TRENDS L.A Little (Author, Professional Trader) Founder of Technical Analysis Today www.tatoday.com What is Trading? Many loose definitions floating around My definition is that trading
10.2 TMA SLOPE INDICATOR 1.4
 10.2 TMA SLOPE INDICATOR 1.4 Unfortunately, you cannot use TMA or any of its derivatives before some poster is going to yell, REPAINT, REPAINT, REPAINT It is like if you can say those words and you will
Divergence and Momentum Trading
 presented by Thomas Wood MicroQuant SM Divergence Trading Workshop Day One Divergence and Momentum Trading Risk Disclaimer Trading or investing carries a high level of risk, and is not suitable for all
Forex Sentiment Report Q2 FORECAST WEAK AS LONG AS BELOW April
 Forex Sentiment Report 08 April 2015 www.ads-securities.com Q2 FORECAST WEAK AS LONG AS BELOW 1.1200 Targets on a break of 1.1534/35: 1.1740/50 1.1870/75 1.2230/35 Targets on a break of 1.0580/70: 1.0160
Technical Analysis Basics. Identifying Tops
 Technical Analysis Basics. Identifying Tops June 2011 1 Sign Up Now to Upshots forex trade signals disclaimer The information provided in this report is for educational purposes only. It is not a recommendation
 www.forexschoolonline.com CHECKLIST 7 Rules to a High Probability A+ Trade - CHECKLIST The checklist is below; Below the checklist is a detailed explanation of each point. You can also download the checklist
presented by Thomas Wood MicroQuant SM Divergence Trading Workshop Day One Bond Trading Success
 presented by Thomas Wood MicroQuant SM Divergence Trading Workshop Day One Bond Trading Success Risk Disclaimer Trading or investing carries a high level of risk, and is not suitable for all persons. Before
The $VIX, the Dow, and China. 3/15/2008
 The $VIX, the Dow, and China. 3/15/2008 In the past few days, I have received some questions from a few members. These questions cannot be answered in a few words, and because other members may be interested,
1 P a g e. Executive Summary
 Executive Summary On Thursday, I proclaimed a major-3 top for the S&P500 based on OEW downtrend confirmations on several indices including the S&P500. Today I am terrible sorry to announce that I am not
TRON Price Analysis Mainet switch driving bullish sentiment
 TRON Price Analysis Mainet switch driving bullish sentiment Having faced naysayers since its inception TRON has struggled to establish legitimacy and has been a classic FUD & FOMO coin. The move to its
Active Trend Trading Rules Review
 Active Trend Trading Rules Review Active Trend Trader: Dennis W. Wilborn A Trend Should Be Assumed to Continue in Effect Until Such Time as Its Reversal Has Been Definitely Signaled Edwards & Magee Disclaimer
Day Trade Warrior. Chapter 5. Intraday Chart Patterns
 Day Trade Warrior Chapter 5. Intraday Chart Patterns What do we know? We have learned about Managing Risk (2:1 profit loss ratio 50% success target) We have learned how to find the Right Stocks (high relative
Technical Analysis Workshop Series. Session 11 Semester 2 Week 5 Oscillators Part 2
 Technical Analysis Workshop Series Session 11 Semester 2 Week 5 Oscillators Part 2 DISCLOSURES & DISCLAIMERS This research material has been prepared by NUS Invest. NUS Invest specifically prohibits the
Candlesticks Discoveries Probability of Success Aug 6, 2016
 Candlesticks Discoveries Probability of Success Aug 6, 2016 The Art & Science of Active Trend Trading Disclaimer U.S. Government Required Disclaimer Commodity Futures Trading Commission Futures and Options
STATISTICAL INDICATOR
 STATISTICAL INDICATOR FOREX LIBRA CODE This short manual aims to explain how to use and apply the Statistical indicator which is part of the Forex Libra Code software. The Statistical indicator is available
Weekly outlook for Jan 16 Jan
 Weekly outlook for Jan 16 Jan 20 2017 TREND DIRECTION S&P 500 Oil Gold Short Term Intermediate-Term Long Term weak strong strong weak Strong Less strong strong weak strong Conclusion: S&P500 indicator
11-Hour Options 2.0 The Next Evolution of Success
 presented by Thomas Wood MicroQuant SM Identifying Key Support and Resistance Levels 11-Hour Options 2.0 The Next Evolution of Success Risk Disclaimer Trading or investing carries a high level of risk,
Tradeciety s Price Action Guide
 Tradeciety s Price Action Guide Welcome... 3 Who am I?... 3 Some impressions from my trading & traveling lifestyle... 4 What Is Price Action?... 6 Candlesticks vs. Chart patterns... 7 Top 3 Candlestick
Forex Lines Tutorial of Forex Lines 2014 indicators.
 Forex Lines 2014 Tutorial of Forex Lines 2014 indicators www.forex4live.com Forex Lines 2014 Tutorial We expected that many traders would be using extremely complicated systems, algorithms and indicators.
90 Days Trading Bonds
 90 Days Trading Bonds with Chip Cole 2015, All Rights Reserved. Order Flow Analytics, Inc. 1 Trading & Training chip@orderflowanalytics.com dbvaello@orderflowanalytics.com 2015, All Rights Reserved. Order
Coaching Session FIVE
 Coaching Session FIVE Coaching Session FIVE Counter-Trend Trade Set-Ups Program Summary Trading Plan Execution The Master Trader Powerful Price Pattern Trades Trade Management Initial Trend Entry Trading
The Launchpad Strategy
 presented by Thomas Wood MicroQuant SM Divergence Trading Workshop Day One The Launchpad Strategy Risk Disclaimer Trading or investing carries a high level of risk, and is not suitable for all persons.
Day Trading Strategies. Day Strategies. and Examples. & Risk Management COPYRIGHTED MATERIAL: ANDREW AZIZ (C)
") Day Trading Strategies Day Strategies and Examples & Risk Management ANDREW AZIZ SESSION 4 Disclaimer BearBullTraders.com employees, contractors, shareholders and affiliates, are NOT an investment advisory
Day Trading Strategies Day Strategies and Examples & Risk Management ANDREW AZIZ SESSION 4 Disclaimer BearBullTraders.com employees, contractors, shareholders and affiliates, are NOT an investment advisory
Trading Unusual Options Activity and Earnings
 Trading Unusual Options Activity and Earnings Presented by James Ramelli Past performance is not indicative of future results. RISK DISCLAIMER Day trading, short term trading, options trading, and futures
The Synthetic Futures Position. Goal
 The Synthetic Futures Position Goal To try to profit from a trending market using an option strategy that allows entry at a reduced cost while offering the same potential for unlimited profit (and loss)
Mastering Your Trades - Trend & Counter-Trend Trading Using Volume Analysis By Gail Mercer READ ONLINE
 Mastering Your Trades - Trend & Counter-Trend Trading Using Volume Analysis By Gail Mercer READ ONLINE If searched for the ebook Mastering Your Trades - Trend & Counter-Trend Trading Using Volume Analysis
TD AMERITRADE Technical Analysis Night School Week 2
 TD AMERITRADE Technical Analysis Night School Week 2 Hosted By Derek Moore Director, National Education For the audio portion of today s webcast, please enable your computer speakers. Past performance
Trading Report for (MSFT)
") Trading Report for (MSFT) If you have purchased this report through Reuters, Yahoo Finance, the Wall Street Journal Online, or any other of our reselling partners you have also become immediately eligible
Trading Report for (MSFT) If you have purchased this report through Reuters, Yahoo Finance, the Wall Street Journal Online, or any other of our reselling partners you have also become immediately eligible
1. Introduction 2. Chart Basics 3. Trend Lines 4. Indicators 5. Putting It All Together
 Technical Analysis: A Beginners Guide 1. Introduction 2. Chart Basics 3. Trend Lines 4. Indicators 5. Putting It All Together Disclaimer: Neither these presentations, nor anything on Twitter, Cryptoscores.org,
JPY BUY SQUARE /28/ Points
 (www.rts-forex.com) Daily Currency Trading Recommendations --CME/Globex FUTURES--MAR Contract 3/3/ Published at 3:-4: pm New York time for the upcoming overnight Globex session and following day until
Figure 3.6 Swing High
 Swing Highs and Lows A swing high is simply any turning point where rising price changes to falling price. I define a swing high (SH) as a price bar high, preceded by two lower highs (LH) and followed
Leadership Continues To Test Support
 Leadership Continues To Test Support I am going to continue to highlight the pattern of the leader off the 2009 low (Semiconductors) until a breakout of 2000 highs or a breakdown of 2-year rising support
Gold, and Mining Stocks Trader Monday, March 04, :57 AM Published by The Wall Street Examiner
 Monday, March 04, 2019 8:57 AM Published by The Wall Street Examiner Cycle Phase/PTT Projection 9-12 Month Top-Down/11-24 Weeks 1330 Done 13/17 Week Down/20? 6-7 Week Down/