ANNUAL REPORT 2016/17 Te Riipoata-a-tau GROWING THE DISTRICT OUR JOURNEY SO FAR
|
|
|
- Allyson Black
- 5 years ago
- Views:
Transcription


1 ANNUAL REPORT Te Riipoata-a-tau GROWING THE DISTRICT OUR JOURNEY SO FAR

2 OUR VISION To be a recognised leader in creating a district that prides itself on economic excellence, local participation and sustainable communities. Kia mohio whaanui te haapori i too maatou oohanga pai rawa, te piritata ki te haapori aa, kia tupu kia hua.
3 CONTENTS Overview Tirohanga Whaanui Financial Pathway Te Ara Puutea This is Waikato district 03 From the Mayor and Chief Executive 04 Our role and structure 06 Who we are Statement of Service Provision Tauaaki Ratonga Whakaritenga Governance 10 Sustainable communities 12 Customer and partnership focus 13 Economic development 16 Emergency management 18 Grants and donations 20 Parks and facilities 22 Sustainable environment 25 Animal control 26 Building quality 27 Environmental health 29 Strategic and district planning 30 Solid waste 32 Roading 33 Stormwater 37 Wastewater 39 Water supply 42 Organisational support 47 Progress towards community outcomes 48 From the Chairman Strategy and Finance and GM Strategy and Support 53 Council controlled organisations 53 Strada Corporation Limited 54 Waikato Regional Airport Limited 54 Waikato Local Authority Shared Services Limited 56 Waikato District Community Wellbeing Trust Financial Statements Nga Raarangi Puutea Statement of comprehensive revenue and expense 63 Statement of financial position 64 Statement of changes in net assets/equity 65 Statement of cash flows 67 Statement of reserve funds 68 Notes to the financial statements 71 Other legislative disclosures Auditor s Report Riipoata o te Kataatari Puutea 151 Statements of Compliance and Responsibility Tauaaki Tuutohu me oona Takohanga
4 OVERVIEW TIROHANGA WHAANUI XX This is Waikato district XX Our role and structure OVERVIEW XX From the Mayor and Chief Executive XX Who we are 2 WAIKATO DISTRICT COUNCIL Annual Report
5 THIS IS WAIKATO DISTRICT WAIKATO IS HOME TO... 71,200 PEOPLE (24.6% IDENTIFY AS MAAORI) 203 NEW NZ CITIZENS IN 14,750 DOGS WAIKATO SPANS... 9,245, PUBLIC TOILETS KERBSIDE COLLECTIONS OF 10,315 TONNES OF REFUSE EACH YEAR WE PROVIDE... WE MAINTAIN... LITRES OF DRINKING WATER A DAY 12 SKATEPARKS 51 PLAYGROUNDS 3POOLS SWIMMING OVER HECTARES 445,000 OF LAND IN WE SUPPORTED AND WE OPERATE... COMMUNITY GROUPS 241 DOGS RE-HOMED WERE 1,827KMS OF SEALED ROADS LIBRARIES THAT SERVICE 6 19,984 LIBRARY MEMBERS 227KMS OF FOOTPATHS KMS OF UNSEALED ROADS PARKS AND RESERVES COMMUNITY HALLS 28 WATER RESERVOIRS WITH A TOTAL CAPACITY OF 30,867m 3 2 ANIMAL SHELTERS 7 WATER TREATMENT PLANTS WITH A TOTAL CAPACITY OF 19,206m 3 PER DAY 22 CEMETERIES 25 DOG EXERCISE AREAS
6 FROM THE MAYOR AND CHIEF EXECUTIVE Managing our rapid growth Waikato District is now the third fastest-growing district in the country, and among the top eight growth councils in the country. We are issuing consents for new dwellings in numbers that rival Wellington, and our business and employment growth is higher than the national average. A non-asset-owning Waters CCO (council-controlled organisation) with Hamilton City and Waipa District Council is another option arising from discussions last year, but we need to consider whether this offers the financial savings and other benefits that we hope to achieve. OVERVIEW Our focus in the past year has been on developing and maintaining the physical and social infrastructure that our growing communities need: to deliver roading, waste management and waters services in sustainable ways, to encourage economic development and employment opportunities, and to provide the facilities and resources that will support vibrant and resilient communities. We have also been reviewing our district plan to set guidelines for future development, and we continued to work with our neighbouring councils and other agencies to reach common understandings over shared crossboundary issues. We adopted the Waikato Plan, to guide regional development, shortly after the year under review. We updated our sub-regional Future Proof strategy to manage growth across Hamilton and Waikato and Waipa districts, and we developed a business case for integrated growth management in North Waikato. Sustainable delivery of services Following the October local body elections we have a Council that combines experience with fresh energy for the task, and we are determined to work with you to meet your expectations. Our customer satisfaction survey tells us that satisfaction with the services you received was 70% overall. We made good progress in finding sustainable ways for maintaining and building our infrastructure to deliver the services we need to support an expected population growth of about 45 per cent over the next 30 years (from about 71,200 this year to 103,000 in 2045.) Our Waikato District Alliance (with Downer NZ) set new records in efficiency and customer responsiveness for our roading and footpath maintenance services. The construction programme was delivered below budget, and response times to customer requests now average less than two days compared with six days before the Alliance was established. We held informal discussions with Watercare Services Ltd and Waikato-Tainui to consider forming a separate company to manage our water and wastewater services. Caring for our environment Environmental sustainability was an important consideration in several initiatives. We completed our district-wide water metering programme by installing meters in Raglan, Huntly and Ngaruawahia with an aim of encouraging conservation by our residents, and to help us to track, locate and fix water loss from the system. The introduction of a user-pays system for all our kerbside waste collections, together with a Less Waste Saves More educational campaign, were successful in reducing the amount of refuse we sent to landfill from our central and southern areas by more than 1,000 tonnes. We decided to invest in upgrading our wastewater systems after spills closed Raglan Harbour three times in 2016, and an independent report outlined weaknesses in our networks. We kick-started improvements by investing $1.76 million. Then, after consulting with the 11,000 ratepayers who pay for wastewater services, we adopted a plan to increase wastewater rates to broaden our works programme with a vision to protect our waterways and environmentally sensitive areas. Economic development In the interests of balanced growth and the provision of local employment opportunities, we rolled out key initiatives to attract new business to the district including a Freight and Logistics Prospectus, a Small Business Guide and the extension of a free business advisory service partnered by Waikato Innovation Park. We also worked with Hamilton & Waikato Tourism to develop a plan to build Raglan into a key regional tourist destination. Our registration of interest for extended Government funding of broadband in our district bore fruit when it was announced eight Waikato townships would be included in the latest UFB rollout, and we were successful in winning $37 million from the Government s Housing Infrastructure Fund to facilitate housing development in Te Kauwhata over the next decade. 4 WAIKATO DISTRICT COUNCIL Annual Report


7 Latest figures show the Waikato district attracted 183 new businesses and nearly 1,000 new jobs in the year to March Major developments included announcements that the country s second largest dairy processor, Open Country Dairy, is building a new plant at Horotiu, and that US-based Cobb Vantress plans to establish a $58 million poultry farm and hatchery near Huntly. Financial performance We met our financial targets for the year. We set rates and debt levels that are affordable, but that also enable us to provide for the needs of our growing community. Average rates per rateable property were $2,622 for the year compared with a calculated affordability limit of $2,888. Average debt per rateable property is $2,617. This is 66 per cent below our debt servicing limit, offering capacity for funding services and facilities as needed for the future. We are determined to work with you to meet your expectations. Building communities together We want to involve you in decisions affecting the future of our district. We engaged with you on more than 30 major initiatives during the year from decisions on our wastewater services to implementing our Placemaking strategy, encouraging communities to reclaim their public spaces through artistic and cultural endeavours. We reviewed our Joint Management Agreements for the Waikato and Waipa Rivers with Waikato-Tainui, and with Ngati Maniapoto, and we signed an MOU with Ngaati Haua Iwi Trust as part of a wider goal to recognise tangata whenua and their interests. We nurtured youth leadership through a Govern Up programme supporting youth action groups to tackle projects from planting fruit trees to running a health expo. We also supported youth employment initiatives from cadetships to driver training days. We committed grants totalling more than $750,000 on behalf of the Creative Communities Scheme Fund, the Waikato District Community Wellbeing Trust, and from targeted and discretionary Council funds, for distribution to 160 community groups and charities throughout the district to enable our communities to come together to meet some of their own needs. We are proud of what we have achieved by working together to meet our district s present and future needs. Allan Sanson Mayor Gavin Ion Chief Executive OVERVIEW Annual Report WAIKATO DISTRICT COUNCIL 5
8 OUR ROLE AND STRUCTURE The Council is elected by the residents and ratepayers of the Waikato district. Thirteen Councillors are elected from within the 10 wards they represent. The Mayor is elected at large. The Councillors and the Mayor make the decisions affecting the communities across the whole district. Wards The district is divided into 10 wards as identified in the map opposite. They are: Awaroa ki Tuakau, Eureka, Hukanui-Waerenga, Huntly, Newcastle, Ngaruawahia, Onewhero-Te Akau, Raglan, Tamahere, and Whangamarino. Community boards Five community boards, whose members are elected within the board areas, deal with local issues within their areas. Community boards are established in Huntly, Ngaruawahia, Onewhero-Tuakau, Raglan and Taupiri. Community committees and groups By advocating on behalf of their local communities, voluntary community committees and groups play an important role within community decision-making. The Council works with them and the community boards so it can take into account local perspectives as part of its decision-making. They include: Aka Aka, Eureka, Glen Afton/ Pukemiro, Gordonton, Horsham Downs, Matangi, Meremere, Newstead, North East Waikato (including Mangatawhiri, Mangatangi and Maramarua), Pokeno, Port Waikato, Pukekawa, Rangiriri, Tamahere, Te Kauwhata, Te Kowhai, and Whatawhata. Our Governance Structure Mayor Allan Sanson Community Boards (30 elected members) Councillors (13 elected members) Infrastructure Committee Policy and Regulatory Committee Strategy and Finance Committee Discretionary and Funding Committee Waikato-Tainui and Waikato District Council Joint Committee District Licensing Chair: Cr Dynes Fulton Chair: Cr Jan Sedgwick Chair: Cr Janet Gibb Chair: Cr Shelley Lynch Co-Chair: Mayor Allan Sanson Chair: Cr Noel Smith OVERVIEW Regulatory Sub-committee Chair: Cr Dynes Fulton Submissions Sub-committee Chair: Cr Janet Gibb Audit and Risk Sub-committee Independent Chair: Margaret Devlin (independent appointment) 6 WAIKATO DISTRICT COUNCIL Annual Report


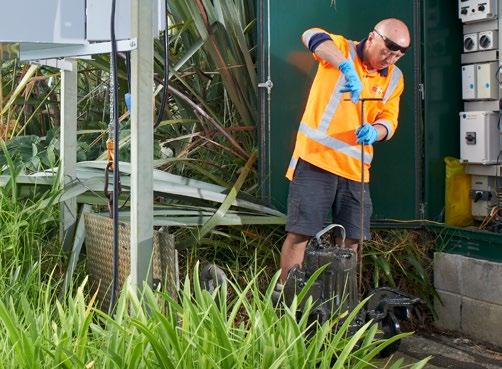
 Tim Harty General")

9 WHO WE ARE The Council Cr Jacqui Church Awaroa ki Tuakau Ward Cr Jan Sedgwick Whangamarino Ward Cr Stephanie Henderson Awaroa ki Tuakau Ward Awaroa ki Tuakau Ward Whangamarino Ward Cr Bronwyn Main Onewhero-Te Akau Ward Cr Lisa Thomson Raglan Ward Onewhero-Te Akau Ward Cr Janet Gibb Ngaruawahia Ward Cr Eugene Patterson Ngaruawahia Ward Raglan Ward Cr Shelley Lynch Huntly Ward Cr Frank McInally Huntly Ward Huntly Ward Ngaruawahia Ward Newcastle Ward Cr Noel Smith Newcastle Ward Hukanui-Waerenga Ward Eureka Ward Tamahere Ward Cr Dynes Fulton Hukanui-Waerenga Ward Cr Rob McGuire Eureka Ward Cr Aksel Bech Tamahere Ward The Executive Team Gavin Ion Chief Executive Sue Duignan General Manager Customer Support (until June 2017) Tim Harty General Manager Service Delivery Tony Whittaker General Manager Strategy and Support OVERVIEW Annual Report WAIKATO DISTRICT COUNCIL 7
10 STATEMENT OF SERVICE PROVISION TAUAAKI RATONGA WHAKARITENGA 10 Governance 33 Roading 12 Sustainable communities Customer and partnership focus 13 Economic development 16 Emergency management 18 Grants and donations 20 Parks and facilities Sustainable environment Animal control 26 Building quality 27 Environmental health 29 Strategic and district planning 30 Solid waste Stormwater Wastewater Water supply Organisational support Progress towards community outcomes 8 WAIKATO DISTRICT COUNCIL Annual Report
11 STATEMENT OF SERVICE PROVISION What we did This Annual Report reviews our progress towards achieving what we set out to do in the second year of our Long Term Plan. The Long Term Plan sets out our strategic direction for the next 10 years and is reviewed every three years. It establishes our community goals and outlines the work programmes we need to carry out to achieve the community outcomes identified. Our work programmes and associated budgets are divided into eight groups of activities that contribute to the community outcomes we re seeking. Our community outcomes are encapsulated by the Council s guiding principles of People, Energy and Economy. People We will develop and maintain relationships and partnerships and provide accessible services, facilities and activities that create a supported, healthy, safe and engaged community. Economy We will promote sustainable growth, maintain accessible, safe and connected infrastructure and services, create an attractive business environment and provide sound financial governance. Energy We will provide active leadership, empowerment and collaboration in our business environment and we will effectively and sustainably manage natural resources. Activity Outcome People Economy Energy Governance Sustainable Communities - Customer and partnership focus - Economic development - Emergency management - Grants and donations - Parks and facilities Sustainable Environment - Animal control - Building quality - Environmental health - Strategic and district planning - Solid waste Roading Stormwater Wastewater Water Supply Organisational Support How we did We have established performance measures for our work programmes to gauge our progress towards the community outcomes identified. In the following We ve achieved We re on track towards the target but haven t quite made it (within 5%) pages, you ll see we have shown how we re doing against our performance measures. We ve used the traffic light system to indicate whether: We ve not met the target (variance greater than 5%) We conclude with a tabular presentation of our progress towards community outcomes on pages 48 to 51. STATEMENT OF SERVICE PROVISION Annual Report WAIKATO DISTRICT COUNCIL 9
12 GOVERNANCE GOVERNANCE What we did Our new Council took office on 27 October after an election that drew a turnout of 30% of the district s 45,000 electors. Mayor Allan Sanson and seven councillors were re-elected and joined by six new councillors. Councillor Dynes Fulton was appointed Deputy Mayor. Involved our communities in decision-making Our goal, as a democratically-elected Council, is to involve you in the decisions that affect the future of our district. We engaged with our communities on more than 30 initiatives, plans, strategies and bylaws during the year, from our Easter Trading Policy to our Annual Plan consultation on wastewater services, and from the development of our Natural Parks Reserve Management Plan to rolling out our Placemaking strategy to encourage communities to take ownership of their public places. We also began discussing the long term strategic direction for the district to set the framework for our next 10-year Long Term Plan on which we will seek your input in the next financial year. We expanded our efforts to interact and consult with you through a range of media, surveys, public meetings and local market days, and we added to our range of online services and searchable databases. We attracted nearly 175,000 people to visit our website in the past year, and we have more than 6,000 followers on Facebook. We supported youth leadership, activities and representation on our Community Boards and Committees through a youth Govern Up programme, with funding from the Ministry of Social Development. We also recognised the outstanding contribution being made by community volunteers across the district in our biennial Mayoral Community Awards. Monitored our performance We continued to measure your response to our work through an independent customer satisfaction survey which involves weekly telephone polling. This tells us we are achieving 70% satisfaction overall with the services you received, but we need to work harder to engage with you on all the right issues. We also monitored our performance to ensure we continue to provide an acceptable standard of infrastructure, community services and facilities. We published our performance measurements on a quarterly basis. Developed our regional partnerships Through the Waikato Mayoral Forum we worked with other Waikato councils to develop a Waikato Plan to guide regional development in four priority areas: planning for population change, getting investment right, partnering with iwi/maaori, and addressing issues around the allocation and quality of fresh water. Following public consultation early in 2017, and a recommendation from the Forum s Joint Committee in June, we adopted the Waikato Plan shortly after the year under review. Working with Hamilton City, Waipa District and Waikato Regional Councils, tangata whenua and NZ Transport Agency representatives, we updated our sub-regional Future Proof strategy to manage growth while addressing complex cross-boundary issues. The first phase of this update, designed to establish an agreed settlement pattern over the next 30 years, was released for public feedback in June. We also worked with Auckland Council, NZ Transport Agency and other key parties in North Waikato to develop a business case for integrated growth management to ensure future growth is supported by the infrastructure needed. Maintained iwi partnerships A five-year review of the Joint Management Agreements for the Waikato and Waipa Rivers, including Waikato- Tainui, Ngati Maniapoto and other council signatories, was completed in late 2016 in line with statutory requirements. Arising from the review are a number of recommendations that the Council will be working with iwi and other local authorities to implement. In early 2017 we signed an MOU with the Ngaati Haua Iwi Trust as part of a wider goal to recognise tangata whenua and their interests, and we entered discussions to develop an MOU with Mai Uenuku ki te Whenua Trust. Engagement with iwi on resource consents, council planning documents and community projects occurred regularly as required, and we progressed efforts to upskill and inform council staff on protocol and other kaupapa Maaori to ensure that we continue to do the right thing. 10 WAIKATO DISTRICT COUNCIL Annual Report
13 How we did Performance measures result target result Rating Explanation Satisfaction of residents that they were able to contact their councillor as and when required. 76% 100% 83% Contact details for councillors are available on our website, through our call centre and in our Link newsletter. Some councillors write regular newspaper columns with their contact details provided. Councillors also attend many community meetings. Number of upheld objections/appeals lodged against election process Target met. Number of joint committee meetings held per annum. 1 Waikato- Tainui, 1 Maniapoto 2 Waikato- Tainui, 2 Maniapoto 2 Waikato- Tainui, 2 Maniapoto Target met. Number of identified or notified breaches/ objections under Joint Management Agreements, MOU s and MOA s Target met. Number of formal governance hui held between the Council and iwi/hapuu groups. 4 Minimum of 3 7 Target met. Percentage of minutes of all open meetings that are made publicly available via the Council s website. 100% 100% 100% Target met. Percentage of Council decisions that comply with statutory requirements. 100% 100% 100% Target met. What this tells us Your feedback through our regular customer satisfaction survey is giving us the information we need to improve the way we work with you. We have not met all our targets for the year overall, but we are making positive progress in working with you to ensure our district continues to develop as an attractive place to live and work. There are no potential significant negative effects associated with this activity. How we paid for it Operational funding 80% 15% 3% 2% General rates Internal charges recovered Local authorities fuel tax, fines, infringement fees and other receipts Targeted rates GOVERNANCE Annual Report WAIKATO DISTRICT COUNCIL 11
14 SUSTAINABLE COMMUNITIES This group of activities includes economic development, grants and donations, parks and facilities, emergency management, and customer and partnership focus. We provide these services to address social and economic wellbeing to support the development of communities and not just discrete sets of towns and villages. It s about the provision of leisure options and the protection of enduring communities. Our strategic focus is to support economic growth rather than spatial growth, and to enrich our communities through employment and improved quality of life rather than simply encouraging population growth. Customer and partnership focus We want to make it easy for you to contact us about issues and questions regarding the services we provide. Key contact points include staff in our libraries and service centres, and our call centre. In order for our customer to feel supported outside of normal working hours, an after-hours service is provided by Hamilton City Council. Economic development We are continually providing infrastructure to support businesses and residents, and updating the district plan to attract industry to our district, along with many other initiatives. The goal is to ensure our district has longevity by bringing more employment opportunities. The unit leads, supports and coordinates economic development activities, plans and initiatives across the district s growth nodes to help build a local environment that attracts and sustains new and existing business investment, residential development and visitor experiences. Emergency management Public safety and emergency management activities are fundamental to the protection of life and property in the community. We have a key role in disaster and emergency response, management and recovery, including rural fire management. Grants and donations Every year we provide grants and donations to various organisations and charities throughout the district, which otherwise might not have access to funding for their work. Parks and facilities We provide many parks and open spaces, playgrounds and public facilities, including aquatic centres and libraries, walkways and sports grounds. Providing these facilities and amenities supports a healthy and thriving community. How we paid for it Operational funding Capital funding SUSTAINABLE COMMUNITIES 80% 8% 6% 3% 2% 1% General rates Local authorities fuel tax, fines, infringement fees and other receipts Fees and charges Targeted rates Internal charges recovered Subsidies for operating purposes 28% 22% 22% 16% 12% Gross proceeds from sale of assets Development and financial contributions Increase in debt Subsidies and grants for capital expenditure Other dedicated capital funding 12 WAIKATO DISTRICT COUNCIL Annual Report
15 Customer and partnership focus What we did Customer satisfaction survey To help improve our customer focus we continued to commission the National Research Bureau to undertake a customer satisfaction survey by means of randomised telephone polling throughout the year. Overall 70% of respondents were satisfied or very satisfied with the service received from the Council. Detailed feedback ranged from 41 per cent satisfaction with our stormwater services (although in this area 47% of respondents were either neutral or had no opinion) to 92 per cent satisfaction with the district s parks and reserves, including sports fields and playgrounds, and 90 per cent satisfaction with the quality of our library services. Staff responsiveness We undertook quality assurance coaching for our call centre staff on a regular basis to review call handling and how our approach could be improved. We exceeded targets for the timeliness of our response to customers service requests and 68% of survey respondents said it took little or no effort to conduct business with the Council. Satisfaction with the resolution of requests was 62 per cent overall despite exceeding targets in some quarters. Customer engagement We engaged with our communities on more than 30 initiatives, plans, strategies and bylaws during the year, from our Easter Trading Policy to our Annual Plan consultation on wastewater services, and from the development of our Natural Parks Reserve Management Plan to rolling out our Placemaking strategy by working with community groups district-wide. To complement our formal consultation and engagement processes we undertook electronic and print communications and surveys, ran public meetings and market day stands, and sought your feedback through social media. Our online customer engagement continued to rise as we expanded our online services and lifted our social media engagement. Compared with there was an 11 per cent increase in website visits during, an 18 per cent rise in website users (to nearly 174,500 unique visitors during the year) and an 8 per cent increase in new users. Traffic coming to the website via social media has continued to rise (up 29 per cent) accompanied by a growing trend for visitors to view the website via mobile phones (up 55 per cent). A new placemaking programme led by Council staff is encouraging communities to come together to reclaim their public spaces through artistic and cultural endeavours. Two projects were notable in winning wide engagement and placed the Council as a finalist for a Local Government NZ award: an ANZAC poppy tree yarn bombing project, and an ongoing little libraries book exchange project. Youth engagement is another key initiative. With Ministry of Social Development funding we have established and worked with eight youth action groups on projects of their own choosing. Library services Our libraries are an important focus for community activity, hosting community group meetings as well as regular reading programmes and other learning opportunities. Our Springtime reading programme welcomed 200 participants this year, our Matariki creative writing and design competitions attracted more than 600 entries, and movie night during Love Your Library week proved popular in February. We refurbished our Huntly library this year with a focus on reflecting our local heritage and creating a safe hub for community activities, and we extended our library opening hours in Huntly and Te Kauwhata in line with our other libraries in the district. Following the refurbishment the Huntly library became a cash-free site, but with a full range of non-cash payment options including online banking via the library s free wi-fi. CUSTOMER AND PARTNERSHIP FOCUS Annual Report WAIKATO DISTRICT COUNCIL 13
16 How we did Performance measures result target result Rating Explanation Percentage of customers satisfied that the Council engages with the community regarding the right issues. Percentage of customers satisfied with the ease of access to information regarding key community issues. Percentage of customers satisfied that the material available on key issues is clear and provides sufficient information to allow feedback. Percentage of customers satisfied that council provides a suitable range of options and avenues to engage through. Percentage of customers satisfied that Council provides sufficient time and opportunity for engagement with the community. 41% 60% 45% 46% 60% 52% 42% 60% 49% 50% 60% 49% 47% 60% 55% The result has improved, but does not reflect the amount of community engagement undertaken in. We engaged the community on all issues we believed were of interest to the community. The recent targeted engagement on the Annual Plan is a good example. We improved the result through continued efforts to provide information to the community through various means (e.g. website, social media, the Link newsletter, community open days, letter drops and counter pamphlets). Staff are also always on hand to address any requests for information. We improved the result and will continue with our efforts in this area. Our Communications team helps with the review and layout of information provided to the public. Complex issues are always simplified for the purpose of ease of understanding by our community without detracting from legislative requirements. Councillors and staff made strong efforts to use a range of tools to engage our community on Council issues. It s hard to ascertain why the result is falling short. This result has improved and we will continue to work for more improvement. One month is a standard timeframe used to engage the community on a particular issue however if timeframes are tight, no less than 3 weeks is allowed to receive feedback from the community. CUSTOMER AND PARTNERSHIP FOCUS Average level of effort to conduct business with council. On a scale of 1 5 (5 being high effort) how much effort did it take to conduct your business with the Council? Percentage of CRM calls responded to within agreed timeframes. Percentage of respondents/ customers who are satisfied or very satisfied with the resolution of their request of the Council. 2.6 Less than or equal to Target met. 93% 85% 90% Target met. 59% 70% 62% We cannot always provide the outcome that our customers are seeking, but there has been a concerted effort to improve communication and clarity in setting customer expectations. Although we did not reach our target, the 3% improvement on last year s result endorses the effort and direction towards making business as simple as possible for our customers. 14 WAIKATO DISTRICT COUNCIL Annual Report
17 Performance measures result target result Rating Explanation Percentage of respondents who are satisfied or very satisfied with the overall service received when contacting the Council. 66% 75% 70% All staff focused on our effort to simplify the customer experience and to represent council professionally so it is likely this behaviour is helping to improve our customers perception of our service. The organisation knows the importance of making every interaction count. A 4% increase on last years result supports the positive changes staff continually endeavour to make. Net Promoter Score (level of likelihood that library users will recommend to friends and family their library as a place to go). Level of customer satisfaction that the quality of library resources meets their needs. 93% 80% 92% Target met. 93% 90% 90% Target met. Percentage of books that are less than five years old. Percentage of books that are less than 10 years old (excluding reference, specialist items, local history and core stock of long term value). 69% 50% 68% 93% 100% 95% We undertook a project to check the condition of our collection, and many items had to be removed or replaced due to damage. The reporting software does not easily identify reference material and stock of long term value and it s assumed some of this stock is being included in the main collection reporting. The improved result is a reflection of the hard work that has been made by all of the Customer Delivery team to ensure that our Library collections are relevant and meeting the needs of our communities. Percentage of time that access to a free internet service is available in libraries. 98% 100% 100% Target met. Number of publicly shared reports assessing Council s progress against its goals and objectives Target met. CUSTOMER AND PARTNERSHIP FOCUS Annual Report WAIKATO DISTRICT COUNCIL 15
18 What this tells us A strong focus on the ways in which we engage with our communities on key issues has seen customer satisfaction levels rise. We will continue to strive to meet our targets in this area. We engaged with our communities on more than 30 major initiatives through the year, and survey results varied through the year depending on the issues at hand and the level of perceived engagement activity. Overall there were high neutral response rates and relatively low dissatisfaction scores on questions relating to community engagement, so some low satisfaction results may be misleading. Potential significant negative effects Potential negative effect How we are addressing this Damaged library items. Repaired as condition assessed during the issuing or receipting process, or discarded in accordance with the collections policy. Inappropriate books/magazines/material in the collection (such as adult material, or offensive to cultures, religion, or in general). Items are acquired in accordance with the collections policy and catalogued as per the nature of the material. Economic development ECONOMIC DEVELOPMENT What we did Strategy In line with our Economic Development Plan and implementation strategy we continued a programme to support growth in areas of identified economic strength, including primary and food industries, energy, freight and logistic industries, and in identified growth industries, notably tourism. Regional approach We collaborated with our regional partners through the Waikato Mayoral Forum to support the development of The Waikato Story, a toolkit of digital resources to support business growth through a strong, consistent profile for the region. We worked with Hamilton & Waikato Tourism to develop a Raglan Destination Action Plan and a destination tourism operators network to build Raglan into a key destination for the region. We also led the compilation of a Raglan Visitor Infrastructure Report to identify the challenges in providing for surges in visitor numbers that reach 40,000 a day or more during peak holiday periods in the small (estimated 5,000 population) township. Local initiatives We appointed a marketing officer to help roll out key initiatives under the Explore the Open Waikato District brand to attract new business to the district. These included a Freight and Logistics Prospectus, a Small Business Guide, and the extension of a free business advisory service established in North Waikato in partnership with Waikato Innovation Park to both Raglan and Huntly. We reviewed the support processes that the Council offers to large development projects to ensure a businessfriendly, streamlined approach. We also sponsored a youth employment scheme to strengthen relationships between Waikato secondary schools and local employers. With a growing suite of digital resources for business users, the Open Waikato website attracted nearly 9,000 visitors and generated 145 business-related enquiries. Highlights Business development Latest figures show the Waikato District attracted 183 new businesses and nearly 1,000 new jobs in the year to March 2016, posting an annual employment growth of 4.6 per cent (well ahead of national employment growth of 2.7 per cent) and a 2.2 per cent growth in new businesses (compared with 1.6 per cent across New Zealand). Major developments included announcements that the country s second largest dairy processor, Open Country Dairy, is building a new plant at Horotiu for the start of the milking season, and that US-based Cobb Vantress Inc has gained Overseas 16 WAIKATO DISTRICT COUNCIL Annual Report
19 Investment Office approval to establish a $58 million poultry farm and hatchery on 149 hectares at Rotongaro just outside Huntly. Business park developments in Horotiu and Pokeno are filling fast with 42% of the 109-hectare development at Horotiu now sold and Pokeno well underway. Tourism spending in the District jumped 17% to $112 million in the year to March 2017 compared with an 8.3% rise to $25,988 million of tourism spending in New Zealand overall. Housing Infrastructure Fund We were successful in winning $37 million from the Government s Housing Infrastructure Fund to facilitate development in Te Kauwhata over the next decade with infrastructure that will better protect the local environment. Our plans include options to integrate Te Kauwhata s wastewater scheme with a larger neighbouring scheme in order to remove all municipal wastewater discharge from the Lake Waikare and Whangamarino wetlands area. Ultrafast broadband (UFB) Our Registration of Interest (ROI) for extended Government funding of broadband in our district bore fruit this year. Eight Waikato district towns are included in the latest UFB rollout including Tuakau, Te Kauwhata, Huntly, Taupiri, Ngaruawahia, Horotiu, Whatawhata and Raglan. How we did Performance measures result target result Rating Explanation Net Promoter Score (level of likelihood that business owners will recommend WDC as a district to do business in). +6 (A positive shift of 14 percentage points from -8.0) 20% increase on previous year +12 (100% increase) Respondents in the business perception survey rated the Waikato district 8.7 out of 10 as a place to do business (up from 8.6 last year), and we achieved a Net Promoter Score of 12 (up from 6 last year). The percentage increase in number of business units in the Waikato District. (Same or higher than New Zealand growth rate in number of business units). 2.2% District growth rate is = or higher than NZ growth rate 2.2% Growth in the Waikato district exceeded the national average of 1.6%. The district now has 8,691 business units. Percentage increase in number of enquiries generated through the Open Waikato website. 109% 20% 116% There were 145 enquiries via Open Waikato channels over the year, with the primary generator being bookings for the Waikato Innovation Park business service held in Raglan, Tuakau and Huntly. We more than doubled the number of enquiries we received last year (67). Measureable tourism expenditure in $. $85m $99m $112m Total tourism expenditure for Waikato District to March 2017 was $112m. This reflects a 17% increase in spend, compared to a national average of 8.3% for the same period. The percentage of the Economic Development strategic work programme delivered. 93% 90% 100% In addition to the successful delivery of the economic development strategy work programme, the economic development team has also successfully led or supported the following strategic projects: applications to the regional midsized tourism infrastructure fund (x2), application to $1B Housing Infrastructure Fund, a sub-regional Council s Business Friendliness Survey, and organisational development and marketing initiatives. ECONOMIC DEVELOPMENT Annual Report WAIKATO DISTRICT COUNCIL 17
20 What this tells us Business and employment growth are supported by a fast-growing population which fuelled a 10% growth in building consents in the March 2017 year, and saw Waikato district overtake Wellington for that period to become the fourth highest-growth area in the North Island (after Auckland, Hamilton and Tauranga) and seventh overall in New Zealand. Our continuing rate of household growth is tipped to mirror that of Auckland, albeit on a smaller scale, so we are working with neighbouring Councils and transport agencies to ensure we can support this growth with the infrastructure that will be needed in the next 30 years, while taking care to ensure that our urban developments do not put our economic base of prime agricultural and horticultural land at risk. A matching growth in demand for Council services means we are continuing to focus on improving our overall customer service and community engagement processes. Waikato district s reputation as a place to do business is increasing according to the six-monthly business perception surveys we ve commissioned. In March 2017 respondents rated the district as 8.7 out of 10 as a place where business owners would recommend a colleague or friend do business. The net promoter score for our district - which measures advocates versus detractors rose to +12 this year compared with +6.0 last year. There are no potential significant negative effects associated with this activity. Emergency management What we did EMERGENCY MANAGEMENT Integrated incidence preparedness This year we have further developed an integrated approach to risk, incident and emergency management. The frameworks developed are designed to align our approach to business continuity with our Civil Defence and Emergency Management so that we follow the same principles for each, but simply scale our response appropriately. A redeveloped risk management framework will contribute to a business-as-usual approach to risk reduction and preparedness within the organisation as a whole. Central to the concept is the appointment of an Incident Management Team and the development of processes to help guide our response. Ongoing Civil Defence and Emergency Management (CDEM) training means we have a large cohort of staff capable of forming teams to operate and support the district s Emergency Operations Centre (EOC). We took part in the Ministry of Civil Defence and Emergency Management s national simulated tsunami exercise, Operation Tangaroa, in September and the Get Ready Get Thru public campaign in October. Emergency management in action We responded successfully to several incidents and emergencies during the year. In November we trucked more than 3 million litres of drinking water to the Raglan community for a week, after the Kaikoura earthquake disturbed the clarity of the spring water feeding the township s water reservoirs. In March and April we managed a series of floods and road closures, established emergency shelter for residents and coordinated recovery efforts, as a result of three severe weather systems that struck New Zealand. These proved to be good tests of our local community response plans and galvanised our communities to work with us to develop more. We now have four fully-operable local community response plans and seven more in development. Our business resilience response and recovery was also tested by a computer malware attack that we managed successfully. 18 WAIKATO DISTRICT COUNCIL Annual Report
21 Audit An independent audit of our Civil Defence Emergency Management (CDEM) function praised the Council s capabilities in relation to its small size saying, Waikato District Council has a unique culture and commitment to CDEM that most other local authorities would be envious of. We continued to maintain good working relationships with local emergency services, the Waikato District Health Board, NZ Red Cross, local Lions groups and the Ministry of Social Development, who are key partners in an emergency and recovery. How we did Performance measures result target result Rating Explanation The percentage of community response plans completed. 13% 30% 13% We currently have seven plans at different stages of development around the district. Staff have been working with communities to develop their community response plans however it is up to the communities to complete these plans with the support of staff. Council maintains a minimum number of trained staff to fulfil core Emergency Operations Centre roles. 103 staff trained 30 staff trained 120 staff trained Civil Defence Emergency Management training is offered to all our staff and there is a high take-up. Percentage of Council s business continuity processes implemented. 100% 100% 80% Critical business processes have been captured. A full review of business continuity processes was not undertaken during final quarter due to prioritisation of resources. This will now be undertaken during the first half of the new financial year. Council manages local participation in the national Get Ready, Get Thru campaign annually. 100% 100% 100% Target met. There are no potential significant negative effects identified with this activity. EMERGENCY MANAGEMENT Annual Report WAIKATO DISTRICT COUNCIL 19
22 Grants and donations What we did Local groups supported We supported the work of 160 organisations and charities throughout the district this year with grants and donations from Council-owned or administered funds. From Council-owned funds (see table) we committed more than $610,000 for distribution to 136 local groups. Of this the largest single amount was $150,000 to support the work of Hamilton and Waikato Tourism, and this is already paying dividends in joint research and planning work to underpin our growing tourist industry sector in Raglan. We also spent the balance of $600,000 committed in for completing the northern section of Te Awa Great New Zealand River Ride. (This was transferred to our roading team and so is not reflected in the table). We expect to celebrate the completion of this project early in the new financial year. On behalf of the Creative Communities Scheme Fund we distributed $48,441 to benefit 17 local groups, and the work of seven more groups benefited from $88,250 we distributed on behalf of an independent trust we administer, the Waikato District Community Wellbeing Trust (see page XX). Council funds committed Council funds committed for distribution (see table) included $354,000 for 22 local groups and projects as a result of Long Term Plan pledges. A further $257,600 of discretionary grants and other funding was committed for distribution to 114 local groups during the year through applications processes managed by Council committees and Community Boards. One initiative we supported from our Rural Ward fund was the installation of a new water fountain feature for the Woodlands Historic Homestead and Garden Estate to enhance this popular heritage destination in our district. Established in the 1870s, the Estate s gardens have been awarded a 5 star Garden of National Significance rating by the New Zealand Garden Trust. Among the first projects to be funded through the Council s new Heritage Project Fund this year were signs depicting the heritage of Raglan and Te Kowhai, and restoration work on the exterior of the Tuakau Museum. Description Annual Plan Committed $ Amount Paid $ Twin Arts Information Centre 5,000 5,000 Raglan Museum 20,000 20,000 Waikato District Sports Award 5,000 5,000 Life Education Trust 5,000 5,000 Ecosourced Waikato in the District 2,000 2,000 Waikato district crime prevention 10,000 - Bush Tramway 1,000 1,000 Te Akau Community 7,000 7,000 Te Otamanui Lagoon 25,000 25,000 GRANTS AND DONATIONS Tamahere Community Committee 4,000 2,714 Hamilton & Waikato Tourism 150, ,000 Tuakau and District Museum Society Inc. 10,000 10,000 Onewhero Old School Building 10, WAIKATO DISTRICT COUNCIL Annual Report
23 Description Annual Plan Committed $ Amount Paid $ North Waikato Transport Trust 2,000 2,000 Waikato district lakes 20,000 - Para Kore 5,000 5,000 Karioitahi Hall 2,906 2,906 Te Kauwhata & Districts Information 10,000 10,000 and Support Centre Waikato Coalfields Museum 50,000 50,000 Waikato Biodiversity Forum 3,000 3,000 Franklin Tourism 2,500 2,500 Matariki Festival 5,000 1,692 Sub-total of Annual Plan commitments 354, ,812 A total of 114 other groups benefited from: Heritage assistance fund 19,029 95,377* Conservation Fund Grants 30,750 4,099 Heritage project fund 40,000 3,381 Discretionary Grants 167, ,224* Total Council funds committed , ,893 * Includes funds committed in. How we did Performance measures result target result Rating Explanation Number of discretionary grant funding rounds undertaken per year. The percentage of community funding/grant recipients meeting grant obligations, as evidenced through accountability reports Target met. 90% 100% 100% Target met. There are no potential significant negative effects associated with this activity. GRANTS AND DONATIONS Annual Report WAIKATO DISTRICT COUNCIL 21
24 Parks and facilities What we did District wide We continued to develop and update our key Parks and Facilities strategies including plans for our playgrounds, halls, toilets and trails (encompassing the district s walkways, cycle ways and bridleways). These strategies provide a framework for maintaining and improving our district s key assets by outlining priority works, timeframes and budgets required. Two significant new contracts to manage our aquatic facilities and to maintain our parks and open spaces commenced in August last year. Both have produced good results to date. Since we appointed Belgravia Leisure Ltd to operate our summer pools in Ngaruawahia and Tuakau and our all-season Huntly Aquatic Centre there has been a 72% increase in learn to swim numbers, a 71% increase in gym memberships and a 32% increase in overall use of our facilities. We have also had a significant improvement in our parks audit results, especially with our gardens and turf maintenance areas, since City Care Ltd began maintaining all our open spaces including our sportsgrounds, playgrounds and cemeteries. Central Waikato Detailed designs were completed for the Tamahere Recreation Reserve (which will include a piazza, playground, skate park, basketball half court and sports ground with a cricket pitch), and all preliminary earthworks were undertaken and storm water treatments installed. A new skate park was completed at Te Kauwhata to form part of the popular Te Kauwhata Village Green and to complement the attractions there for the community and visitors. A new playground at Te Kowhai Village Green Reserve, completed in July last year, has set a new standard for playground design throughout the district with a combination of five different play stations in one, winning good reviews from the community. We completed the first of a four-year Lake Rotokauri restoration programme including fencing boundaries and planting native species. This four-year programme is supported with nearly $400,000 in funding from the Waikato River Authority. North Waikato The Meremere skate park was upgraded and a wellpatronised opening day held in December last year. The Onewhero Domain has been improved for community use with a new playground and a new toilet block attached to the local rugby club. Raglan area Te Kopua Playground was upgraded with new attractions including a spinner, rope bridge, modular unit and seesaws to complement existing playground equipment in the Kopua park area. PARKS AND FACILITIES 22 WAIKATO DISTRICT COUNCIL Annual Report
25 How we did Performance measures result target result Rating Explanation Percentage of customers who are satisfied with Parks and Reserves, including sports fields and playgrounds overall. 90% 85% 92% Target met. Percentage of interments completed within the requested timeframe. 100% 95% 100% Target met. Percentage progress of the Playground Strategy implementation plan. 100% 90% 100% Target met. Percentage of customers who are satisfied with public toilets in the annual satisfaction survey. 73% 75% 74% We improved our performance from the previous year and will continue to strive to meet this target. Percentage of natural areas (categorised in parks strategy) which have had restoration efforts undertaken. 4% 4% 7% Target met. Percentage of buildings that require a warrant of fitness and that comply with it. 100% 100% 100% Target met. Percentage of time that pool water meets the NZS5826 Part 1 Water Standards: 2000 Code of Practice for the operation of swimming pools. 95% 95% 90% Non compliance of the water standards occurred at the beginning of the new contract. Issues that were identified as a result of non compliance have been addressed. Percentage of customers who are satisfied with the pool facility. 86% 85% 91% Target met. Percentage of satisfied customers as per the Council Housing for the Elderly survey. 75% 72% 92% Target met. Total annual energy consumption. 8% increase on previous year 1.5% reduction on previous year 2.5% increase Energy use increased primarily due to water and wastewater treatment plant requirements, and some temporary operational requirements at the Huntly Aquatic Centre. However, the dollar value has decreased by 6.5% due to the All of Government Contract which started on 1 July PARKS AND FACILITIES Annual Report WAIKATO DISTRICT COUNCIL 23
26 Potential significant negative effects Potential negative effect How we are addressing this Disability access to facilities. Development of the disabilities access policy. Design and maneuverability for wheelchair access, or mobility scooter. New facilities to be designed in accordance with the Hamilton City Council development manual. Noise and disorderly behaviour issues from events at reserves, and general use of reserves. Events managed in line with the council s terms and conditions of hire. Any disturbance will be handled by local police or noise control if required. Herbicides impacting environment. Working in conjunction with Hazardous Substances and New Organisms (HSNO) standards for handling agri-chemicals. Enforcing appropriate conduct and use of wash down facilities and hard stands. Ensuring pest and weed control activities are within guidelines. Damages to property and harm to people from falling trees and branches. Tree maintenance programme according to industry standards. Focus on higher risk areas such as walkways, playgrounds, higher use reserves, and power networks. Responsive to customer requests and cyclical maintenance. Reserves can create a fire hazard for properties. Management of fire breaks to prevent this effect. Hazardous chemicals used to keep bio hazards under control, can be harmful if mishandled. Staff training to identify and handle emergency events and safety standards strictly adhered to. Sodium hypochloride used which is safer alternative than traditional chemicals. Accidents at aquatic facilities. Pools managed to Pool Safe certification standards. Wet floor signage for appropriate areas. Isolation/location of public toilets leading to safety concerns. Ensure toilets are designed appropriately and located in areas that are easily visible and accessible. Use Crime Prevention Through Environmental Design (CPTED) principles. Congregation of undesirable groups with the potential to vandalise equipment. Maintenance regimes in place to rectify any issues, installation of CCTV as appropriate. CPTED principles. Toilets can present a sanitary risk to the community. Included in Water & Sanitary services assessments (three yearly). Considered to have a negative aesthetic effect. Use of eco design, strategic locations, planting to minimise the impact, environmentally complementary plain colour. Noise and disorderly behaviour issues from events at cemeteries and general use of cemeteries. Restricted opening hours. PARKS AND FACILITIES Congregation of undesirable groups with the potential to vandalise equipment. Potential pollution of waterways from cemetery activities. Maintenance regimes in place to rectify any issues, installation of CCTV as appropriate. Use CPTED design principles. Maintain an adequate separation distance between human remains and the highest seasonal ground water table. Maintain an adequate buffer zone around cemeteries, and plant with deep rooting trees. 24 WAIKATO DISTRICT COUNCIL Annual Report
27 SUSTAINABLE ENVIRONMENT This group of activities includes animal control, building quality, strategic and district planning, solid waste and environmental health. Our strategic focus is to develop and maintain an integrated approach to providing sustainable, attractive, affordable and safe options for living, in a way that s in tune with what ratepayers want. We need to provide more streamlined processes that cost less while still delivering required results for our community and Council. Animal control The Animal Control Team provides animal control services through dog registration, complaint response, and impounding wandering stock and animals as required by the Dog Control Act 1996, Impounding of Stock Act 1955, and Council s Dog Control Policies and Bylaws. This is achieved through active enforcement of requirements and via the education of dog owners and the general public. Building quality We protect the community by ensuring that buildings in our district comply with legislation, including the fencing of swimming pools. We process building consent applications and carry out construction inspections. Environmental health We provide a range of services to ensure food outlets maintain high food safety standards, alcohol outlets operate to the conditions of their licences, and that noise and nuisance complaints, hazardous substances and contaminated sites are all managed. Strategic and district planning Land use and growth management planning ensures the district can grow and develop in a sustainable manner and in accordance with the principles contained in the Resource Management Act (RMA) Solid waste As set out in the Waste Minimisation and Management Plan (WMMP), Council has adopted an aspirational vision of Working towards zero waste for the Waikato district. The goals of the WMMP are summarised as: z Working more closely with our communities in managing waste; z Working more closely with the growing waste management industry in the district and the other councils around us; z Improving our kerbside recycling collections; z Considering ways to reduce the amount of rubbish we collect and how much it costs; and z Improving transfer stations to recover and recycle more material than we do now. How we paid for it Operational funding Capital funding 34% 33% 17% 13% 3% General rates Fees and charges Local authorities fuel tax, fines, infringement fees and other receipts Targeted rates Internal charges recovered 100% Subsidies and grants for capital expenditure SUSTAINABLE ENVIRONMENT Annual Report WAIKATO DISTRICT COUNCIL 25
28 Animal control What we did Public education Our focus on educating owners about responsible dog ownership is continuing to lead to fewer call-outs and higher dog registration numbers, and growing community satisfaction. Our Council customer satisfaction survey showed 77% of respondents were either satisfied or very satisfied with animal control services (compared with 69% last year). Our education efforts include the district s future dog owners. This year we ran 26 school visits in our Dogsmart Education Programme to teach children about dogs, safety and responsible ownership. We also launched a Dogs in Libraries programme, giving children opportunities to read to well-trained dogs in weekly after-school sessions in each of our libraries. The programme helps children to read as well as learn about dogs, and is proving very popular. Ahead of our annual registration we again offered free property inspections to help responsible owners who meet fencing requirements to qualify for our selected dog owner list and enjoy reduced registration fees. Of more than 9,000 dog owners in the district, nearly 3,000 now meet the same stringent criteria as farm dog owners. We also attracted nearly $20,000 in government funding to promote dog de-sexing, and we ran a Facebook campaign to offer subsidised desexing as part of that effort. Working with our Parks and Facilities team we developed a unique new dog agility park at Horotiu with recycled playground equipment and ran a fun day to promote it. We also led community consultations to help identify new dog exercise areas in Tamahere and Pokeno. Dog registrations The number of registrations is 14,111, compared with 13,901 last year, and this represents nearly 96% per cent of all known dogs in the district. Animals impounded, returned and rehomed The number of dogs impounded was 1,120, compared with 1,190 last year. The number of wandering stock impounded was 57. With the help of 10,000 followers on our Pound Pups Facebook page generating enquiries from all over the country we rehomed 241 dogs, even sending some as far afield as Christchurch. Response times to call-outs Although some parts of our district cannot be reached within an hour s travel time, we still met our goals to be on-site within an hour for 95 per cent of emergency animal control call-outs. How we did Performance measures result target result Rating Explanation The percentage of aggressive dog behaviour complaints, where immediate risk to public safety is present, that has council personnel on site within 1 hour. The percentage of complaints regarding stray stock that have council personnel on site within 1 hour. 98% 95% 99% Target met. 97% 95% 95% Target met. ANIMAL CONTROL The number of dog owners on the selected owner policy list (i.e. good dog owners) for known dogs increases by 5% each year. 32% 35% 32% We set an ambitious target. While we have not met it, we have been encouraged by the positive response we have had from our customers when undertaking property inspections to assess suitability for selected dog owner status. Property inspections are proving a good opportunity to engage with and educate our dog owners. 26 WAIKATO DISTRICT COUNCIL Annual Report
29 Potential significant negative effects Potential negative effect How we are addressing this Injury to Animal Control Officers from attack by dog owners, dogs and livestock. Dog owners disgruntled by enforcement action taken against them. Members of the public are at risk from dog attack. Dog control activity is predominantly paid for through registration of known dogs which may not target those that use the service. Continue to provide ongoing training and ensure the correct and required personal protection equipment is provided. Professional and courteous enforcement. Ensure animal control services are maintained at a level to ensure stray dogs are impounded. Implement cost recovery options where possible. Building quality What we did Building consents systems To help meet a growing demand for building consents in our district, partly fuelled by housing scarcity and rising prices in Auckland, we investigated and built new digital back-of-house systems for improving our efficiency in handling consent applications. The new paperless system is now ready for trialling with selected customers before it is rolled out. Once completed, we will encourage all customers to prepare digital applications and any paper-based applications will be scanned into the system for consenting purposes. The plan is to augment the system with an online portal which will allow all consents to be lodged via the internet in the future. Accreditation We undertook a bi-annual assessment by IANZ (International Accreditation NZ) and were successfully re-accredited as a Building Consent Authority. Issues Consents processing Building consent numbers have dropped slightly in the past year to 1,977 overall (2,006 last year) with consents for new dwellings falling to 726 across the district (from 797 last year). Nevertheless these numbers represent a new scale of activity for the district with consents for new dwellings up 42% and overall consents up 20% when compared with consents issued in 2014/15. This has had a significant impact on our consent processing and building inspection workloads, especially as any staff vacancies have proved very difficult to fill in the face of strong industry demand for qualified personnel. At critical times we were unable to maintain statutory timeframes for consents despite costly outsourcing arrangements. We expanded staff numbers for the second year running and will continue to review staffing levels as required. Inspections For the past few years our ability to meet targets for swimming pool inspections has depended on pool owner consent for this activity. New legislation now offers us an opportunity to review our processes and we will employ a dedicated staff member to undertake these inspections. We have met our targets for auditing other buildings for code compliance. BUILDING QUALITY Annual Report WAIKATO DISTRICT COUNCIL 27
30 How we did Performance measures result target result Rating Explanation The percentage of existing buildings with building WOFs that are monitored and audited for compliance annually. 55% 33% 51% Our inspections staff prioritised building WOFs, significantly exceeding the target, before moving to focus on other work. The percentage of buildings that provide sleeping care or paid accommodation that are audited for compliance annually. 100% 100% 100% Target met. The percentage of swimming pools that are inspected for compliance annually. The percentage of building consent applications that are processed within 20 working days. 0.5% 20% 1.7% 96% 100% 86% Our ability to meet the target has depended on pool owner consent. New legislation offers us an opportunity to review our processes and we will employ a dedicated resource to improve performance in this area. The current levels of growth in our district has meant that we have struggled to meet the performance measure, due to the timing of getting additional resources. An additional staff member has started in the Tuakau office as a response to the continued high demand. Potential significant negative effects Potential negative effect How we are addressing this Legislation is requiring more council input into plan review and building inspection, which increases costs. Non-compliance requires the council to take offenders before the Courts. The time to process applications might be regarded as a delay to construction. Leaky homes are identified. The council has to react to new legislation, but tries to limit the cost increase as much as possible. Prosecution of blatant offences against the Building Act is necessary to reinforce compliance, maintain equity for those who obtain consents and fulfil statutory duty. This is mitigated through the simplification of the consent process. More thorough vetting of the drawings, inspections by better trained highly skilled inspectors, will assist in reducing the incidence of leaky homes. BUILDING QUALITY 28 WAIKATO DISTRICT COUNCIL Annual Report
31 Environmental health What we did Implementing new food legislation We continued to work with local food manufacturers and suppliers to support a three-year transition to a new regulatory system under The Food Act 2014 which came into force in March last year. The new auditing system has different requirements for different types of food operations dependent on perceived risk. A higher risk category business must register and operate a food control plan that is audited by the Council. A lower risk category business must register under a national programme that may be audited independently. All premises with an on-licence were required to move to the new regime by the end of the financial year (30 June). All but two of these were registered under the new Act by that time and we are working with those businesses to ensure they meet the new requirements. Other food premises have longer to make the change. For example those that voluntarily adopted a food control plan under the old Act have until early 2019 to make the change to the new system. Applications, inspections and audits During the year we registered and inspected or audited 256 food premises, handled 322 alcohol licensing applications and 529 contaminated land property information requests, provided technical comment on a range of resource consent applications and responded to 227 general nuisance complaints. We also received 1,212 excessive noise complaints. How we did Performance measures result target result Rating Explanation The percentage of registered food premises that are inspected/audited annually. The percentage of medium risk or higher fee category licensed premises that are inspected annually. 100% 100% 100% Target met. 100% 100% 100% Target met. Percentage of excessive noise complaints responded to within agreed timeframes. Percentage of environmental health complaints responded to within agreed timeframes. 86% 90% 79% 95% 95% 94% 1,212 complaints were received relating to excessive noise. Staff are working with the contractor to address the variable performance. As a result changes to how the service is delivered have been proposed. A total of 227 complaints were received during the year of which 214 were responded to within agreed timeframes. What this tells us All food premises and licensed premises requiring inspection were visited during the year. Our response rates to noise and nuisance complaints slipped, but we are working with our contractors to improve this performance. A significant increase in the number of contaminated land property information requests likely reflects increased development activity in the district and greater awareness of the service. There are no potential significant negative effects associated with this activity. ENVIRONMENTAL HEALTH Annual Report WAIKATO DISTRICT COUNCIL 29
32 Strategic and district planning What we did STRATEGIC AND DISTRICT PLANNING Planning for growth We continued to make good progress with the review of the District Plan which will integrate the Waikato and Franklin sections into a single plan for the first time since the district s boundary changes in We are on track for a new proposed District Plan to be publicly notified in The Social and Economic Profile we commissioned to support our District Plan predicts household growth of 660 to 880 a year and a projected growth rate of between 56% and 73% in the period , which will outstrip Hamilton (49-67%) to match Auckland s projected growth rate (53-76%). Planning is focussed on managing this growth sustainably and in line with the Government s National Policy Statement on Urban Development Capacity 2016 (NPS-UDC) which requires us to provide sufficient land for housing and business development both now and in the future. Sub-regional and regional A new draft Future Proof Growth Strategy was developed with Hamilton City, Waipa District and Waikato Regional Councils and published in May 2017 for public consultation prior to finalisation for adoption in August It will be reviewed again once another assessment of land requirements triggered by the NPS- UDC has been completed. We continued to play a key role in developing the Waikato Plan with nine other councils that comprise the Waikato region. Following public consultation in early 2017 the Plan was recommended for adoption by the partner councils and is expected to be launched in late This is a significant milestone which will provide a collective voice on regional priorities, guide decision-making on regional issues involving population change, infrastructure, economic development and the environment, and enable leverage of central government funding. We worked with Auckland Council, New Zealand Transport Agency and other key parties in North Waikato to develop a business case for integrated growth management to ensure future growth is supported by the infrastructure needed. District wide A new structure plan providing for long term growth in Ngaruawahia and surrounding villages was made operative, while the timetable for progressing the Tuakau Structure Plan was re-assessed in light of the District Plan Review. To help our communities develop as our townships grow we began a programme of placemaking (social infrastructure) projects to encourage communities to come together to reclaim their public spaces through artistic and cultural endeavours. Placemaking has included community-based projects as diverse as building oversized outdoor seating in Huntly, installing creative planter boxes in Raglan, a public sculpture project in Tauwhare, redesigning an empty carpark space in Tuakau, and two district-wide projects: an ANZAC poppy tree yarn bombing project in nine communities and a little libraries project that started in Pokeno and Huntly and is expected to spread to 30 more communities. Youth engagement is another key initiative. With Ministry of Social Development funding we have established and worked with youth action groups empowering them to identify and implement local community projects. These include a skate park in Te Kauwhata, community planting in Taupiri, a fruit tree project in Onewhero, and a health expo in Ngaruawahia. Consents workload A rapid growth in demand for housing has led to another year of significant increases in our resource consents workload, although planning and property enquiry numbers have eased. Our Consent Planners and Land Development Engineers received 1,120 resource consent applications, up 12 per cent from last year. Our Planning and Engineering Officers undertook detailed assessments of 1,487 building consent applications, about the same as last year, but up 34 per cent from two years ago. Meanwhile, LIM staff processed 1,389 requests, down 17 per cent since last year. Our Duty Planner service handled 4,523 enquiries, down 5 per cent on last year, and our Property Enquiry service received 1,761 enquiries, down 9 per cent from last year. Highlights z We secured $37 million from the Government s Housing Infrastructure Fund for infrastructure projects to facilitate residential development in Te Kauwhata over the next decade. z Plan Change 17 supporting the Structure Plan for Ngaruawahia and surrounding villages was successfully completed with no appeals. z The Iwi Reference Group established to provide input into the District Plan Review continues to be a valuable think tank. 30 WAIKATO DISTRICT COUNCIL Annual Report
33 How we did Performance measures result target result Rating Explanation The percentage of resource consent applications which are processed within statutory timeframes. Percentage of residents who feel they have the opportunity to be involved and participate in publiclynotified Council projects and processes, to help Council make informed decisions. 100% 100% 99.9% 67% 70% 59% Of the 938 consents that were processed in the financial year, one was not processed within statutory timeframes. The final result does not reflect our increasing efforts to provide opportunities for public participation, but may be a reflection of the community s increasing appetite for engagement. The percentage of projects in identified areas of growth and as contained in the Long Term Plan, which are on track or completed. The percentage of all land use consents that have been issued and are current that have been monitored for compliance in the past two years. 97% 100% 100% Target met. 79% 77% 78% Target met. What this tells us Our district is growing rapidly and this is putting pressure on our planning and consents teams to meet targets and ensure our district develops in a sustainable manner. However we are making good progress in planning for growth by developing structure plans for our growing communities, and by taking a balanced and sustainable approach to growth through our District Plan Review currently in progress. Potential significant negative effects Potential negative effect How we are addressing this Planning may increase development costs, through compliance costs, development levies or financial contributions. Non-compliance with statutory requirements for the issuing of resource consents may cause delays. Inadequate or harsh monitoring of District Plan requirements may discourage development, affecting the economy in the district. Benefits flow back to developers from improved environmental quality, and provision and co-ordination of services such as infrastructure, and any net negative effect is not significant. Improvement of systems is ongoing to ensure continual improvement in services. Apply a reasonable, concise, consistent monitoring process. STRATEGIC AND DISTRICT PLANNING Annual Report WAIKATO DISTRICT COUNCIL 31
34 Solid waste What we did Changes in our refuse and recycling services together with a Less Waste Saves More educational campaign were successful in reducing the refuse tonnage that we sent to landfill this year. In our central and southern areas alone we reduced the amount of refuse we sent to landfill from our kerbside collections by more than 1,000 tonnes, from 7,019 to 5,995 tonnes. (We do not have comparative data for the northern area due to extension of our service and considerable residential growth.) We had estimated that 64% of our previous years refuse collections could be recycled so there is still room to improve and we will continue these efforts. With a vision of Working towards zero waste for the Waikato district as set out in our Waste Minimisation and Management Plan (WMMP), we: introduced a district-wide user-pays system for all households that have a kerbside waste collection, standardised kerbside recycling services and an annual inorganic refuse service for all areas with kerbside waste collection services (except Raglan which has an alternative service), and listened to residents in Pukekawa and parts of Onewhero where we have now introduced a kerbside refuse and recycling service for the first time. A new dedicated food waste kerbside collection for Raglan has been planned for introduction in the new financial year (starting in August 2017). How we did Performance measures result target result Rating Explanation The percentage of schools in the district that receive solid waste education. The number of times that bags or bins are missed in Council s kerbside collection. The percentage of kerbside collection complaints that are resolved within agreed timeframes. 72% 55% 81% 141 Less than 200 per annum 1,784 97% 100% 96% Resourcing arrangements in Raglan mean more schools in the area received this education than expected. The large number of missed collections were due to service changes and were predominately in the Northern area. This was due to a new contractor being unfamiliar with the collection area. 1,049 complaints out of 1,094 were responded to within the required timeframes. Potential significant negative effects Potential negative effect How we are addressing this Increase in the amount of refuse to be disposed as population increases over time. Environmental impacts caused by the discharge of contaminants to land and water from closed landfills. Ease of disposal, through convenient waste management services, encourages increased quantities of material to be sent to waste by customers. Potential impacts on customer satisfaction due to service failure /delays /responsiveness. The council acts as the advocate for waste reduction through the adoption of the Waste Management Plan. The council also supports education initiatives and provides education material for its customers. Compliance with resource consent conditions that stipulate the frequency and parameters to be monitored. Education and programmes to build awareness and foster ownership of waste minimisation within the community. Monitor and report on Levels of Service and in Service provider contracts. Seek to resolve customer complaints to close the loop. SOLID WASTE Health and safety risks associated with the operation, maintenance, or construction of solid waste infrastructure. Under-provision of recycling facilities fails to promote a positive shift in the community s attitude to waste. Waste entering the water bodies affect the mauri of the environment. Ensure compliance with legislation and health and safety management plans. Maintain an incidents register. Each main urban community in our district has green waste and/or recycling facilities. Each main urban community in our district has green waste and/or recycling facilities. 32 WAIKATO DISTRICT COUNCIL Annual Report
35 ROADING What we did The Waikato District Alliance joint venture between the Council and Downer NZ is the country s largest roading alliance and has continued to deliver improvements in roading asset management and maintenance, and customer responsiveness. The construction programme has been delivered within budget. Response times to customer requests averaged six days before the Alliance was established, but now average less than two days. These performance levels saw the Waikato District Alliance win the 2017 Local Government NZ Chorus Excellence Award for Best Practice in Infrastructure Management. Emergency response Our performance standards are exemplified by the way in which we reinstated access along Otonga Valley Road within 20 hours of a catastrophic collapse of a culvert under the road in November 2016, isolating 28 residents on the no exit road. An engineer visited the site the same day to assess the damage. Additional resources were arranged, including transportation to get children to school to sit national exams. A bridge deck and crane were speedily taken to the site and Waikato District Alliance teams worked through the day and part of the night to re-establish access for the community. With 50 per cent funding support from the NZ Transport Agency, we undertook a $1 million programme of short term road repairs after major storms in April resulted in slips and widespread damage in Mercer, Pokeno and Pukekawa. Following a district-wide assessment we compiled a longer term road restoration programme that is expected to cost a further $2.4 million. Innovation We have identified and instituted a number of innovations to improve processes and outcomes. One example is assessment of the condition of our sealed road network by High Speed Data (HSD) collection, including video, to inform our 10-year forward work programme. Another example is a Roadroid smartphone app that allows us to assess the condition of our unsealed roads while driving along them. The smartphone records how smooth or rough the journey is, enabling us to map the data and schedule road grading as efficiently as possible. Employment We provided employment and a career pathway for a number of young people from the district through two apprenticeship programmes. We also provided internships for three engineering graduates, and we continued a comprehensive mentoring and development programme for our permanent staff. Road safety education We worked with the NZ Police, NZ Transport Agency and other agencies to deliver a road safety education programme covering issues such as driver fatigue, driving to the conditions, and drink driving. We ran skills training days, workshop, roadside education stops, and advertising campaigns. We also worked with other local Councils to run five young driver training days, focussing on driving skills and vehicle maintenance for young drivers about to sit their restricted or full licence. Bridge construction and maintenance We completed a project to repaint Tainui Bridge, Huntly, by hand (using rollers rather than spray painting) to ensure that no residue ended up on passing cars or in the Waikato River. Resource consents were received for a new Taupiri- Mangawara Stream Bridge that will allow safe access to the Taupiri Mountain urupa (Maaori burial ground). Waikato District Council, Kiwi Rail, Waikato-Tainui and the NZ Transport Agency are each contributing to the cost of the project. A temporary staging bridge is in place and we expect the new bridge to be constructed and open for use by June Te Awa cycleway Construction began on a $1.3 million suspension bridge at Horotiu to provide the final link in the Ngaruawahia to Hamilton section of Te Awa The Great New Zealand River Ride to complete a continuous Waikato riverside cycleway from The Point in Ngaruawahia to Hamilton Gardens. The bridge will be installed early in the 2017/18 year to complete a $4.5m project funded by the Te Awa River Ride Charitable Trust, the government s Urban Cycling Fund, Waikato District Council and the NZ Transport Agency. ROADING Annual Report WAIKATO DISTRICT COUNCIL 33
36 Road surfacing and strengthening During the past year, through the Waikato District Alliance, we have re-surfaced 115 km of sealed roads in the district, completed 18 km of road strengthening work, and traction sealed a section of Hills Rd, Raglan. In conjunction with this work we have also undertaken work to improve road safety by increasing road widths and improving visibility. Savings of about $200,000 from better network management were reinvested into strengthening some sections of our unsealed roads. Footpath upgrades As a result of residents requests we laid a number of new footpaths district-wide at a cost of $100,000. These included: Raglan Nihinihi Ave and Uenuku Ave Puketaha Sainsbury Rd Tamahere Newell Rd. How we did Performance measures result target result Rating Explanation The change from the previous financial year in the number of fatalities and serious injury crashes on the local road network. +22 Target for reducing the number of serious injuries or fatalities For the year to 30 June 2017, 68 fatal and serious injury crashes are recorded in the NZTA crash database compared with 59 the previous year. (Reporting delays mean the database figure for 2015/2016 is now higher than the 37 we reported last year.) Further analysis is required, but road conditions do not appear to have been a significant factor. The average quality of ride on a sealed local road network, measured by smooth travel exposure. 95% 91% (minimum) 98% Target met. The percentage of footpaths that fall within the level of service or service standard for the condition of footpaths that is set out in relevant documents (such as its annual plan, activity management plan, asset management plan, annual works program or long term plan). 99.7% 90% or greater at Category 3 or better 99.7% Target met. Percentage of development areas that have co-ordination plans for forward works programming and development requirements complete. 33% 60% 66% The development areas are Pokeno, Tuakau and Te Kauwhata. A development plan for Pokeno was established in and one for Te Kauwhata was established in. The percentage of the sealed local road network that is resurfaced. 8.7% 8% (minimum) 7.3% A spike in bitumen costs meant the programme had to be scaled back. 133 km of the road network was resurfaced during which equates to 7.3% of the length of sealed road. The percentage of customer service requests relating to roads to which we respond within the timeframes specified. 94% 80% 96% Waikato District Alliance resourcing has allowed greater focus on customer service requests than anticipated when the target was set. ROADING The percentage of customer service requests relating to footpaths responded to within the timeframes specified. 94% 80% 100% Waikato District Alliance resourcing has allowed greater focus on customer service requests than anticipated when the target was set. 34 WAIKATO DISTRICT COUNCIL Annual Report
37 What this tells us We surpassed our targets for the quality of the roading and footpath network, and for our responsiveness to customers maintenance requests. Despite a focus on road safety we were unable to reduce the local road toll, but road conditions do not appear to have been a significant factor. Our road re-sealing programme was impacted by a 25% spike in the cost of bitumen which required a scaling back of the programme. Potential significant negative effects Potential negative effect How we are addressing this Road and environmental factors can contribute to crashes, particularly those that involve loss of control. Increased traffic congestion on existing transport network. The particular needs of cyclists and pedestrians and their conflicts with other forms of traffic. Speed restrictions imposed on inappropriate locations causing speed limits to be ignored. NZTA monitors and records through the Crash Analysis System (CAS) the percentage of accidents cause by loss of control. Undertake crash reduction studies (CRS). Maximise funding for minor safety works. Roading contributions imposed under consent conditions contribute to road upgrading. Implement the recommendations of the Walking and Cycling Strategy. Speed limit surveys carried out and resulting recommendation in accordance with Speed Limit New Zealand and Transport Agency rules. If effect is not given to the Livestock Movement Bylaw 2011 then existing crossings will remain with resulting traffic hazards and public nuisance. Monitor to ensure the appropriate and safe crossing of cattle as per bylaw. Economically, the cost of desired infrastructure improvements may exceed the community s ability to pay. The quality of surface runoff from roads that discharges into adjacent coastal or other waters. Dust nuisance. Consult with the community on all costs and options for levels of service through the Long Term Plan process. Compliance with resource consents and the Council s engineering standards and guidelines. Environmental controls. Track and record complaints and comply with resource consent conditions during construction activities. Danger to people and property and high social cost from crashes. Continuing the programme of road safety improvements. Main roads can divide communities. Continuing to advocate for by-passes around urban centres. Potential for negative impacts from traffic noise and vibration to properties adjoining roads. High use roads are usually surfaced with asphalt to improve useful life and level of service. Traffic calming will avoid use of speed humps. Specific issues will be investigated and mitigation measures undertaken as appropriate. ROADING Annual Report WAIKATO DISTRICT COUNCIL 35
38 Potential negative effect How we are addressing this Potential for air pollution from traffic fumes to affect health. Heavy traffic volumes can lead to loss of amenity in urban areas. Provides easier access to sites that are culturally sensitive. Potential for road construction to disturb sites of cultural significance, including waahi tapu. Continuing to advocate for bypasses around urban centres. Continuing to advocate for bypasses around urban centres. Continuing to better identify sites of cultural significance. Continuing to invest in good relationships with tangata whenua. How we paid for it Operational funding Capital funding 61% 25% 8% 5% General rates Subsidies for operating purposes Local authorities fuel tax, fines, infringement fees and other receipts Internal charges recovered 75% 21% 3% 1% Subsidies and grants for capital expenditure Development and financial contributions Increase in debt Other dedicated capital funding 1% Fees and charges ROADING 36 WAIKATO DISTRICT COUNCIL Annual Report
39 STORMWATER What we did We undertook a schedule of minor upgrades across the district, installing new pipes to increase stormwater capacity where required, and undertook planning and investigations in some high growth areas in preparation for the district s next 10-year Long Term Plan Pokeno In Pokeno we continued to oversee development-led extensions of the stormwater network and riparian planting beside streams to ensure that infrastructure and stormwater management keeps up with growth in the area. Tuakau We began work on a stormwater catchment management plan for the area. Raglan We also began designing the works required for a 10-year project to extend and upgrade the Raglan stormwater network, based on the stormwater catchment management plan for the area. Huntly We undertook improvements to the stormwater network in Kent St and George St, Huntly. How we did Performance measures result target result Rating Explanation The number of flooding events that occur in the district. 0 <5 events per annum 0 Target met. For each flooding event, the number of habitable floors affected (expressed per 1000 properties connected to the stormwater system) affected per thousand properties per event 0 Target met. The median response time to attend a flooding event, measured from the time that Council receives notification to the time that service personnel reach the site. 137 minutes < 8 hours 0 Target met. There were no flooding events in. The number of complaints received by Council about the performance of its stormwater system, expressed per 1000 properties connected to the stormwater system per 1000 properties for the year <1 per 1000 properties per quarter 3.65 Target met. Council s level of compliance with resource consents for discharge from its stormwater system, measured by the number of: Abatement notices Infringement notices Enforcement orders Convictions Target met. STORMWATER Annual Report WAIKATO DISTRICT COUNCIL 37
40 Potential significant negative effects Potential negative effect How we are addressing this Discharges to land and waterways not complying with resource consents. Improve processes (may be capital related) and continue to monitor discharges. Discharge of contaminants to waterways and streams impacting upon public health and the environment (includes but not limited to wastewater overflows and stormwater runoff containing sediments, oils, greases and heavy metals). Implement improvements (capital related) and ensure compliance with the council s Development Manual Guidelines for new developments. Erosion of streams and river beds. Chemical spills affecting waterways. Implement Development Manual Guidelines. Establish procedures and emergency response plans with Waikato Regional Council. Health and safety risks associated with the operation, maintenance, or construction of stormwater infrastructure. Ensure compliance with legislation and health and safety management plans. Maintain an incidents register. Potential impacts on customer satisfaction due to service failure/delays/responsiveness. Monitor customer requests for service and report on Levels of Service. Ensure customer complaints are resolved. Disruption during the implementation of works. Works will be implemented under resource consent or contract conditions dictating how the service will be maintained (case by case basis). Individuals can affect the stormwater network and neighbouring properties by altering natural flow paths. Flooding can affect public health and safety. Stormwater can cause public health issues through bacterial contamination of beaches. Monitor new developments to ensure natural flow paths are maintained. Continue to advise land owners of potentially floodprone areas. Establish procedures and emergency response plans with Waikato Regional Council. Contamination of the receiving environment is unacceptable to tangata whenua. Continuing to better identify sites of cultural significance. How we paid for it Operational funding Capital funding 79% 15% 6% Targeted rates Internal charges recovered General rates 80% 20% Development and financial contributions Increase in debt STORMWATER 38 WAIKATO DISTRICT COUNCIL Annual Report
41 WASTEWATER What we did We took a series of decisions to invest in upgrading our wastewater systems after spills closed Raglan Harbour three times in 2016, resulting in a formal warning from the Waikato Regional Council. District-wide continuous improvement programme In August we commissioned an independent report that outlined weaknesses in our wastewater networks that contributed to waterwater overflows district-wide. The report recommended a series of steps to fasttrack improvements in the network. In December we kick-started an improvement programme by investing an extra $1.76 million to: z install a parallel alarm system on all Raglan pump stations, z launch a CCTV network investigation programme, and z fund community education designed to help reduce the blockages causing 80% of our wastewater overflows. Following consultation with 11,000 of our ratepayers who pay for wastewater services, we adopted a new Annual Plan for 2017/18 to broaden this works programme to mitigate the risk of wastewater overflows, with a particular focus on protecting waterways and environmentally sensitive areas. This will allow us to undertake the investigations needed to propose lifting our wastewater service performance levels throughout the district in our next 10-year Long Term Plan We have started a staged programme to invest in separate teams and equipment for drinking water supply and wastewater services in line with Ministry of Health best practice guidelines. The single district-wide targeted wastewater rate planned for introduction in 2017/18 (to supersede five different local rates) will now rise from $ to $ (including GST). Development-led works In our high-growth northern areas we oversaw development-led extensions of the wastewater networks in Tuakau and Te Kauwhata. We also began construction on phase 2 of the new Pokeno wastewater system that will service the existing village so that septic tanks can be phased out. Housing Infrastructure Fund bid successful We applied for a $37 million share of the Government s $1 billion Housing Infrastructure Fund to invest in wastewater systems and other infrastructure servicing Te Kauwhata to facilitate housing development in the township over the next decade to meet the demands of a rapidly growing north Waikato community. The Government s decision to approve our application announced just after the close of the financial year recognised an opportunity to address growth pressures arising from Auckland s housing shortage. Treatment plant upgrades We began concept designs to upgrade the Huntly wastewater treatment plant to allow for future network expansion, including a possible link to Te Kauwhata to improve network resilience and to achieve better environmental outcomes in that area. We also started preliminary designs for upgrades to our treatment plants in Raglan, Te Kauwhata and Meremere. WASTEWATER Annual Report WAIKATO DISTRICT COUNCIL 39
42 How we did Performance measures result target result Rating Explanation The number of dry weather sewage overflows from Council s system expressed per 1000 sewage connections to that sewage system. 2.9 per 1000 connections Equal or less than Target met. Where Council attends to sewage overflows resulting from a blockage or other fault in its sewage system, the following median response times measured: Attendance time: from the time that Council receives notification to the time that service personnel reach the site. 26 minutes Less than or equal to 1 hour (60 minutes) 30 minutes Target met. Resolution time: from the time that Council receives notification to the time that service personnel confirm resolution of the blockage or other fault. 110 minutes Less than or equal to 4 hours (240 minutes) 106 minutes Target met. The total number of complaints received by Council about any of the following (expressed per 1000 connections to the sewage system): Sewage odour Sewage system faults Sewage system blockages Council s response to issues with its sewage system 7.8 per 1000 connections Less than or equal to 25 per 1000 connections 7.3 per 100 connections Target met. Council s level of compliance with resource consents for discharge from its stormwater system, measured by the number of: Abatement notices Infringement notices Enforcement orders 0 Equal or less than 2 0 Target met. WASTEWATER Convictions Target met. 40 WAIKATO DISTRICT COUNCIL Annual Report
43 Potential significant negative effects Potential negative effect How we are addressing this Discharges to land and waterways not complying with resource consents. Odour from manholes, pump stations and at treatment plants. Discharges from manholes. Improve processes (may be capital related) and continue to monitor discharge. Improve process and implement improvements (capital related). Investigate and take remedial measures. Health and safety risks associated with the operation, maintenance, or construction of wastewater infrastructure. Ensure compliance with legislation and health and safety management plans. Maintain an incidents register. Pump station overflows. Investigate causes and provide additional storage if required. Chemical spills at treatment plants. Ensure procedures are in place for correct identification, storage and handling of chemicals. Ensure appropriate funded areas and storage facilities are in place. The cost of providing, operating and maintaining the schemes is high due to energy requirements. When looking for solutions for small communities, consider alternatives to traditional public wastewater systems. Unless properly maintained there can be problems with foul odour. We will continue to investigate alternatives for the sustainable disposal of sewage sludge. Creates an ongoing need for the disposal of sewage sludge. We will continue to encourage households to reduce the amount of wastewater they produce, for example through reuse of grey water for garden irrigation. How we paid for it Operational funding Capital funding 83% 10% 5% Targeted rates Fees and charges General rates 78% 22% Development and financial contributions Increase in debt 1% Internal charges recovered 1% Subsidies for operating purposes WASTEWATER Annual Report WAIKATO DISTRICT COUNCIL 41
44 WATER SUPPLY What we did We have a growing district and so we continued to address the need for a safe and adequate water supply for our communities, with a particular focus on the central and northern areas of our district this year. We also completed our district-wide water metering programme to help residents understand their usage and to encourage conservation, as well as to assist us to track, locate and fix water loss from the system. Security of supply We progressed work to connect the Ngaruawahia and Huntly water supply networks to provide extra security of supply through our central supply area. Following an earlier project to connect the Hopuhopu/Taupiri and Ngaruawahia systems we decommissioned the Hopuhopu treatment plant to rationalise our resources. Extensions to the water supply network in Pokeno were constructed as required to meet the needs of new subdivision in the area. We constructed new reservoirs in Pokeno and in central districts (in Ngaruawahia, Huntly and Hopuhopu.) We continued to work with other Councils to investigate joint options for future water management. We began a programme to invest in separate teams and equipment for handling our drinking water supply and wastewater services in line with Ministry of Health best practice guidelines. We installed a new supervisory control and data acquisition (SCADA) system to achieve a marked improvement in meeting the testing regimes required for compliance with drinking water standards compared with previous years. Sustainability To facilitate the sustainable supply and consumption of drinking water in our district we completed a programme to install water meters in Raglan, Huntly and Ngaruawahia, and undertook a public awareness campaign about water usage which included distributing trial water meter readings to owners of newly metered properties. All properties in the district connected to our water infrastructure are now metered. Newly metered properties in Raglan, Ngaruawahia and Huntly will switch to water meter charging in the new financial year. Safe water We undertook a number of improvements at our water treatment plants including: z UV treatment system upgrade at Huntly z Equipment renewals of items, including pumps z Health and safety initiatives such as updating our Emergency Response Plans. WATER SUPPLY 42 WAIKATO DISTRICT COUNCIL Annual Report
45 How we did Performance measures result target result Rating Explanation The extent to which Council s drinking water supply complies with: Part 4 of the drinking water standards (bacteria compliance criteria) (no. of zones that comply out of 18) 18 Target met. Part 5 of the drinking water standards (protozoal compliance criteria) (no. of zones that comply out of 18) 18 Water treatment plant upgrades and a new SCADA system have resulted in a significant improvement in compliance. Where Council attends a call-out in response to a fault or unplanned interruption to its networked reticulation system, the following median response times measured: Attendance for urgent call-outs: from the time that Council receives notification to the time that service personnel reach the site. 26 minutes Equal or less than 1hr (60 minutes) 28 minutes Target met. Resolution of urgent call-outs: from the time that Council receives notification to the time that service personnel confirm resolution of the fault or interruption. 76 minutes Equal or less than 4hrs (240 minutes) 88 minutes Target met. Where Council attends a call-out in response to a fault or unplanned interruption to its networked reticulation system, the following median response times measured: Attendance for nonurgent call-outs: from the time that Council receives notification to the time that service personnel reach the site. 1 day Equal or less than five days 1 Target met. Resolution of nonurgent call-outs: from the time that Council receives notification to the time that service personnel confirm resolution of the fault or interruption. 1 day Equal or less than five days 1 Target met. WATER SUPPLY Annual Report WAIKATO DISTRICT COUNCIL 43
46 Performance measures result target result Rating Explanation The total number of complaints received by Council about any of the following (expressed per 1000 connections to the networked reticulation system): Drinking water clarity Drinking water taste Drinking water odour Drinking water pressure or flow 16.6 per 1000 connections Maximum 17 per 1000 connections 22 per 1000 connections We received 317 complaints relating to drinking water in. One common theme concerns the clarity of Huntly s drinking water. Research is being undertaken to determine the cause and how it can be handled to improve results. Continuity of supply The local authority s response to any of these issues The average consumption of drinking water per day per resident within the Waikato district. 240L per annum 250L per annum 270L per annum The installation of water meters means fewer assumptions are required when calculating water consumption. The percentage of real water loss from Council s networked reticulation system. Tuakau 15.3% <20% 14.5 Target met. Pokeno 18.3% <20% 34.2 A data quality issue may have impacted the result. Mid Waikato 22.7% <30% 34.4 This is calculated from a partial data set due to the timing of the district wide meter installation project and includes some assumptions. WATER SUPPLY 44 WAIKATO DISTRICT COUNCIL Annual Report
47 Performance measures result target result Rating Explanation Central Districts 32.5% <25% 33.5 Water loss remains steady at above 30%. Further work is planned to reduce losses to below target. Raglan 25.4% <30% 28.1 Target met. Huntly 23.6% <20% 30.5 This is calculated from a partial data set due to the timing of the district wide meter installation project and includes some assumptions. Southern & Western Districts 26.6% <20% 15.3 Target met. Onewhero 6.5% <25% 10.6 Target met. Port Waikato 71.2% <25% 53.0 A large leak occurred in the Port Waikato supply area which has now been rectified, as System Input volume has returned to typical levels. Te Akau 56% <25% 34.0 This is a small scheme with low demand, water loss as a percent does not accurately represent network performance. Taupiri / Hopuhopu Not measured <10% 0 Not measured This scheme is now included in Central Districts. WATER SUPPLY Annual Report WAIKATO DISTRICT COUNCIL 45
48 Potential significant negative effects Potential negative effect How we are addressing this Potential contamination of the raw water supply. Emergency response plans, operational procedures and monitoring of the raw water supply as per the Water Safety Plan (WSP) are all in place. Discharges of backwash water from treatment plants and chlorinated water from maintenance activities or pipe failures. Compliance with resource consents, the Council s engineering standards and guidelines and maintenance programme. Effects on river ecology caused by river water extraction during low flows. Compliance with resource consents. Depletion of aquifer resources. Compliance with resource consents. Health and safety risks associated with the operation, maintenance, or construction of water supply infrastructure. Ensure compliance with legislation and health and safety management plans. Maintain an incidents register. Insufficient water supplies during times of drought or emergency. Ensure water sources security and identify potential new sources and back up supplies as per the WSP. Drinking water not meeting DWS2005. Continue to monitor water quality and improve process if necessary as per the WSP (may be capital related). Inadequate pressure and flow to fight fires. Carry out modelling/pressure testing and implement remedial works. Water abstraction from streams and rivers can have an adverse effect on the mauri of the water body. Continuing to better identify the cultural significance of water catchments through resource consent conditions. Insufficient water available during times of drought and emergencies. Implement conservation measures and prioritise use for public health requirements. How we paid for it Operational funding Capital funding 90% Targeted rates 76% Increase in debt 5% 3% 1% General rates Internal charges recovered Fees and charges 23% 1% Development and financial contributions Other dedicated capital funding WATER SUPPLY 1% Local authorities fuel tax, fines, infringement fees and other receipts 46 WAIKATO DISTRICT COUNCIL Annual Report
49 ORGANISATIONAL SUPPORT What we did Business process improvements We continued to review and upgrade our business processes and our use of technology with a focus on improving community engagement and customer service efficiencies. We expanded our range of online services for residents, ratepayers, and developers. For example, we provided more in-depth access to our geospatial data by cataloging it, and publishing web maps enabling customers to visualise our District Plan and locate things like underground pipes. We also progressed our three-dimensional GIS (Geographical Information Systems) capability and will be making this publicly available in the near future. Other developments mean property owners can now submit a building consent application electronically and track its progress online, and residents can make a range of online requests covering dogs and dog ownership, and library services including book requests and renewals. We redesigned our rates and water invoices to make them easier to read and understand, added an online facility for ratepayers to apply for rates and water invoices to be ed to them and progressed development of systems to provide credit card and pay wave at all our public counters. the potential for more shared services in procurement, including a streamlined pre-qualification process for Council contractors to ensure they have effective health and safety management systems and hold relevant insurance. Health and safety programme We complied with all relevant legislation and safety standards, and continued to enjoy good results from our zero harm approach to health and safety to develop and retain a culture of health and safety awareness. While we have experienced three lost time injuries in the past year, awareness of the need to remain vigilant has risen throughout our workforce. We expanded our programme with a strong emphasis on wellbeing, offering personal health testing, annual flu vaccinations, regular on-site visits from an occupational health nurse, and access to a new online service designed to support staff to maintain good physical and mental health. We have retained our tertiary accreditation in the ACC Workplace Safety Management Practices programme. How we paid for it Operational funding We continued to seek efficiencies through shared services with other councils. For example, we moved our shared staff recruitment service to a new online provider offering more functionality, and are now examining shared learning and development opportunities. We also undertook a series of workshops and investigations to identify the value of a collaborative approach to geospatial services and established a prototype system that could collate and present data from different councils through one web portal serving the whole region. (See also page XX for information about the work of Local Authority Shared Services Limited that we jointly own with 11 other local authorities in the region.) Procurement and contract management We reviewed and streamlined our procurement processes and introduced an electronic purchase order system to reduce our procurement paperwork. We saved $426,000 through a variety of initiatives including increased procurement through MBIE-led all of government contracts. We also investigated Capital funding 93% 6% 1% 97% 3% Internal charges recovered Local authorities fuel tax, fines, infringement fees and other receipts General rates Decrease in debt Gross proceeds from sale of assets ORGANISATIONAL SUPPORT Annual Report WAIKATO DISTRICT COUNCIL 47
50 PROGRESS TOWARDS COMMUNITY OUTCOMES The following tables outline the progress we ve made towards the community outcomes we seek as a result of the Council s work programmes. Governance Community outcomes Progress People Economy Energy To ensure that our diverse community is represented in a democratically accountable and respectful manner. To ensure that decisions are underpinned by sound financial governance. To ensure that decisions and processes take into account both short and long term impacts on our customers and partners. A new Council was elected in. The contact details of our elected members are available on our website and via the call centre. All minutes of open meetings were made available to the public via our website. Where a decision significantly impacts our customers, we have sought the opinions of our communities. Consultation on the Annual Plan wastewater issue was a good example of this. Sustainable communities Community outcomes Progress People To provide our customers and partners with opportunities for engagement thereby providing input to the decision making process. We have engaged with our communities on over 30 plans, bylaws, projects and initiatives in a range of ways from formal submission procedures to open days, public meetings, and market days, and through social media. People To ensure Council and our communities are resilient and have the capability to respond, manage and recover from emergencies. We have 120 staff trained in civil defence emergency management. Nine community response plans have either been finalised or are in the development stage. People To build community capacity by encouraging voluntary and community-based organisations to provide activities and services. We have committed grants of more than $750,000 to organisations that provide services to our communities relating to emergency response, education and community projects. People To ensure that our open spaces are safe and well maintained and offer opportunities for a wide range of recreational, cultural and community activities. Results from our annual customer survey showed that our customers are happy with the parks and reserves that we provide. Earthworks have begun on the development of sportsfields on the Tamahere Recreation Reserve. People To ensure the Council provides safe, accessible and well-maintained community and leisure facilities and general properties which contribute to the community s recreational, economic and cultural needs. Of those surveyed through our customer satisfaction survey, 91% of respondents are satisfied with their local pool facility, and 92% of customers in Council housing for the elderly are satisfied with their housing service. This is an increase from 86% and 75% respectively. COMMUNITY OUTCOMES Economy To ensure that a seamless consistent quality service is provided to our customers via a range of channels. Our customer satisfaction survey shows we have not met some of our targets relating to customer service however we have made improvements on last years results. The customer satisfaction survey showed that customers are satisfied with our library services. When engaging with our communities, we continue to use a range of methods including social media, our website, letter drops, open days and the Link newsletter. 48 WAIKATO DISTRICT COUNCIL Annual Report
51 Community outcomes Progress Economy Energy Energy Tourism in the district is enhanced and Council s processes and infrastructure support and facilitate new and existing business. To ensure that we are accountable to our customers for our outcomes. Restoration, protection and enhancement of natural areas in the district to increase natural habitat and biodiversity. Tourism expenditure in our district in the March 2017 year was estimated at $112m compared with $85m in the year to March We support Hamilton & Waikato Tourism, an organisation that supports tourism growth throughout the region. A success in this area was a successful application to the Government s $1b housing infrastructure fund. All minutes from open meetings were made publicly available via our website. We also made publicly available the quarterly reports outlining progress against our organisational goals. We completed the first of a four-year Lake Rotokauri restoration programme including fencing boundaries and planting native species. Sustainable environment Community outcomes Progress People To ensure that animals are kept in a way that protects their well-being and minimises danger and public nuisance, and provide animal owners with education regarding their responsibilities. We achieved two of our three performance measures relating to animal control. Although some parts of our district cannot be reached within an hour s travel time, we still met our goals to be onsite within an hour for 95 per cent of emergency animal control call-outs. The Dog in Libraries programme was also launched, helping children gain confidence in reading while educating them about dogs. People To ensure that building regulations and standards are met so that people living and working in buildings are safe. We met all of our performance measures relating to safe buildings in our district. People To ensure that development enhances the wellbeing and safety of the community, and that people have the opportunity to participate in the strategic and district planning process. The community have the opportunity to be engaged in over 30 projects throughout the year. Key projects included the consultation on the wastewater issue through the Annual Plan, the Freedom Camping Bylaw and Easter Trading Policy. People To ensure communities are well informed about the effects of waste and opportunities they have to reduce waste. In our central and southern areas we reduced the amount of refuse we sent to landfill by more than 1,000 tonnes, from 7,019 to 5,995 tonnes. People To ensure that activities are managed so that our communities are healthy and safe, legislative requirements are met and nuisance is managed. We registered and inspected or audited 256 food premises, handled 322 alcohol licensing applications, 259 contaminated land property information requests, and responded to 1,212 noise complaints. Economy To ensure that timely and accurate information and efficient processes and provides to people planning to build on or purchase a property. We are developing a new digital back-of-house system to enable greater effeciencies in the handling building consents. The system is now ready to trial with selected customers before being rolled out. Economy Energy Energy To ensure sustainable growth is encouraged in appropriate locations supported by well-planned essential services. To ensure that planning controls assist in protecting cultural heritage and the natural and physical environment. To ensure that our waste and recycling services are efficient and effective and protect our natural environment. We continued to make good progress with the review of the District Plan. Areas of growth include Tamahere, Te Kauwhata, Horotiu, Tuakau and Pokeno. We continued to make good progress with the review of the District Plan. This is scheduled to be publicly notified in The kerbside collection in the north experienced some issues due to a new contractor being unfamilar with the collection area. The issue has since been resolved. 96% of complaints were responded to within the required timeframes. COMMUNITY OUTCOMES Annual Report WAIKATO DISTRICT COUNCIL 49
52 Roading Community outcomes Progress People Economy Energy To ensure that the district is easy and safe to get around and alternative transport options are available. To ensure that transport infrastructure is planned at a rate to consider growth and demand in a cost effective manner. To ensure that the network is well maintained and negative environmental effects are mitigated. We have undertaken work to improve road safety by increasing road widths and improving visibility. We have undertaken a process to engage with our northern communities to determine their transport needs and what infrastructure will need to be developed to accommodate for the growth in those areas. During the past year we have re-surfaced 115km of sealed roads in the district and completed 18km of road strengthening work. Stormwater Community outcomes Progress People Economy Energy To ensure that the Council s water infrastructure supports safe and healthy conditions and conforms to established public health standards. To ensure that the waters infrastructure networks are managed and maintained to ensure it is both cost effective and reliable, and meets water industry best practice. To ensure that the water infrastructure network is managed effectively to minimise wastage and ensures that water is sustainably and appropriately collected, treated and disposed of to protect the environment. There are no instances where flooding from our stormwater network occurred in the district. All performance targets relating to stormwater activity were met. We undertook a schedule of minor upgrades across the district, installing new pipes to increase capacity where required. In Pokeno we continued to oversee development-led extensions of the stormwater network, and riparian planting beside streams, to ensure that infrastructure and stormwater management keeps up with growth in the area. COMMUNITY OUTCOMES 50 WAIKATO DISTRICT COUNCIL Annual Report
53 Wastewater Community outcomes Progress People Economy Energy To ensure that the Council s water infrastructure supports safe and healthy conditions and conforms to established public health standards. To ensure that the waters infrastructure networks are managed and maintained to ensure it is both cost effective and reliable, and meets water industry best practice. To ensure that the water infrastructure network is managed effectively to minimise wastage and ensures that water is sustainably and appropriately collected, treated and disposed of to protect the environment. We have budgeted to invest in separate teams and equipment for drinking water supply and wastewater services in line with Ministry of Health best practice guidelines. In December we started a $1.76m programme of works to improve our current network. We have also budgeted to invest in separate teams and equipment for drinking water supply and wastewater services in line with Ministry of Health best practice guidelines. Following consultation with 11,000 of our ratepayers who pay for wastewater services, we adopted a new Annual Plan for 2017/18 to broaden this works programme to mitigate the risk of wastewater overflows, with a particular focus on protecting waterways and environmentally sensitive areas. Water supply Community outcomes Progress People Economy Energy To ensure that the Council s water infrastructure supports safe and healthy conditions and conforms to established public health standards. To ensure that the waters infrastructure networks are managed and maintained to ensure it is both cost effective and reliable, and meets water industry best practice. To ensure that the water infrastructure network is managed effectively to minimise wastage and ensures that water is sustainably and appropriately collected, treated and disposed of to protect the environment. Water was treated to a safe standard and as a result we achieved our two performance targets relating to drinking water compliance. We progressed work to connect the Ngaruawahia and Huntly water supply networks to provide extra security of supply through our central supply area. Extensions to the water supply network in Pokeno were constructed as required to meet the needs of new subdivision in the area. To facilitate the sustainable supply and consumption of drinking water in our district we completed a programme to install water meters in Raglan, Huntly and Ngaruawahia, and undertook a public awareness campaign about water usage which included distributing trial water meter readings to owners of newly metered properties. COMMUNITY OUTCOMES Annual Report WAIKATO DISTRICT COUNCIL 51
54 FINANCIAL PATHWAY TE ARA PUUTEA From the Chairman strategy and finance and GM Strategy and support Council controlled organisations Strada Corporation Limited Waikato Regional Airport Limited Waikato Local Authority Shared Services Limited Waikato District Community Wellbeing Trust 52 WAIKATO DISTRICT COUNCIL Annual Report
55 From the Strategy & Finance Committee Chair and General Manager Strategy & Support Council has had another excellent year of financial performance consistent with the desired outcomes from Council s financial strategy. Budgeted income for this financial year was $119.7 million, against which actual income earned was $134.9 million, a positive variance of $15.2 million. Vested assets, which are not a budgeted item, account for the majority of the variance, along with additional subsidies to support storm weather events and grants carried over from prior years. The Council s operational expenditure budget was $104.9 million of which actual operational expenditure was $113.4 million. This includes asset write-offs of $4.7 million which are not a budgeted item. Taking this into account the Council incurred $3.8 million more than what was budgeted for. This variance against budget relates mainly to wastewater reticulation maintenance works and emergency works associated with storm weather events. Capital programmes were budgeted at $48.1 million for. In addition to this, budget for projects that had not been fully completed during totalled $26.2 million (including $5.2 million of developer led projects). Therefore, although when compared to the Annual Plan budget the completed works sits at 100 per cent of budget (spend of $48.2 million) the budget usage including progression of prior years work was approximately 65 per cent. Variance in capital work programmes can arise for various reasons; savings in construction prices, progression and related timing of subdivision activity within the district, adverse weather resulting in delays, public consultation timeframes and negotiations over land purchase. This year $26.4 million of capital works budget will be carried forward to the 2017/18 financial year. While this is slightly higher than the carry forward amount in the prior year, the majority of these projects are in progress but were not completed before the end of the financial year. Debt at the end of June 2017 was $80 million, marginally higher than the forecast of $79.4 million. In addition to specifying debt limits, the Council s financial strategy stipulated benchmarks for rates increases going forward. These measures are in place to ensure accountability to the public with respect to rates increases and management of debt. The Council were successful in achieving both the rates affordability and debt affordability measures set for. Cr Janet Gibb Chair Strategy & Finance Tony Whittaker GM Strategy & Support FINANCIAL PATHWAY Annual Report WAIKATO DISTRICT COUNCIL 53
56 Council-controlled organisations The Council operates four Council Controlled Organisations (CCO s). These organisations independently manage facilities and deliver services, with the exception of Strada Corporation Limited which wound up activities during the financial year. The following information explains what the organisations do and how their performance is measured. Strada Corporation Limited Strada Corporation Limited (formerly Tanlaw Corporation prior to 1 July 2009) was established in 1992 as a wholly owned Council Controlled Organisation (CCO). The Council wished to separate the planning and development of its work programme from the physical works. Strada was established to achieve this and to operate as a profitable business for the Council s benefit, and ultimately Waikato District ratepayers. The company generally traded profitably and provided significant dividends that supplemented the council s income. However, in recent years in a more competitive market Strada had difficulty securing maintenance contract work and when the opportunity arose during to sell Strada s joint venture the decision was made to wind up operations. The operational assets were sold during and liabilities extinguished. The company will remain active until the warranty requirements under the sale of the joint venture are satisfied. Waikato Regional Airport Limited In December 1995, the Council along with four other local authorities purchased the Crown s 50 per cent shareholding in the Waikato Regional Airport Limited. The purchase increased the Council s shareholding to per cent. At the time the Council considered the airport to be a significant infrastructural asset for the region and important to economic growth and development. The Council s shareholding is considered a strategic asset. The airport also operates a tourism subsidiary which aims to promote the region to tourists. The Council contributes separately to this entity. The core purpose and key objective for the year has been to operate the airport in an efficient and compliant manner whilst maintaining a viable aeronautical business. The group had an operating surplus of $4.1 million during the year due mostly to increased value of the property portfolio. The group achieved most of the financial targets and all of the non-financial targets included in their Statement of Intent. FINANCIAL PATHWAY 54 WAIKATO DISTRICT COUNCIL Annual Report
57 Agreed measures Statement of intent Actual Target met Earnings before interest, taxation and depreciation (EBITDA). $2.279M $2.443M Net surplus/(deficit) after tax. ($366K) ($305K) Net profit after tax to shareholders' funds. 0.01% (0.42%) Net profit after tax to total assets. 0.00% (0.30%) Percentage of non-landing charges revenue to total revenue % 81.00% Total liabilities/shareholders' funds: (debt/equity ratio). 26:74 20:80 Net operating cashflow. $1.594M $5.247M Net investing cashflow. ($1.540M) ($9.292M) Funding Titanium Park Limited. ($505K) $3.161M Net cashflow. ($451K) ($884K) Net debt. $8.287M $10.994M Applicable to parent company (airport) operations only Interest rate cover FINANCIAL PATHWAY Annual Report WAIKATO DISTRICT COUNCIL 55
58 Waikato Local Authority Shared Services Limited Local Authorities of the Waikato region established the Local Authority Shared Services (WLASS) Limited during 2005/2006. The following 12 local authorities of the region jointly own the company: z Hamilton City Council z Hauraki District Council z Matamata-Piako District Council z Otorohanga District Council z Rotorua District Council z South Waikato District Council z Taupo District Council z Thames-Coromandel District Council z Waikato District Council z Waikato Regional Council z Waipa District Council z Waitomo District Council These local authorities have worked closely together over the years on mutually beneficial joint projects. The Councils believe the company will generate saving through economies of scale and through additional purchasing power and the ability to recover costs. WLASS is in operation to provide information collection and management at a lower aggregate cost, these include: z Shared valuation data services; z Waikato regional transport model; z Waikato regional aerial photography. The Waikato Mayoral Forum has five working parties which investigate collaborative opportunities in the areas of governance structures, planning, three waters, roading and economic development. Each working party is led by a Council Chief Executive in conjunction with a group of Mayors/Chairs from the Waikato Mayoral Forum. WLASS is available as a support entity to assist these working parties. Shared insurance and procurement opportunities are also progressed through WLASS. Agreed measures Statement of intent Target met Joint procurement initiatives will be investigated and implemented. Minimum of three new initiatives investigated. Implemented initiatives shall provide savings or improved levels of service. New suppliers are awarded contracts through a competitive tender process. Priorities for collaboration are developed and high priority projects implemented. Minimum of three collaborative projects identified Business cases of value are developed for approval and implemented. Existing contracts are managed and renegotiated as required. Contracts register is maintained. Contracts for renewal are tested for competitiveness and renegotiated or tendered through a competitive process. The company shall maintain a positive cash flow position. Monthly financial statements show a positive cash flow. FINANCIAL PATHWAY Administration expenditure shall be managed and monitored. Administration expenditure shall not exceed budget by more than 5% without board approval. 56 WAIKATO DISTRICT COUNCIL Annual Report
59 Agreed measures Six monthly reports are provided to shareholders. Statement of intent A written report on the business operations and financial position to be provided every six months. Every second report is the annual report with statutory requirements adhered to. Target met The company shall provide administrative support to the Mayoral forum. Mayoral forum is updated on the progress of each work stream. Approved invoices for mayoral forum projects are paid by the 20th of the month following receipt. The shared valuation data services is reliable, well maintained and available. SVDS is available to users at least 99% of normal working hours. SVDS advisory group meets at least six monthly. Key performance indicators of the insurance brokerage contract are achieved. All stakeholders are informed about the roading accord technical alliance (RATA) projects and achievements. Sub-regional data collection contracts deliver good quality asset data. Waikato regional transport model is reliable, well maintained and available. Strategic advice received is assessed as satisfactory in the annual shareholder survey. Day-to-day service is assessed as satisfactory in the annual shareholder survey. Reports are provided six monthly. Reports include a summary of savings. Councils participate in the Annual Forward Works Programme tour. Report provided on tour outcomes. Any data issues are resolved with incidents reported. Modelling reports requested are actioned by the supplier within the agreed scope, time and budget. A status report from RATA on the model status is provided six monthly. The quality complies with NZTA guidelines and is independently reviewed when updated. Results will be reported on 26 August so fall outside the financial year. Waikato Building consent group actively pursue improvements. Internal audits are completed annually for each group member. Provide a joint quality assurance system that meets statutory requirements. Report six monthly on the group s activities. Stakeholders are kept informed about FutureProof projects and achievements. Six monthly reports provided. Shareholders are satisfied with the performance of WLASS. A shareholder survey is conducted and reported on annually. In progress. Shareholders are informed of the benefits being provided. Information on non-financial and financial benefits are reported on six monthly. FINANCIAL PATHWAY Annual Report WAIKATO DISTRICT COUNCIL 57
60 Waikato District Community Wellbeing Trust In 2010, the Waikato Foundation Trust proposed to distribute its capital fund to projects or trusts of a community nature which will result in long term benefits to as many people as possible within the geographical area of the three constituent territorial authorities; namely the Hamilton City Council, the Waikato District Council and the Waipa District Council. The Waikato District Community Wellbeing Trust was established to receive funds from the Waikato Foundation Trust which wound up in $2.56 million was transferred to the Waikato District Community Wellbeing Trust during 2011/12. The Trust distributes funds that: z Promote the social, environmental and cultural wellbeing of the Waikato district and its communities; and z Deliver on the aspirations and community outcomes of the Waikato district identified and promoted by the community and endorsed by Waikato District Council. The Trust approved the following grants during : z Ngaruawahia Community House $13,557 z Menzshed $10,000 z Ngaruawahia Community Board $10,000 z Turangawaewae Rugby League Club $15,000 z Whitikahu Hall $15,000 z Taupiri Rugby Football Club $15,000 z Pukemokemoke Bush Trust $17,193 A summary of the trust performance for the year is provided in the table below: Agreed measures Statement of Intent Target met Governance: To comply with the terms of the Trust Deed and in particular with the duties of the Trust as set out in clause 11 of the Deed. Undertake an annual legal review of compliance with the Trust Deed no later than two months after the end of each financial year. Investment: To adhere to the Trust s Management of Investment Portfolio and Distribution Policy. To review on an annual basis the investment mandate and the performance of the portfolio manager. At each quarterly meeting review compliance with the Trust s Management of Investment Portfolio and Distribution Policy during that quarter. FINANCIAL PATHWAY Fund disbursement: As per the Management of Investment Portfolio and Distribution Policy, to distribute a total grant disbursement that does not exceed 50% of the accumulated retained net income after allowing for accumulated expenses, inflation movements and prior year distributions. A distribution process is undertaken that distributes the annual fund to eligible recipients in accordance with funding targets set by the Trustees in accordance with the Management of Investment Portfolio and Distribution Policy for the current year. Six-monthly reports are received from all successful applicants within the required timeframe. 58 WAIKATO DISTRICT COUNCIL Annual Report
61 Returns on investment Limit results Our performance Financial 4% 6% Property 10% 9% Returns on equity as follows: Strada Corporation Ltd (before capital return) 9% 16% Waikato Regional Airport Ltd 0% 0% Civic Financial Services Ltd 0% 0% Local Authority Shared Services Ltd 0% 0% Waikato District Community Wellbeing Trust 0% 0% FINANCIAL PATHWAY Annual Report WAIKATO DISTRICT COUNCIL 59
62 NGA RAARANGI PUUTEA Statement of comprehensive revenue and expense Statement of financial position Statement of changes in net assets/equity Statement of cash flows 134 Statement of reserve funds Notes to the financial statements - detailed contents opposite Other legislative disclosures - detailed contents opposite 60 WAIKATO DISTRICT COUNCIL Annual Report
63 CONTENTS 70 Note 1 Notes to the financial statements Statement of accounting policies 70 Note 2 Rates 73 Note 3 Finance revenue and costs 75 Note 4 Other revenue 76 Note 5 Exchange and non-exchange revenue 77 Note 6 Employee costs 78 Note 7 Depreciation and amortisation expense by group of activity 78 Note 8 Other expenses and losses 79 Note 9 Income tax 80 Note 10 Cash and cash equivalents 81 Note 11 Recoverables and receivables 82 Note 12 Inventory 85 Note 13 Cattle 85 Note 27 Reconciliation of total comprehensive income with net operating funding (per funding impact statement) 115 Note 28 Capital commitments and operating leases 115 Note 29 Contingencies 117 Note 30 Related party transactions 118 Note 31 Remuneration 120 Note 32 Severance payments 122 Note 33 Events after balance date 123 Note 34 Financial Instruments 123 Note 35 Capital management 132 Note 36 Explanation of major variances against budget 132 Note 37 Insurance of assets 133 Note 14 Other financial assets 86 Note 15 Non-current assets held for sale 89 Note 16 Property, plant and equipment 90 Note 17 Intangible assets 103 Note 18 Investment property 105 Note 19 Investment in joint venture 106 Note 20 Payables, taxes and transfers 107 Note 21 Employee entitlements 108 Note 22 Borrowing 109 Note 23 Provisions 111 Note 24 Derivative financial instruments 112 Note 25 Revaluation reserve - property, plant and equipment 113 Note 26 Reconciliation of net surplus (deficit) after tax with net cash flows from operating activities Other legislative disclosures Funding impact statement 134 Whole of council 134 Water supply 135 Wastewater 136 Stormwater 137 Roading 138 Sustainable environment 139 Sustainable communities 140 Governance 141 Organisational support 142 Explanation of major variances against budget for funding impact statements 143 Annual report disclosure statement 144 Annual Report WAIKATO DISTRICT COUNCIL 61
64 STATEMENT OF COMPREHENSIVE REVENUE AND EXPENSE For the year ended 30 June 2017 Council Group Note Budget Revenue Rates 2 71,719 73,161 68,749 71,719 68,749 Development and financial contributions 8,547 8,217 9,454 8,547 9,454 Subsidies and grants 19,317 17,541 19,881 19,317 19,881 Finance revenue Other revenue 4 35,152 20,643 42,369 35,724 46,912 Total revenue 134, , , , ,664 Expenses Employee costs 6 26,912 28,028 26,010 27,193 27,589 Depreciation and amortisation expense 7 25,132 24,462 22,683 25,193 23,120 Finance costs 3 3,659 3,588 4,259 3,659 4,416 Other expenses and losses 8 57,700 48,799 59,209 58,356 62,897 Total operating expenses 113, , , , ,022 Operating surplus(deficit) before tax and share of equity accounted investments Share of joint venture s surplus(deficit) 21,488 14,785 28,896 21,079 27, (2,438) Surplus(deficit) before tax 21,488 14,785 28,896 21,079 25,204 Income tax expense (26) Surplus(deficit) after tax wholly attributable to Waikato District Council 21,488 14,785 28,896 21,079 25,230 Other comprehensive revenue and expense Gain(loss) on property revaluations 16 64,849 25,507 12,072 64,849 12,000 Revaluation reserve landfill 23 (204) - (104) (204) (104) Financial assets at fair value through other comprehensive income Other comprehensive revenue and expense (net of tax) 10, , ,807 25,507 11,977 74,807 11,905 Total comprehensive revenue and expense for the year The accompanying notes form part of these financial statements. Explanations of major variances against budget are provided in Note ,295 40,292 40,873 95,886 37, WAIKATO DISTRICT COUNCIL Annual Report
65 STATEMENT OF FINANCIAL POSITION As at 30 June 2017 Council Group Note Budget Assets Current assets Cash and cash equivalents 10 3,705 10,418 4,010 4,473 6,522 Receivables from exchange transactions 11 3,433 13,457 6,554 3,342 7,003 Recoverables from non-exchange transactions 11 5,912 9,142 6,465 5,912 6,465 Prepayments Other financial assets 14 10, ,629 3,320 Inventory Cattle Non-current assets held for sale ,864 Total current assets 24,830 33,609 18,193 29,172 26,909 Non-current assets Investment in CCO s and other similar entities 14 13,716 7,359 7,359 13,016 2,859 Investments in other entities 14 1,219 1,346 1,253 1,729 1,878 Property, plant and equipment 16 1,720,737 1,679,519 1,626,407 1,720,737 1,626,407 Intangible assets 17 5,981 5,623 5,399 5,981 5,399 Investment property Investment in joint venture Total non-current assets 1,742,143 1,694,292 1,640,893 1,741,953 1,637,018 Total assets 1,766,973 1,727,901 1,659,086 1,771,125 1,663,927 Liabilities Current liabilities Payables under exchange transactions 20 16,548 33,908 23,602 16,646 23,865 Taxes and transfers payable 20 1,128 1,244 1,090 1,128 1,133 Derivative financial instruments Borrowing 22 20,000 24,820-20,000 - Employee entitlements 21 2,790 3,150 3,184 2,790 3,251 Provisions Total current liabilities 40,809 63,478 28,650 40,912 29,033 Non-current liabilities Derivative financial instruments 24 4,719 2,052 5,456 4,719 5,456 Borrowing 22 60,000 54,634 60,000 60,000 60,000 Employee entitlements Provisions 23 2,012 1,645 1,772 2,012 1,772 Deferred tax liabilities Total non-current liabilities 66,830 58,534 67,397 66,830 67,397 Total liabilities 107, ,012 96, ,742 96,430 Net assets 1,659,334 1,605,889 1,563,039 1,663,383 1,567,497 Net assets/equity Accumulated comprehensive revenue and expense 1,029,070 1,024,526 1,004,834 1,030,204 1,006,334 Other reserves 630, , , , ,163 Total net assets/equity 1,659,334 1,605,889 1,563,039 1,663,383 1,567,497 The accompanying notes form part of these financial statements. Explanations of major variances against budget are provided in Note 36. Annual Report WAIKATO DISTRICT COUNCIL 63
66 STATEMENT OF CHANGES IN NET ASSETS / EQUITY For the year ended 30 June 2017 Council Group Budget Balance at the beginning of the year Accumulated comprehensive revenue and expense 1,004,834 1,005, ,246 1,006, ,413 Share of joint venture s earnings Other reserves Revaluation 562, , , , ,328 Restricted ,020 2,804 Council-created 22,482 15,239 19,919 22,482 19,919 Special rates and user pays (3,331) (3,292) (1,305) (3,331) (1,305) Capital replacement fund 13,331 8,363 14,897 13,331 14,897 Development contributions (36,625) (38,529) (30,400) (36,625) (30,400) Fair value through other comprehensive revenue and expense Balance at 1 July as previously reported 1,563,039 1,565,597 1,522,166 1,567,497 1,530,362 Comprehensive revenue and expense for the year Accumulated comprehensive revenue and expense Surplus(deficit) after tax 21,488 14,785 28,896 21,079 27,668 Share of joint venture s retained earnings (2,438) Other reserves Revaluation 64,849 25,507 12,072 64,849 12,000 Revaluation landfill (204) - (104) (204) (104) Fair value through other comprehensive revenue and expense Total comprehensive income for the year wholly attributable to Waikato District Council 10, , ,295 40,292 40,873 95,886 37,135 Transfers to (from) accumulated comprehensive revenue and expense Accumulated comprehensive revenue and expense 2,748 4,048 11,692 2,791 13,019 Other reserves Revaluation (1,294) - (4,582) (1,406) (5,981) Restricted Council-created 4,044 (1,139) 2,563 4,044 2,563 Special rates and user pays (2,854) (1,235) (2,026) (2,854) (2,026) Capital replacement fund (1,566) 317 (1,566) Development contributions (2,968) (1,799) (6,225) (2,968) (6,225) Total transfers to (from) accumulated comprehensive revenue and expense Balance at 30 June wholly attributable to Waikato District Council The accompanying notes form part of these financial statements. Explanations of major variances against budget are provided in Note ,659,334 1,605,889 1,563,039 1,663,383 1,567, WAIKATO DISTRICT COUNCIL Annual Report
67 STATEMENT OF CHANGES IN NET ASSETS / EQUITY For the year ended 30 June Continued Council Group Budget Represented by net assets/equity at the end of the year Accumulated comprehensive revenue and expense 1,029,070 1,024,526 1,004,834 1,030,204 1,006,334 Share of joint venture s earnings Other reserves Revaluation 625, , , , ,243 Restricted ,096 3,020 Council-created 26,526 14,100 22,482 26,526 22,482 Special rates and user pays (6,185) (4,527) (3,331) (6,185) (3,331) Capital replacement fund 13,648 8,487 13,331 13,648 13,331 Development contributions (39,593) (40,328) (36,625) (39,593) (36,625) Fair value through other comprehensive revenue and expense Balance at 30 June wholly attributable to Waikato District Council 10, , ,659,334 1,605,889 1,563,039 1,663,383 1,567,497 The accompanying notes form part of these financial statements. Explanations of major variances against budget are provided in Note 36. Annual Report WAIKATO DISTRICT COUNCIL 65
68 STATEMENT OF CASH FLOWS For the year ended 30 June 2017 Council Group Note Budget Cash flows from operating activities Receipts Receipts from rates revenue 72,164 67,179 69,848 72,164 69,848 Subsidies received 19,500 18,217 20,628 19,500 20,628 Contributions received 9,221 8,618 18,023 9,221 18,023 Receipts from other revenue 21,866 23,247 16,485 22,340 20,156 Interest received Dividends received Income tax refund Goods and service tax (net) (895) 528 (927) Payments Payments to employees (27,827) (27,885) (25,614) (28,084) (27,378) Payments to suppliers (54,858) (48,970) (49,893) (55,566) (52,676) Interest paid (3,566) (3,588) (4,087) (3,566) (4,261) Income tax paid Net cash flows from (used in) operating activities 26 37,867 37,218 45,051 36,684 44,145 Cash flows from investing activities Proceeds from the sale of property, plant and equipment 1, ,008 1,884 3,886 Proceeds from the sale of investments 3, ,311 5,783 Proceeds from the sale of non-current assets held for sale ,878 - Community loan repayments received Receipts from repayment of advance ,692 Purchase of intangible assets (1,214) (819) (538) (1,214) (538) Purchase of property, plant and equipment (52,379) (55,574) (58,913) (52,379) (57,705) Acquisition of investments (10,978) (242) (160) (13,388) (5,425) Net cash flow from (used in) investing activities (58,172) (56,418) (58,430) (58,847) (52,238) Cash flows from financing activities Proceeds from borrowing 20,000 19,142 7,050 20,000 7,050 Repayment from related party Repayment of borrowing (3,250) Net cash flow from financing activities Net increase(decrease) in cash, cash equivalents and bank overdrafts Cash, cash equivalents and bank overdrafts at the beginning of the year Cash, cash equivalents and bank overdrafts at the end of the year The accompanying notes form part of these financial statements. Explanations of major variances against budget are provided in Note ,000 19,142 7,050 20,115 3,800 (305) (58) (6,329) (2,048) (4,293) 4,010 10,476 10,339 6,521 10,815 3,705 10,418 4,010 4,473 6, WAIKATO DISTRICT COUNCIL Annual Report
69 STATEMENT OF RESERVE FUNDS For the year ended 30 June 2017 Reserves showing as negative have a debit balance and are mainly for development contributions and structure plan reserves. These reserves are in place to monitor the income and costs associated with development and growth. Often Council must incur the cost of works for base infrastructure before development contributions are received. Essentially the negative balance for a reserve is the amount borrowed internally to fund the work ahead of income being received. A negative reserve is used instead of an internal loan because the amount is repaid by income received rather than a loan repayment regime. Like a loan, interest is charged and is added to the reserve balance for repayment from contributions received over time. Reserve Conservation fund Raglan Harbour reserve Housing for the elderly Plant reserve Lake Hakanoa Caravan Park reserve Raglan Kopua Holiday Park reserve Wainui Reserve farm Hillary Commission grants Creative NZ grant Disaster recovery fund Hillary Commission loans Purpose To fund expenditure items for conservation purposes. Council took over assets from the Raglan Harbour Board. Any income or expenditure on these properties is kept separate from general funds. Income from housing for the elderly is put aside for use on the properties involved. Reserve used for control of expenditure and sale proceeds for vehicle and other plant running and maintenance costs. Income and expenditure for the Lake Hakanoa Caravan Park at Huntly is kept separate. The camp operation is self-funding. Income and expenditure for Kopua Camp at Raglan is kept separate. The camp operation is self-funding. Income and expenditure for Wainui Reserve farm operations is kept separate. The farm operation is self-funding and surpluses are used towards projects at Wainui Reserve. These funds are committed to a club development programme for the future. The balance from Creative Communities New Zealand to be re-distributed as grants to suitable candidates. Fund set aside for use in the event of a disaster. Remaining funds and interest credits built up from Council s contribution to match Hillary Commission loans used in the past to assist sporting organisations. All loans have been repaid. Related activities Sustainable environment Sustainable communities Sustainable communities Organisational support Sustainable communities Sustainable communities Sustainable communities Sustainable communities Sustainable communities Organisational support Sustainable communities Opening Balance 1 July 2016 The accompanying notes form part of these financial statements. Explanations of major variances against budget are provided in Note 36. Transfers into fund Transfers out of fund Closing Balance 30 June (12) (463) (244) (25) 241 1,360 (1,318) (125) ,471 (1,178) 1, ,178 (3,134) ,307 2,020 (2,844) Annual Report WAIKATO DISTRICT COUNCIL 67
70 STATEMENT OF RESERVE FUNDS For the year ended 30 June 2016 Continued Reserve Purpose Related activities Opening Balance 1 July 2016 Transfers into fund Transfers out of fund Closing Balance 30 June 2017 North Waikato development reserve Remaining funds with interest credits from the Department of Corrections for use to assist the local community. Sustainable communities Hamilton East property proceeds Proceeds from the sale of the Hamilton East property held separate for property related purposes. Organisational support 2, ,308 Hakarimata Restoration Trust A restricted reserve for Hakarimata Hills Reserve Trust to record all trust operations. Sustainable environment Development fund (from shares sold) Reserve representing the share of the Auckland Airport Shares received by the former Franklin District Council and transferred to Waikato District Council on part amalgamation in Organisational support 1,583 - (897) 686 LTCCP contribution reserve Reserve created on amalgamation of part of the Franklin District Council with Waikato District Council to assist with operational funding. Organisational support 2,779 - (722) 2,057 Landfill aftercare contribution Reserve created on amalgamation of part of the Franklin District Council with Waikato District Council to assist with aftercare costs for closed landfills transferred. Sustainable environment (50) 296 Structure plan non-growth reserve Reserve to provide funding for the nongrowth element of Structure Plan development. Organisational support Waste minimisation reserve To manage waste minimisation grants and qualifying expenditure. Sustainable environment 331 1,063 (1,061) 333 Huntly College Jubilee Award A restricted reserve for the interest income to be used as educational sponsorship. Sustainable communities 13 - (1) 12 Frances Paki Trust A restricted reserve in memory of Frances Paki of Huntly. Interest income to be used as sponsorship for educational purposes. Sustainable communities The accompanying notes form part of these financial statements. Explanations of major variances against budget are provided in Note WAIKATO DISTRICT COUNCIL Annual Report
71 Reserve Purpose Related activities Opening Balance 1 July 2016 Transfers into fund Transfers out of fund Closing Balance 30 June 2017 Mungall Scholarship Trust A restricted reserve in memory of Agnes Simpson Mungall. Interest income to be used for educational sponsorship. Sustainable communities Huntly social services A restricted reserve created by the transfer of funds from the former Huntly Social Services Co-Ordinating Committee Inc when it was wound up in Sustainable communities Sundry reserves Sundry reserves for township development and other operational purposes. Sustainable communities 6,900 21,211 (6,709) 21,402 Targeted rate reserves operational Reserves to monitor operational costs in relation to special rates and user pays. Stormwater, Sustainable communities, Sustainable environment, Wastewater, Water supply (3,331) 3,595 (6,449) (6,185) Replacement funds Reserves where amounts equivalent to funded depreciation are held for use on capital renewals work. Roading, Stormwater, Sustainable communities, Sustainable environment, Wastewater, Water supply, Organisational support 13,331 18,275 (17,958) 13,648 Revaluation reserves Non-cash reserves representing the increases or decreases in the value of infrastructural assets that are periodically revalued. Roading, Stormwater, Sustainable communities, Sustainable environment, Wastewater, Water supply, Organisational support 562,131 64,849 (1,498) 625,482 Capital rates and contributions Reserves for structure plans, development contributions, financial contributions and capital targeted rates. Roading, Stormwater, Sustainable communities, Sustainable environment, Wastewater, Water supply (32,790) 11,719 (12,989) (34,060) Total reserves 558, ,711 (57,652) 630,264 The accompanying notes form part of these financial statements. Explanations of major variances against budget are provided in Note 36. Annual Report WAIKATO DISTRICT COUNCIL 69
72 NOTES TO THE FINANCIAL STATEMENTS Note 1 STATEMENT OF ACCOUNTING POLICIES Reporting Entity Waikato District Council (the Council) is a territorial local authority governed by the Local Government Act 2002 (LGA) and is domiciled and operates in New Zealand. The relevant legislation governing Council s operations includes the LGA and the Local Government (Rating) Act 2002 (LG(R)A). The Group consists of the ultimate parent Waikato District Council; its 100% owned subsidiary Strada Corporation Limited (Strada) and the Waikato District Community Wellbeing Trust (WBT). Strada had a 50% party to a Joint Venture Agreement, Waikato Quarries Limited. All the entities in which Council has an interest, either directly or through Strada, are incorporated and domiciled in New Zealand. The principal activity of Council is the provision of local infrastructure, local public services and the performance of regulatory functions to the community. Council does not operate to make financial return. Council has designated itself and the Group as public benefit entities (PBE s) for financial reporting purposes. These financial statements of Council and the Group are for the year ended 30 June The financial statements were authorised for issue by Council on 9 October Statement of compliance The financial statements of Council and the Group have been prepared in accordance with the requirements of the LGA and the Local Government (Financial Reporting and Prudence) Regulations 2014 (LG(FRP)R) which include the requirement to comply with generally accepted accounting practice in New Zealand (NZ GAAP). The financial statements have been prepared in accordance with and comply with Tier 1 PBE accounting standards. Presentation currency and rounding The financial statements are presented in New Zealand dollars and all values are rounded to the nearest thousand dollars ($000 s) except for those within sections of narrative which are rounded to the nearest dollar. Standards issued and not yet effective and not early adopted Standards and amendments issued but not yet effective that have not been early adopted and which are relevant to Council and the Group are: Basis of preparation The financial statements have been prepared on the going concern basis and the accounting policies have been applied consistently throughout the period. The financial statements of Strada have been prepared on a realisation basis because its Directors have resolved to sell all its operational assets and extinguish all of its liabilities during the year ended 30 June While the company will remain open after this point in order to receive the final settlement payments in relation to the disposal of the joint venture, it will not remain a going concern. Impairment of revalued assets In April 2017, the XRB issued Impairment of Financial Assets which now includes revalued property, plant and equipment in its scope; previously, only property, plant and equipment assets measured at cost were included. Council will apply this amendment in preparing its financial statements for the 30 June 2018 year onwards. Council will be required to assess at each reporting date whether there is any indication an asset may be impaired. If any indication exists, Council is required to assess the recoverable amount of the asset and recognise an impairment loss if the recoverable amount is less than the carrying amount. Council will therefore be able to impair a revalued asset without having to revalue the entire class of asset to which the asset belongs. 70 WAIKATO DISTRICT COUNCIL Annual Report
73 Interest in other entities In January 2017 the XRB issued new standards for interests in other entities (PBE-IPSAS 34 38). These new standards replace the existing standards for interests in other entities (PBE-IPSAS 6 8). The new standards are effective for annual periods beginning on or after 1 January 2019, with early application permitted. Council plans to apply the new standards in preparing the 30 June 2020 financial statements. Council has not yet assessed the effects of these new standards. Financial instruments In January 2017 the XRB issued PBE-IFRS 9 Financial Instruments. PBE-IFRS 9 replaces PBE IPSAS 29 Financial Instruments: Recognition and Measurement. PBE IFRS 9 is effective for annual periods beginning on or after 1 January 2021, with early application permitted. The main changes under PBE IFRS 9 are: z New financial asset classification requirements for determining whether an asset is measured at fair value or amortised cost. z A new impairment model for financial assets based on expected losses, which may result in the earlier recognition of impairment losses. z Revised hedge accounting requirements to better reflect the management of risk. Council plans to apply the new standards in preparing the 30 June 2022 financial statements. Council has not yet assessed the effects of these new standards. Other changes in accounting policies As a result of the increasing portion of Waikato Regional Airport Limited s (WRAL) balance sheet being carried at fair value, Council are now able to reliably measure its investment in WRAL at fair value. Refer Note 14. There have been no other changes in accounting policies. Summary of significant accounting policies Significant accounting policies are included in the notes to which they relate. Significant accounting policies that do not relate to a specific note are outlined below. Basis of consolidation The consolidated financial statements are prepared by adding together like items of assets, liabilities, equity, revenue and expenses on a line-by-line basis. All significant intra-group balances, transactions, revenues and expenses are eliminated on consolidation. Critical accounting estimates and assumptions In preparing these financial statements, estimates and assumptions have been made concerning the future. These estimates and assumptions may differ from the subsequent actual results. Estimates and assumptions are continually evaluated and are based on historical experience and other factors, including expectations or future events that are believed to be reasonable under the circumstances. The estimates and assumptions that have a significant risk of causing a material adjustment to the carrying amounts of assets and liabilities within the next financial year are discussed below: Infrastructural assets Note 16 provides information about the estimates and assumptions applied in determining the fair value of infrastructural assets. Employee entitlement provisions Note 21 provides information about the estimates and assumptions surrounding the retirement gratuities and long service leave provision. Landfill aftercare provision Note 23 provides information about the estimates and assumptions surrounding the landfill aftercare provision. Goods and services tax All items in the financial statements are stated exclusive of GST except for payables and receivables, which are presented on a GST inclusive basis. When GST is not recoverable as an input tax it is recognised as part of the related asset or expense. The net amount of GST recoverable from, or payable to, the Inland Revenue Department (IRD) is included as part of receivables or payables in the statement of financial position. The net GST paid to, or received from the IRD, including the GST relating to investing and financing activities, is classified as an operating cash flow in the statement of cash flows. Commitments and contingencies are disclosed exclusive of GST. Annual Report WAIKATO DISTRICT COUNCIL 71
74 Budget figures The budget figures are those approved by Council at the beginning of the year in its Annual Plan. The budget figures have been prepared in accordance with NZ GAAP, using accounting policies that are consistent with those adopted in preparing these financial statements. Foreign currency transactions Foreign currency transactions are translated into NZ dollars using the spot exchange rate at the date of the transactions. Foreign exchange gains and losses resulting from the settlement of such transactions and from the translation at year end exchange rates of monetary assets and liabilities denominated in foreign currencies are recognised in the surplus or deficit. Equity Equity is the community s interest in Council and is measured as the difference between total assets and total liabilities. Equity is disaggregated and classified into the following components: z Accumulated funds; z Other reserves revaluation restricted council-created special rates and user pays capital replacement fund development contributions fair value through other comprehensive revenue and expense. Revaluation reserves These reserves relate to the revaluation of property, plant and equipment to fair value. Restricted reserves Restricted reserves are a component of equity generally representing a particular use to which various parts of equity have been assigned. Reserves may be legally restricted or created by Council. Restricted reserves are those subject to specific conditions accepted as binding by Council and which may not be revised by Council without reference to the Courts or a third party. Transfers from these reserves may be made only for certain specified purposes or when certain specified conditions are met. Council-created reserves Council-created reserves are reserves established by Council decisions. Council may alter them without reference to any third party or the Courts. Transfers to and from these reserves are at the discretion of Council. Council and the Group s objectives, policies, and processes for managing capital are explained in nnote 35. Fair value through other comprehensive income This reserve comprises the cumulative net change in the fair value of financial instruments at fair value through other comprehensive income. Cost allocation policy Council has derived the cost of service for each significant activity of Council using the cost allocation system outlined below. Direct costs are those costs directly attributable to a significant activity. Indirect costs are those costs which cannot be identified, in an economically feasible manner, with a specific significant activity. Direct costs are charged directly to significant activities. Indirect costs are charged to significant activities using appropriate cost drivers such as actual usage, staff numbers and floor area. 72 WAIKATO DISTRICT COUNCIL Annual Report
75 Note 2 RATES Accounting policy General rates, targeted rates (excluding those for water-by-meter) and uniform annual general charges are recognised at the start of the financial year to which the rates resolution relates. They are recognised at the amounts due. Council considers the effect of payment by instalment is not sufficient to require discounting of rates receivables and subsequent recognition of interest revenue. Rates arising from late payment penalties are recognised as revenue when the rates become overdue. Revenue from water-by-meter rates is recognised on an accrual basis. Unbilled usage, as a result of unread meters at year end, is accrued on an average usage basis. Rates remissions are recognised as a reduction of rates revenue when Council has received an application that satisfies its rates remission policy. Council and Group General rates 40,157 38,698 Uniform annual general charge 10,754 10,159 Total general rates revenue 50,911 48,857 Targeted rates Community boards Community centres and facilities Refuse & waste management 2,594 3,526 Stormwater 1,520 1,455 Wastewater 7,255 6,264 Metered water supply 3,115 2,706 Other water rates 4,566 4,150 Total targeted rates 19,863 18,889 Plus: Penalties revenue 1,483 1,443 Total rates revenue 72,257 69,189 Less: Rate remissions (538) (440) Total net rates 71,719 68,749 Council is required by the LGFA Guarantee and Indemnity Deed to disclose in its financial statements (or notes) its annual rates income. That Deed defines annual rates income as an amount equal to the total revenue from any funding mechanism authorised by the Local Government (Rating) Act 2002 together with any revenue received by Council from other local authorities for services provided by Council for which those other local authorities rate. Annual rates income by this definition is as disclosed in the table above. Annual Report WAIKATO DISTRICT COUNCIL 73
76 Rates remissions Rates revenue is shown net of rates remissions. Council s rates remission policy allows Council to remit rates on condition of a ratepayer s extreme hardship, land used for community and sporting purposes, land protected for historic or cultural purposes and rating units with a capital valuation (CV) of $1,000 or less and Maaori freehold land. Council and Group Land used for community and sporting purposes Land protected for historical or cultural purposes CV s under $1, Rating exclusions Maaori freehold land Total rates remissions Rates remissions are recognised as a reduction of rates revenue when Council has received an application that satisfies its rates remission policy. Non-rateable land Under the Local Government (Rating) Act 2002 certain properties cannot be rated for general rates. These properties include schools, places of religious worship, public gardens and reserves. Non-rateable properties may be subject to targeted rates in respect of sewerage, water, refuse and sanitation. Non-rateable land does not constitute a remission under Council s remission policy. Rating base information Council s rating base is as follows: Council Actual Actual Total number of rating units 30,571 29,820 Total land value $11,984m $11,854m Total capital value $20,039m $19,620m 74 WAIKATO DISTRICT COUNCIL Annual Report
77 Note 3 FINANCE REVENUE AND COSTS Accounting policy Interest revenue is recognised using the effective interest method. All borrowing costs are recognised as an expense in the period in which they are incurred. Council Group Finance revenue Interest bank deposits Interest financial assets Interest community loans Interest other Interest LGFA borrower notes Total finance revenue Less: Finance costs Interest bank borrowing Interest LGFA borrowing 2,021 1,908 2,021 1,908 Interest swaps differences 1, , Provision: discount unwinding Other finance costs 11 1, ,178 Total finance costs 3,659 4,259 3,659 4,416 Net finance costs (3,503) (3,655) (3,486) (3,748) Annual Report WAIKATO DISTRICT COUNCIL 75
78 Note 4 OTHER REVENUE Accounting policy Found and vested physical assets are recognised at fair value at the time Council obtains control of the asset. The fair value is recognised as revenue and the amount is determined by reference to the costs of purchase and/or construction. Revenue from the sale or provision of goods is recognised when a product is sold to the customer. Revenue from the rendering of services is recognised by reference to the stage of completion of the transaction at balance date, based on the actual service provided as a percentage of the total services to be provided. Dividends are recognised as revenue when the right to receive payment has been established. Revenue from traffic and parking infringements is recognised when the infringement notice is issued. Rental income from investment properties is recognised as revenue on a straight-line basis over the term of the lease. Council Group Found assets 1,454 5,488 1,454 5,488 Vested assets 12,115 19,804 12,115 19,804 Dividends Other revenue 10,669 8,058 10,775 11,543 Regulatory revenue 7,494 6,953 7,494 6,953 Fees and charges Council 1,744 1,996 1,744 1,996 Fair value through surplus (deficit) realised gain Interest rate swaps revaluation gain Property, plant and equipment gains on disposal , Investment property gain on disposal Investment property revaluation gain Gain on cessation of joint venture agreement Fair value through surplus (deficit) unrealised gains Total other revenue 35,152 42,369 35,724 46, WAIKATO DISTRICT COUNCIL Annual Report
79 Note 5 EXCHANGE AND NON-EXCHANGE REVENUE Accounting policy Revenue is measured at fair value. For exchange revenue this equals the fair value of the consideration received or receivable. For non-exchange revenue it is the amount of the increase in net assets recognised by the Group. Council receives government grants from New Zealand Transport Agency (NZTA) which subsidise part of Council s costs in maintaining the local roading infrastructure. The subsidies are recognised as revenue upon entitlement as conditions pertaining to eligible expenditure have been fulfilled. Development and financial contributions are recognised as revenue when Council is capable of providing the service for which the contribution is charged. Council Group Revenue from exchange transactions Revenue from metered water supply 3,115 2,706 3,115 2,706 Development and financial contributions 8,547 9,454 8,547 9,454 Other fees and charges Council 10,843 9,126 10,843 9,126 Finance revenue Dividends received Other exchange revenue 3,914 3,768 5,151 8,278 Total revenue from exchange transactions 27,275 25,658 27,864 30,272 Revenue from non-exchange transactions Revenue from rates 68,604 66,043 68,604 66,043 Vested and found assets 13,569 25,292 13,569 25,292 Regulatory revenue 1,677 1,730 1,677 1,730 Infringements and fines NZTA government subsidies 19,112 18,375 19,112 18,375 Petrol tax Other subsidies and grants 205 1, ,506 Other fees and charges Council 2, , Other non-exchange revenue 1,708 1,187 1,708 1,180 Total revenue from non-exchange transactions 107, , , ,392 Revenue from exchange transactions 27,275 25,658 27,864 30,272 Revenue from non-exchange transactions 107, , , ,392 Total revenue per statement of comprehensive revenue and expense 134, , , ,664 There are no unfulfilled conditions or other contingencies attached to subsidies and grants recognised (2016: $nil). Annual Report WAIKATO DISTRICT COUNCIL 77
80 Note 6 EMPLOYEE COSTS Accounting policy Obligations for contributions to defined contribution superannuation schemes such as KiwiSaver are recognised as an expense in the surplus or deficit when incurred. Council Group Salaries and wages 26,765 25,036 27,106 26,747 Defined contribution plan employer contributions Increase (decrease) in employee liabilities (463) 396 (531) 219 Total employee costs 26,912 26,010 27,193 27,589 Employer contributions to defined contribution plans is made up of contributions to KiwiSaver. Note 7 DEPRECIATION AND AMORTISATION EXPENSE BY GROUP OF ACTIVITY Council Water supply 2,165 1,662 Wastewater 2,996 2,473 Stormwater Roading 13,373 12,724 Sustainable environment Sustainable communities 4,149 3,663 Governance - - Organisational support 1,778 1,653 Total directly attributable depreciation and amortisation 25,132 22, WAIKATO DISTRICT COUNCIL Annual Report
81 Note 8 OTHER EXPENSES AND LOSSES Accounting policy Grant expenditure Non-discretionary grants are those grants that are awarded if the grant application meets the specified criteria. They are recognised as expenditure when an application that meets the specified criteria for the grant has been received. Discretionary grants are those grants where Council has no obligation to award on receipt of the grant application and are recognised as expenditure when a successful applicant has been notified of Council s approval. Operating leases An operating lease is a lease that does not transfer substantially all the risks and rewards incidental to ownership of an asset. Lease payments under an operating lease are recognised as an expense on a straight-line basis over the lease term. Council Group Audit fees Annual report Other payments to Audit New Zealand Asset write-off 4,705 7,469 4,705 7,469 Bad debt written off Rates penalty write-offs Other expenditure 43,527 39,904 43,869 41,985 Other personnel expenses 1, ,096 1,009 Inventories consumed Minimum lease payments under operating leases Legal expenses Other professional fees 1,037 1,150 1,037 1,156 Consultant expenses 4,303 3,222 4,377 3,434 Grants and sponsorship 859 1,214 1,038 1,265 Fair value loss on cattle Fair value through surplus (deficit) unrealised loss Loss on revaluation of assets Impairment loss computer software Impairment of equity accounted joint venture Interest rate swaps revaluation loss - 3,509-3,509 Total other expenses and losses 57,700 59,209 58,356 62,897 During the current year no payments were made to Audit New Zealand apart from for audit of the annual report. In 2016 other payments were made for assurance services relating to the selection of a contractor for the maintenance of open spaces. Annual Report WAIKATO DISTRICT COUNCIL 79
82 Note 9 INCOME TAX Accounting policy Income tax expense includes both current and deferred tax. Current tax is the amount of income tax payable based on the taxable surplus for the current year, plus any adjustments to income tax payable in respect of prior years. Current tax is calculated using tax rates (and tax laws) that have been enacted or substantively enacted at balance date. Deferred tax is the amount of income tax payable or recoverable in future periods in respect of temporary differences and unused tax losses. Temporary differences are differences between the carrying amount of assets and liabilities in the statement of financial position and the corresponding tax bases used in the computation of taxable profit. Deferred tax is measured at the tax rates that are expected to apply when the asset is realised or the liability is settled, based on tax rates (and tax laws) that have been enacted or substantially enacted at balance date. The measurement of deferred tax reflects the tax consequences that would follow from the manner in which the Group expects to recover or settle the carrying amount of its assets and liabilities. Deferred tax liabilities are generally recognised for all taxable temporary differences. Deferred tax assets are recognised to the extent that it is probable that a taxable profit will be available against the deductible temporary differences or tax losses can be utilised. Deferred tax is not recognised if the temporary difference arises from the initial recognition of goodwill or from the initial recognition of an asset or liability in a transaction that is not a business combination, and which at the time of the transaction affects neither accounting nor taxable profit. Current and deferred tax is recognised against the surplus or deficit for the period, except to the extent that it relates to a business combination, or to transactions recognised in other comprehensive income or directly in equity. Council Group Operating surplus before tax expense 21,488 29,196 21,079 25,504 Prima facie tax at 28% ,175 5,902 7,141 Non-assessable income (net) (6,017) (8,175) (5,902) (7,627) Non-deductible expenditure Total income tax expense (26) Made up of: Deferred tax (96) Prior period adjustment Income tax expense (26) 80 WAIKATO DISTRICT COUNCIL Annual Report
83 Deferred tax (assets) liabilities Plant and Equipment Employee entitlements Other provisions Total tax loss Total Balance at 1 July 2015 (273) 33 (8) 194 (54) Charged to surplus (deficit) 238 (20) (75) (117) 26 Charged to other comprehensive income Balance at 30 June 2016 (7) 13 (83) 77 - Balance at 1 July 2016 (7) 13 (83) 77 - Charged to surplus (deficit) Charged to other comprehensive income Balance at 30 June 2017 (7) 13 (83) 77 - Note 10 CASH AND CASH EQUIVALENTS Accounting policy Cash and cash equivalents include cash on hand, deposits held at call with banks, other short-term highly liquid investments with original maturities of three months or less and bank overdrafts. The carrying value of cash and cash equivalents approximates their fair value. Council Group Cash at bank and on hand 905 1,810 1,673 4,322 Short term deposits maturing within three months or less from date of acquisition Total cash and cash equivalents per statement of financial position 2,800 2,200 2,800 2,200 3,705 4,010 4,473 6,522 Bank overdrafts Cash and cash equivalents per statement of cash flows 3,705 4,010 4,473 6,522 The total value of cash equivalents that can only be used for a specific purpose is $181,029 (2016: $173,536). Annual Report WAIKATO DISTRICT COUNCIL 81
84 Note 11 RECOVERABLES AND RECEIVABLES Accounting policy Short-term receivables are recorded at the amount due, less any provision for uncollectability. A receivable is considered to be uncollectable when there is evidence that the amount due will not be fully collected. The amount that is uncollectable is the difference between the amount due and the present value of the amount expected to be collected. Council Group Receivables from exchange transactions Receivables from related parties Water rates receivable Other receivables from exchange transactions 2,909 6,098 2,944 6,605 Gross receivables 3,650 6,704 3,559 7,153 Provision for uncollectability (217) (150) (217) (150) Net receivables from exchange transactions 3,433 6,554 3,342 7,003 Recoverables from non-exchange transactions Rates receivable 4,200 4,010 4,200 4,010 Recoverables from user charges, taxes and other nonexchange revenue 2,489 2,579 2,489 2,579 GST refund Income tax refund Gross recoverables 7,105 7,575 7,105 7,575 Provision for uncollectability (1,193) (1,110) (1,193) (1,110) Net recoverables from non-exchange transactions 5,912 6,465 5,912 6,465 Total gross receivables and recoverables 10,755 14,279 10,664 14,728 Total provision for uncollectability (1,410) (1,260) (1,410) (1,260) Total net recoverables and receivables 9,345 13,019 9,254 13,468 Fair value Receivables are non-interest bearing and receipt is normally on 30-day terms. Therefore, the carrying value of debtors and other receivables approximates their fair value. Assessment of uncollectability Council provides for uncollectability of rates receivable in certain circumstances; when the property is multiple-owned Maaori land or when there is no guarantor available. In all other circumstances, Council does not provide for any uncollectability because it has various powers under the Local Government (Rating) Act 2002 to recover any outstanding debts. These powers allow Council to commence legal proceedings to recover any rates that remain unpaid four months after the due date for payment. If payment has not been made within three months of the Court s judgement, then Council is able to apply to the Registrar of the High Court to have the judgement enforced by the sale or lease of the rating unit. Ratepayers can apply for payment options in special circumstances. Where such repayment plans are in place, debts are discounted to their present value if the effect of discounting is material. Strada does not provide for any uncollectability of receivables as it has various powers under the Construction Contracts Act 2002 to recover any outstanding debts and no debtors exhibit a financial status that would lead Strada to believe a debt is impaired. 82 WAIKATO DISTRICT COUNCIL Annual Report
85 The ageing profile of recoverables and receivables is: Gross Uncollectability Total Council 2017 Not past due 8,877-8,877 Past due 1 60 days Past due days Past due > 120 days 1,665 (1,410) 255 Total gross recoverables and receivables 10,755 (1,410) 9,345 Council 2016 Not past due 11,164-11,164 Past due 1 60 days Past due days Past due > 120 days 3,019 (1,260) 1,759 Total gross recoverables and receivables 14,279 (1,260) 13,019 Group 2017 Not past due 8,786-8,786 Past due 1 60 days Past due days Past due > 120 days 1,665 (1,410) 255 Total gross recoverables and receivables 10,664 (1,410) 9,254 Group 2016 Not past due 11,498-11,498 Past due 1 60 days Past due days Past due > 120 days 3,019 (1,260) 1,759 Total gross recoverables and receivables 14,728 (1,260) 13,468 Annual Report WAIKATO DISTRICT COUNCIL 83
86 Provision for uncollectability The uncollectability provision has been calculated based on a review of specific overdue receivables together with a collective assessment. The collective uncollectability provision is based on an analysis of past collection and debt write-off history. Council and Group Individual uncollectability Collective uncollectability 1,272 1,117 Total provision for uncollectability 1,410 1,260 Individually impaired receivables have been determined to be impaired because of the improbability of collection. An analysis of the individually impaired debtors is shown below: Council and Group Past due 1 60 days - - Past due days - - Past due > 120 days Total individual uncollectability Movements in the provision for uncollectability of recoverables and receivables are as follows: Council and Group Balance at 1 July 1,260 1,225 Additional provision made during the year Provisions reversed during the year - (30) Debts written off during the period 94 (90) Balance at 30 June 1,410 1, WAIKATO DISTRICT COUNCIL Annual Report
87 Note 12 INVENTORY Accounting policy Inventory held for use in the provision of goods and services on a commercial basis is valued at the lower of cost (using the FIFO method) and net realisable value. The amount of any write-down for the loss of service potential or from cost to net realisable value is recognised in the surplus or deficit in the period of the write-down. Council Group Fuel Bitumen Cement Total inventory (at cost) No inventory items are pledged as security for liabilities (2016: $nil). Note 13 CATTLE Accounting policy Cattle on Council s reserves are revalued annually at fair value less estimated costs to sell. Fair value is determined based on market price at balance date. Gains and losses from a change in fair value less estimated costs to sell are recognised in the surplus or deficit. The costs incurred in relation to the cattle are included in the surplus or deficit. Council and Group Balance at 1 July Increase through purchases Gains (losses) from fair value adjustments (8) (6) Decrease through sales (101) (90) Balance at 30 June Council keeps cattle to graze on one of its reserves as part of reserve maintenance. Although a financial gain was achieved it was not Council s primary purpose. The cattle are normally sold within the next twelve months after balance date. The number of cattle at balance date was 102 (2016: 100). Council has no cattle with restricted title. Annual Report WAIKATO DISTRICT COUNCIL 85
88 Note 14 OTHER FINANCIAL ASSETS Accounting policy Subsidiaries Council consolidates in the Group financial statements all entities where Council has the capacity to control their financing and operating policies so as to obtain benefits from the activities of the subsidiary. This power exists where Council controls the majority voting power on the governing body or where such policies have been irreversibly predetermined by Council or where the determination of such policies is unable to materially affect the level of potential ownership benefits that arise from the activities of the subsidiary. Council will recognise goodwill where there is an excess of the consideration transferred over the net identifiable assets acquired and liabilities assumed. This difference reflects the goodwill to be recognised by Council. If the consideration transferred is lower than the net fair value of Council s interest in the identifiable assets acquired and liabilities assumed, the difference will be recognised immediately in the surplus or deficit. The investment in subsidiaries is carried at cost in Council s parent entity financial statements. Valuation Financial assets are initially recognised at fair value plus transaction costs unless they are carried at fair value through surplus or deficit in which case the transaction costs are recognised in the surplus or deficit. Purchases and sales of financial assets are recognised on trade-date, the date on which Council and the Group commits to purchase or sell the asset. Financial assets are derecognised when the rights to receive cash flows from the financial assets have expired or have been transferred and Council and the Group have transferred substantially all the risks and rewards of ownership. Council and the Group classify their financial assets into the following categories for the purposes of measurement: z Loans and receivables z Held to maturity investments z Fair value through surplus or deficit z Fair value through other comprehensive revenue and expense The classification depends on the purpose for which the investment was acquired. Loans and receivables Loans and receivables are non-derivative financial assets with fixed or determinable payments that are not quoted in an active market. They are included in current assets, except for those with maturities greater than 12 months after the balance date, which are included in non-current assets. After initial recognition they are measured at amortised cost, using the effective interest method less impairment. Gains and losses when the asset is impaired or derecognised are recognised in the surplus or deficit. Loans to community organisations made by Council at nil, or below market interest rates are initially recognised at the present value of their expected future cash flows, discounted at the current market rate of return for a similar financial instrument. The loans are subsequently measured at amortised cost using the effective interest method. The difference between the face value and present value of expected future cash flows of the loan is recognised in the surplus or deficit. Held to maturity investments Held to maturity investments are non-derivative financial assets with fixed or determinable payments, with fixed maturities and with a positive intention and ability to hold to maturity. They are included in current 86 WAIKATO DISTRICT COUNCIL Annual Report
89 assets, except for those with maturities greater than 12 months after balance date which are included in non-current assets. After initial recognition they are measured at amortised cost using the effective interest rate method, less impairment. Gains and losses when the asset is impaired or de-recognised are recognised in surplus or deficit. Fair value through surplus or deficit Financial assets at fair value through surplus or deficit include financial assets held for trading. A financial asset is classified in this category if acquired principally for the purpose of selling in the short term and such an asset is classified as a current asset. Council s derivatives are categorised as held for trading unless they are designated into hedge accounting relationship for which hedge accounting is applied. The current/ non-current classification of derivatives is explained in the derivatives accounting policy in note 24. After initial recognition, financial assets in this category are measured at their fair values with gains or losses on re-measurement recognised in the surplus or deficit. Fair value through other comprehensive revenue and expense Financial assets at fair value through other comprehensive income are those that are designated into the category at initial recognition or are not classified in any of the other categories above. They are included in non-current assets unless management intends to dispose of or realise the investment within 12 months of the balance date. They comprise of the following: z Investments that it intends to hold long-term but which may be realised before maturity; and z Shareholdings that it holds for strategic purposes. These investments are measured at their fair value, with gains and losses recognised in other comprehensive income, except for impairment losses, which are recognised in the surplus or deficit. On de-recognition the cumulative gain or loss previously recognised in other comprehensive revenue is reclassified from equity to the surplus or deficit. Impairment of financial assets Financial assets are assessed for objective evidence of impairment at each balance date. Impairment losses are recognised in the surplus or deficit. Loans and other receivables Impairment is established when there is objective evidence that Council and the Group will not be able to collect amounts due according to the original terms of the receivable. Significant financial difficulties of the debtor, probability that the debtor will enter into bankruptcy and default in payments are considered indicators that the asset is impaired. The amount of the impairment is the difference between the asset s carrying amount and the present value of estimated future cash flows, discounted using the original effective interest rate. For receivables, the carrying amount of the asset is reduced through the use of an allowance account, and the amount of the loss is recognised in the surplus or deficit. When the receivable is uncollected, it is written off against the allowance account. Overdue receivables that have been renegotiated are reclassified as current (ie not past due). For community loans, impairment losses are recognised directly against the instruments carrying amount. Financial assets at fair value through other comprehensive revenue and expense For equity investments, a significant or prolonged decline in the fair value of the investment below its cost is considered an indicator of impairment. If impairment evidence exists for investments at fair value through other comprehensive income, the cumulative loss previously recognised in other comprehensive income is reclassified from equity to the Annual Report WAIKATO DISTRICT COUNCIL 87
90 surplus or deficit. The cumulative loss of a financial asset is measured as the difference between the acquisition cost and the current fair value, less any impairment loss previously recognised in the surplus or deficit. Impairment losses recognised in the surplus or deficit on equity investments are not reversed through the surplus or deficit. Council Group Current portion Term deposits 10,590-10,590 - Equity instruments - - 1,951 1,664 Fixed interest instruments - - 1,711 1,578 LGFA borrower notes Community loans Total current portion 10, ,629 3,320 Non-current portion Investments in CCO s and other similar entities Local Authority Shared Services Limited (a) Waikato Regional Airport Limited 12,797 2,639 12,797 2,639 Advance to Waikato Quarries Limited Strada shares 700 4, Total investment in CCO s and similar entities 13,716 7,359 13,016 2,859 Investment in other entities Community loans LGFA borrower notes NZ Local Government Insurance Corp Limited Deferred settlement receivable Total investment in other entities 1,219 1,253 1,729 1,878 Total non-current portion 14,935 8,612 14,745 4,737 Total other financial assets 25,902 8,690 29,374 8,057 (a) Council s investment in Local Authority Shared Services Limited comprises four distinct classes of share. The numbers held and values of each share class are as follows: No. of shares Value per Share $ Total Capital $ Uncalled Capital $ Paid up Capital $ Ordinary shares 1 1, ,000 1,000 - Shared Valuation Database Service 106, , ,674 Waikato Regional Photography Service 9, ,376 9,376 - Waikato Regional Transport Model 11, , , ,550 10, , WAIKATO DISTRICT COUNCIL Annual Report
91 Fair value Community loans Community loans are measured at amortised cost using the effective interest method. Their fair value is $253,723 (2016: $282,753). Fair value has been determined using cash flows discounted at the interest rate (current at 1 July 2017) charged by Council on community loans. The rate used is 6.33% (2016: 6.34%). The face value of total community loans is $259,330 (2016 $319,997). Unlisted investments and advances The fair value of Council s shares in Local Authority Shared Services Limited has not been disclosed because the fair value cannot be reliably measured as there is no active market for these instruments; therefore the shares are held at cost. As a result of the increasing portion of Waikato Regional Airport Limited s (WRAL) balance sheet being carried at fair value, Council are now able to reliably measure its investment at fair value (previously recognised at cost). This has resulted in an increase of investment in WRAL of $10,147,000 in the current year. The fair value of Council s investment in Civic Financial Services Limited (formerly NZ Local Government Insurance Corporation Limited) is $62,809 (2016: $58,532). This is based on Council s share, currently 0.37% (2016: 0.37%), of the assets less liabilities of the company. The change in value has been taken to fair value through other comprehensive income. Note 15 NON-CURRENT ASSETS HELD FOR SALE Accounting policy Non-current assets no longer required in Council s operations and therefore intended for sale have been measured at the lower of their carrying amount and their fair value, less costs to sell. Any impairment losses for write-downs of such assets are recognised in the surplus or deficit. Any increases in fair value (less costs to sell) are recognised up to the level of any impairment losses that have been previously recognised. Non-current assets (including those that are part of a disposal group) are not depreciated or amortised. Council Group Land Buildings Plant and equipment ,978 Total non-current assets held for sale ,864 At 30 June 2017 Council had no non-current assets held for sale (2016: two). Because the Directors of Strada had resolved to sell all of its operational assets during the year ended 30 June 2017, all items of property, plant and equipment were been reclassified as non-current assets held for sale and are measured at the lower of their carrying amount and fair value less costs to sell. The immaterial value of assets remaining, continues to be classified as held for sale. Annual Report WAIKATO DISTRICT COUNCIL 89
92 Note 16 PROPERTY, PLANT AND EQUIPMENT Accounting policy Property, plant, and equipment consists of: z Operational assets: These include land, buildings, improvements, landfill post closure, library books, plant and equipment, furniture, computers and motor vehicles. z Restricted assets: These are parks and reserves owned by Council which provide a benefit or service to the community and which can only be disposed of after following a rigorous legal and public consultation process. z Infrastructural assets: These are the fixed utility systems owned by Council. Each asset class includes all items that are required for the network to function. For example, wastewater reticulation includes reticulation piping and wastewater pump stations. Land (operational and restricted) is measured at fair value; buildings (operational and restricted), and infrastructural assets (except land under roads) are measured at fair value less accumulated depreciation. All other asset classes are measured at cost less accumulated depreciation and impairment losses. Additions The cost of an item of property, plant and equipment is recognised as an asset if, and only if, it is probable that future economic benefits or service potential associated with the item will flow to Council and the Group and the cost of the item can be measured reliably. Work in progress is recognised at cost less impairment and is not depreciated. In most instances, an item of property, plant and equipment is initially recognised at cost. Where an asset is acquired through a non-exchange transaction it is recognised at its fair value as at the date of acquisition. Disposals Gains and losses on disposal are determined by comparing the proceeds with the carrying amount of the asset. Gains and losses on disposal are reported net in the surplus or deficit. When revalued assets are sold, the amounts included in the asset revaluation reserves in respect of those assets are transferred to accumulated funds. Depreciation Depreciation is provided on a straight-line basis on all property, plant and equipment other than land; except that some of Strada s operational assets are depreciated on the diminishing value basis. The depreciation rates used will write off the cost (or valuation) of the assets to their estimated residual values over their useful lives. The useful lives and associated depreciation rates of major classes of assets have been estimated as follows: Description Audio visual materials and electronic games - Libraries Useful life (years) Depreciation rate 5 20% Buildings % Vehicles / moveable plant % Library books % Computers % Office equipment % 90 WAIKATO DISTRICT COUNCIL Annual Report
93 Description Useful life (years) Depreciation rate Furniture and fixtures 10 10% Water supply % Wastewater % Urban stormwater % Roading pavement - sealed % Pavement (basecourse) - sealed % - unsealed metal 20 5% Surface water channel % Culverts % Guardrails / barriers % Drainage % Retained walls % Footpaths % Street lighting 20 5% Bridges % Parks & reserves % Solid waste - refuse transfer stations % - landfills % Signs 20 5% The residual value, depreciation method and useful life of an asset is reviewed and adjusted if applicable, at each balance sheet date. Revaluation Land and buildings (operational and restricted) and infrastructural assets (except land under roads) are revalued on a regular basis (at least every three years) to ensure that their carrying amount does not differ materially from fair value. The carrying values of the revalued assets are assessed annually to ensure that they do not differ materially from the assets fair value. If there is a material difference, the off-cycle asset classes are revalued. Revaluations of property, plant and equipment are accounted for on a class-of-asset basis. The net revaluation results are credited or debited to other comprehensive revenue and expense and are accumulated to an asset revaluation reserve, in equity, for that class of asset. Where this results in a debit balance in the asset revaluation reserve, this balance is expensed in the surplus or deficit. Any subsequent increase on revaluation that reverses a previous decrease in value recognised in the surplus or deficit will be recognised first in the surplus or deficit up to the amount previously expensed and recognised in other comprehensive revenue and expense. Impairment of property, plant and equipment Property, plant and equipment having a finite useful life are reviewed for impairment at each balance date and whenever events or changes in circumstances indicate that the carrying amount may not be recoverable. Annual Report WAIKATO DISTRICT COUNCIL 91
94 An impairment loss is recognised for the amount by which the asset s carrying amount exceeds its recoverable amount. The recoverable amount is the higher of an asset s fair value less costs to sell and its value in use. If an asset s carrying amount exceeds its recoverable amount, the asset is regarded as impaired and the carrying amount is written down to the recoverable amount. For revalued assets, the impairment loss is recognised against the revaluation reserve for that class of asset. Where that results in a debit balance in the revaluation reserve, the balance is recognised in the surplus or deficit. For assets not carried at a revalued amount the entire loss is recognised in the surplus or deficit. The reversal of an impairment loss on a revalued asset is credited to other comprehensive revenue and expense and increases the asset revaluation reserve for that class of asset. However, to the extent that an impairment loss for that class of asset was recognised in the surplus or deficit, a reversal of the impairment loss is also recognised in the surplus or deficit. For assets not carried at a revalued amount, the reversal of an impairment loss is recognised in the surplus or deficit. Value in use for non-cash-generating assets Non-cash-generating assets are those assets that are not held with the primary objective of generating a commercial return. For non-cash-generating assets, value in use is determined using an approach based on either a depreciated replacement cost approach, restoration cost approach, or a series of service units approach. The most appropriate approach used to measure value in use depends on the nature of the impairment and availability of information. Value in use for cash-generating assets Cash-generating assets are those assets that are held with the primary objective of generating a commercial return. The value in use for cash-generating assets and cash-generating units is the present value of expected future cash flows. Valuation Operational and restricted land and buildings Land, buildings and properties valued by their components have been valued at fair value either as determined by an independent valuer using market-based evidence or by using a replacement cost approach. The most recent valuation was performed by Richard Allen, Andrew Jaques and Chelsea Muggeridge of QV Valuations (QV) a division of Quotable Value Limited and dated 30 June The fair value of Council s land and buildings has been determined based on the highest and best use in accordance with PBE IPSAS 17 Property, Plant and Equipment. Land A number of estimates and assumptions must be made when valuing land and buildings. In this instance they include: z Land valuations have been based on extensive local knowledge, the district rating records, the QV Mapping system and records held by QV and its predecessor Valuation. z Land has been valued as if vacant and incorporates the influences of size, contour, quality, location, zoning, designation and current and potential usage. z All land is valued on an open market willing buyer willing seller scenario. This is effectively the prices an informed purchaser would have to spend to acquire a similar property. z Where there is a designation held against the land, adjustments have been made to reflect that designation. 92 WAIKATO DISTRICT COUNCIL Annual Report
95 Buildings All buildings have been valued on either a fair market or depreciated replacement cost basis (DRC). Where the fair value of an asset can be determined by reference to the price in an active market for the same or similar asset, the fair value of the asset is determined using this information. Where the fair value of the asset is not able to be determined using market-based evidence, depreciated replacement cost is considered to be the most appropriate basis for determination of fair value. QV have considered the highest and best use of the property when formulating which approach to undertake the building valuations with. Where market-based evidence exists structures have been valued on a market basis in relation to a market-based per square metre. A number of estimates and assumptions must be made when valuing land and buildings. They may differ depending on the degree of specialisation inherent in the purpose or use of each particular building. For specialised assets which are valued on a depreciated replacement cost basis: z Replacement cost rates are derived from construction contracts of like assets, reference to publications such as qv Cost Builder (previously the Rawlinson s Construction Handbook), recent costings obtained from construction details and Property Institute of New Zealand s cost information. z A componentisation approach is taken in most cases. The exceptions are where the cost of a component or the lives do not differ materially to the entire value of the structure to warrant being componentised. In all these cases, the building is reported as a structure only and will generally be under $50,000 in value. The components are summarised for financial reporting purposes as structure, roof, internal fit-out, services, plant and external works/other improvements. z The remaining useful life of properties is estimated by determining the effective age of the components within each property and comparing with the economic life of the improvements. A minimum residual life of five years has been adopted for properties nearing the end of their theoretical lives. z Straight line depreciation has been applied to all DRC valued assets to determine their DRC. z Optimisation has been considered in the process of determining DRC. Optimisation defines the most efficient set of assets that deliver the required services. Residential dwellings and commercial properties have been valued in relation to market-based evidence. z Market rents and capitalisation rates were applied to reflect market value while considering the highest and best use alternatives. z Optimisation is not considered under a market-derived assessment. Comparisons of the carrying value of buildings valued using depreciated replacement cost and buildings valued using market-based evidence is as follows: Council and Group Operational buildings Depreciated replacement cost 25,271 26,240 Market-based evidence 1,352 1,244 Total carrying value of operational buildings 26,623 27,484 Restricted buildings Depreciated replacement cost 24,855 25,819 Market-based evidence 1,515 1,425 Total carrying value of restricted buildings 26,370 27,244 Annual Report WAIKATO DISTRICT COUNCIL 93
96 Classification of property Council owns a number of properties held to provide housing for the elderly. The receipt of market-based rental from these properties is incidental to holding them. The properties are held for service delivery objectives as part of Council s social housing policy. The properties are therefore accounted for as property, plant and equipment rather than as investment property. Parks and reserves Parks and reserves assets include assets associated with cemeteries, public toilets (including toilet buildings); assets such as playgrounds, skate parks, carparks, roading within reserves, bollards, fences, pathways, gardens, rubbish bins, seating and signage; and, reserves-like assets associated with swimming pools. Parks and reserves assets have been valued at fair value as determined on an optimised depreciated cost basis by an independent valuer. The most recent valuation was performed by Vaibhav Gandhi, Robert Berghuis and Marvin Clough of Beca Limited and is dated 30 June A number of estimates and assumptions must be made when valuing parks and reserves assets using the optimised depreciated replacement cost method. In this instance they include: z The optimised replacement costs assume the use of modern materials, techniques and designs. They further assume that some assets may be surplus to requirements, technically obsolete or over-designed for their purpose. z Unit replacement cost rates allowed for modern equivalent asset replacement for known obsolete or redundant assets. For example, in the case of toilet blocks, rural plywood buildings are being replaced with circular concrete buildings, brick or weather-board clad buildings with concrete block buildings. z Useful (or base) lives are determined from the information provided in the New Zealand Infrastructure Asset Valuation and Depreciation Guidelines 2006 and from information gained by Beca during previous assessments of this type. Remaining useful life (RUL) is assessed on useful life less age, with adjustments depending on condition and performance which may vary from one asset to another. The condition and performance adjustment used in the current valuation is either 25% or 50% to reflect changes to RUL for poor and very poor condition and performance ratings to be consistent with those used by other local authorities. Minimum remaining useful life is assumed as 2.5% of the base life years. z Assets are assumed to have zero residual value at the end of their effective useful lives. Infrastructural asset classes: water, wastewater, stormwater, drainage and solid waste Utilities and solid waste assets have been valued at fair value determined on an optimised depreciated replacement cost basis by an independent valuer. The most recent valuation was performed by Colin Gerrard and Miles Wyatt of AECOM New Zealand Limited and is dated 30 June Estimates and assumptions for the revaluation of these assets included: z Straight-line depreciation was used. z Waters and solid waste assets were used in the valuation (land was not included). z Assets were assumed to have zero residual value. z Remaining useful life is assessed on useful life less age, with adjustments depending on condition and performance. A minimum remaining useful life of two years was used. z An optimisation approach was employed. Optimisation seeks to remove excess capacity, redundant assets, inappropriate design practices, old technologies and conservative design work. No areas of significant optimisation opportunities were identified. z Unit rates which reflect replacement with modern engineering equivalent assets were used in the valuation process. 94 WAIKATO DISTRICT COUNCIL Annual Report
97 Infrastructural asset classes: roading and bridges Road and bridge assets have also been valued at fair value as determined using the optimised depreciated replacement cost basis by an independent valuer. The most recent valuation was performed by Gregg Morrow, John Vessey, Evan Ou Yung and Yvonne Chen of Opus International Consultants Limited. The valuation is effective at 30 June A number of estimates and assumptions must be made when valuing infrastructural assets using the optimised depreciated replacement cost method. In this instance they include: z Replacement cost is the cost of building the existing infrastructure using present-day technology while maintaining the originally designed level of service. z Unit cost rates are factored to allow for other direct costs such as professional fees. NZTA Cost Adjustment Factors this year increased the unit rates between 2% and 4.6% for all assets when compared to March 2016 values. Unit costs represent brown-field costs which reflect increased difficulties and constraints of undertaking construction, maintenance and renewal work simultaneously with continuous operation of infrastructure. z Overhead factors (10%) have been applied to allow for all expenses incidental to the asset acquisition and all costs directly attributable to bringing the asset into working condition and location. z An optimisation approach was employed. Optimisation means provision of the required utility at a minimum overall cost. z Assets have been valued based on unit costs provided and quantities expressed as length, area or each. z Useful life has been calculated in accordance with the International Infrastructure Management Manual and further modified if local knowledge and experience suggest it is appropriate. Remaining useful life is then assessed as the difference between useful life and the age of the asset. z A zero residual value is assumed for all assets. z Straight line depreciation is used. Land under roads Land under roads was valued by both the former Franklin District Council (FDC) and Waikato District Council (WDC) before the transition by each to NZ Equivalent International Financial Reporting Standard (NZIFRS). On transition to NZIFRS both Councils elected to use the revaluation amounts for land under roads as the deemed cost. Following the merger of part of the former FDC and WDC, land under roads is stated at deemed cost and is not revalued. Strada Reclassification Because the Directors of Strada had resolved to sell all of its operational assets during the year ending 30 June 2016, all items of property, plant and equipment were reclassified as non-current assets held for sale and are measured at the lower of their carrying amount and fair value less costs to sell. The immaterial value of assets remaining continues to be held for sale. Annual Report WAIKATO DISTRICT COUNCIL 95
98 Council and Group Cost / valuation 1 Jul 2016 Accumulated depreciation and impairment charges 1 Jul 2016 Carrying amount 1 Jul 2016 Current year additions and transfers from WIP Current year disposals Current year reclassification cost Operational assets Land 19,796-19, (19) Buildings 27,484 (966) 26,518 1,173 (893) - Library books 5,125 (3,690) 1, Vehicles / moveable plant 5,907 (3,291) 2, (649) - Office equipment 1,294 (1,037) Computer equipment 5,002 (4,357) Furniture 1,332 (749) (12) - Total operational assets 65,940 (14,090) 51,850 2,467 (1,554) (19) Infrastructural assets Wastewater 100, ,495 4,944 (424) - Stormwater 46,911-46,911 3,892 (466) 30 Water 96,031-96,031 5,829 (709) - Drainage 2,743-2, (990) (30) Solid waste 1,588-1,588 - (1) - Roading 931, ,488 26,229 (582) - Bridges / culverts / pipes 126, , Land under roads 107, ,209 1,986 (1,595) 67 Work in progress 30,637-30,637 11, Total infrastructural assets 1,443,639-1,443,639 54,676 (4,767) 67 Restricted assets Land 69,760-69, (48) Buildings 27,244 (989) 26, Parks and reserves 34,903-34,903 2,794 (812) - Total restricted assets 131,907 (989) 130,918 3,456 (812) (48) Total Council and Group 1,641,486 (15,079) 1,626,407 60,599 (7,133) - 96 WAIKATO DISTRICT COUNCIL Annual Report
99 Current year reclassification accumulated depreciation Current year depreciation Accumulated depreciation disposed Revaluation surplus (deficit) Cost / valuation 30 Jun 2017 Accumulated depreciation and impairment charges 30 Jun 2017 Carrying amount 30 Jun ,740-20,740 - (1,017) ,623-26,623 - (307) - - 5,235 (3,997) 1,238 - (695) 455-6,036 (3,531) 2,505 - (43) - - 1,391 (1,080) (300) - - 5,225 (4,657) (90) 12-1,406 (827) (2,452) 534 1,738 66,656 (14,092) 52,564 - (2,807) , ,283 - (597) 7 2,700 52,477-52,477 - (2,152) 20 (425) 98,594-98,594 - (11) 1 (707) 1,264-1,264 - (59) ,578-1,578 - (10,856) 29 23, , ,313 - (2,517) - 6, , , , , ,175-42,175 - (18,999) 67 31,012 1,505,695-1,505, ,073 95,304-95,304 - (998) ,370-26,370 - (2,062) 47 5,934 40,804-40,804 - (3,060) 47 31, , ,478 - (24,511) ,727 1,734,829 (14,092) 1,720,737 Annual Report WAIKATO DISTRICT COUNCIL 97
100 Council Cost / valuation 1 Jul 2015 Accumulated depreciation and impairment charges 1 Jul 2015 Carrying amount 1 Jul 2015 Current year additions and transfers from WIP Current year disposals Current year reclassification cost Operational assets Land 17,576-17,576 2,715 (330) (165) Buildings 26,461-26,461 1,415 (204) (188) Library books 4,801 (3,394) 1, Vehicles / moveable plant 5,883 (3,064) 2, (641) - Office equipment 1,273 (1,003) Computer equipment 4,772 (4,091) Furniture 1,247 (668) (1) - Total operational assets 62,013 (12,220) 49,793 5,456 (1,176) (353) Infrastructural assets Wastewater 78,535-78,535 20,128 (900) - Stormwater 37,060-37,060 5,882 (113) - Water 77,349-77,349 16,378 (646) - Drainage 2,044-2, (118) - Solid waste 1,750-1, (48) - Roading 911, ,037 38,061 (201) - Bridges / culverts / pipes 127, , (2,684) - Land under roads 106, , (58) - Work in progress 56,404-56,404 (25,767) - - Total infrastructural assets 1,398,750-1,398,750 56,644 (4,768) - Restricted assets Land 67,944-67,944 2,327 (466) (45) Buildings 27,120-27,120 1,568 (1,444) - Parks and reserves 26,975-26,975 8,701 (1,274) - Total restricted assets 122, ,039 12,596 (3,184) (45) Total Council 1,582,802 (12,220) 1,570,582 74,696 (9,128) (398) 98 WAIKATO DISTRICT COUNCIL Annual Report
101 Current year reclassification accumulated depreciation Current year depreciation Accumulated depreciation disposed Revaluation surplus (deficit) Cost / valuation 30 Jun 2016 Accumulated depreciation and impairment charges 30 Jun 2016 Carrying amount 30 Jun ,796-19, (988) 10-27,484 (966) 26,518 - (296) - - 5,125 (3,690) 1,435 - (700) 473-5,907 (3,291) 2,616 - (34) - - 1,294 (1,037) (266) - - 5,002 (4,357) (82) 1-1,332 (749) (2,366) ,940 (14,090) 51,850 - (2,284) 29 4, , ,495 - (449) 1 4,530 46,911-46,911 - (1,647) 42 4,555 96,031-96, ,743-2,743 - (56) - (137) 1,588-1,588 - (10,379) 20 (7,050) 931, ,488 - (2,347) 48 3, , , , , ,637-30,637 - (17,162) ,035 1,443,639-1,443, ,760-69,760 - (989) ,244 (989) 26,255 - (1,603) 67 2,037 34,903-34,903 - (2,592) 67 2, ,907 (989) 130, (22,120) ,072 1,641,486 (15,079) 1,626,407 Annual Report WAIKATO DISTRICT COUNCIL 99
102 Group Cost / valuation 1 Jul 2015 Accumulated depreciation and impairment charges 1 Jul 2015 Carrying amount 1 Jul 2015 Current year additions and transfers from WIP Current year disposals Current year reclassification cost Operational assets Land 20,151-20,151 2,369 (2,234) (490) Buildings 27,600-27, (204) (363) Library books 4,801 (3,394) 1, Vehicles / moveable plant 15,854 (10,508) 5, (3,101) (7,513) Office equipment 1,432 (1,080) (53) (106) Computer equipment 4,772 (4,091) Furniture 1,247 (668) (1) - Total operational assets 75,857 (19,741) 56,116 4,248 (5,593) (8,472) Infrastructural assets Wastewater 78,535-78,535 20,128 (900) - Stormwater 37,060-37,060 5,882 (113) - Water 77,349-77,349 16,378 (646) - Drainage 2,044-2, (118) - Solid waste 1,750-1, (48) - Roading 911, ,037 38,061 (201) - Bridges / culverts / pipes 127, , (2,684) - Land under roads 106, , (57) - Work in progress 56,404-56,404 (25,767) - - Total infrastructural assets 1,398,750-1,398,750 56,643 (4,767) - Restricted assets Land 67,944-67,944 2,327 (466) (45) Buildings 27,120-27,120 1,568 (1,444) - Parks and reserves 26,975-26,975 8,701 (1,274) - Total restricted assets 122, ,039 12,596 (3,184) (45) Total Group 1,596,646 (19,741) 1,576,905 73,487 (13,544) (8,517) 100 WAIKATO DISTRICT COUNCIL Annual Report
103 Current year reclassification accumulated depreciation Current year depreciation Accumulated depreciation disposed Revaluation surplus (deficit) Cost / valuation 30 Jun 2016 Accumulated depreciation and impairment charges 30 Jun 2016 Carrying amount 30 Jun ,796-19, (1,019) 41 (100) 27,484 (966) 26,518 - (296) - - 5,125 (3,690) 1,435 5,563 (1,006) 2,660-5,907 (3,291) 2, (62) 27-1,294 (1,037) (266) - - 5,002 (4,357) (82) 1-1,332 (749) 583 5,653 (2,731) 2,729 (100) 65,940 (14,090) 51,850 - (2,284) 29 4, , ,495 - (449) 1 4,530 46,911-46,911 - (1,647) 42 4,555 96,031-96, ,743-2,743 - (56) - (137) 1,588-1,588 - (10,378) 19 (7,050) 931, ,488 - (2,347) 48 3, , , , , ,637-30,637 - (17,161) ,035 1,443,639-1,443, ,760-69,760 - (989) ,244 (989) 26,255 - (1,603) 67 2,037 34,903-34,903 - (2,592) 67 2, ,907 (989) 130,918 5,653 (22,484) 2,935 11,972 1,641,486 (15,079) 1,626,407 Annual Report WAIKATO DISTRICT COUNCIL 101
104 Other There are no items of property, plant and equipment that are not in current use. There have been no restrictions in titles relating to property, plant and equipment or items pledged as security for liabilities. No impairment losses have been recognised for property, plant and equipment in the current period (2016: $nil). There are no items of property, plant and equipment held under finance leases in the current period (2016: nil). The net gain on disposal of property, plant and equipment $362,045 (2016: $40,443) has been recognised in the Statement of comprehensive revenue and expense in the line item Other revenue. Infrastructural assets further disclosures Additions Closing book value Constructed by Council Assets transferred to Council Estimated replacement cost Council 2017 Water treatment plants and facilities 5, ,576 Other water assets 92,690 2,191 2, ,354 Wastewater treatment plants and facilities 12, ,359 Other wastewater assets 90,197 1,559 3, ,419 Stormwater and drainage 53, ,562 66,242 Roads, footpaths, bridges and culverts 1,099,658 22,630 3,598 1,360,217 Total infrastructural assets 1,354,275 28,046 13,103 1,743,167 Council 2016 Water treatment plants and facilities 4,898 2,288-9,122 Other water assets 91,133 12,175 1, ,399 Wastewater treatment plants and facilities 12,219 4,450-17,715 Other wastewater assets 88,276 11,870 3, ,019 Stormwater and drainage 49,654 2,327 4,368 60,479 Roads, footpaths, bridges and culverts 1,058,025 28,281 10,336 1,300,935 Total infrastructural assets 1,304,205 61,391 20,427 1,662,669 Work in progress The total amount of Council property, plant and equipment in the course of construction by class of asset is detailed below: Council and Group Buildings operational Buildings restricted Parks and reserves 7,801 7,165 Wastewater 6,564 4,927 Stormwater 204 1,628 Water 16,238 6,627 Solid waste Roading 10,190 9,004 Total work in progress 42,175 30, WAIKATO DISTRICT COUNCIL Annual Report
105 Note 17 INTANGIBLE ASSETS Accounting policy Software acquisition and development Acquired computer software licenses are capitalised on the basis of costs incurred to acquire and bring to use the specific software. This asset class, which is amortised on a straight line basis, has a finite useful life of three to seven years and the amortisation rates are between 14% and 33%. Strada s software assets are amortised on a straight-line or diminishing-value basis over their finite useful lives. The useful lives are between one and four years and the amortisation rates are between 25% and 100%. Consents Consent costs for capital works are recognised at cost, and amortised on a straight-line basis over the finite life of the consents (between 10 and 35 years). The amortisation charge for each period is recognised in the surplus or deficit. Impairment of intangible assets Intangible assets that have an indefinite useful life, or are not yet available for use, are not subject to amortisation and are tested annually for impairment. Intangible assets that have a finite useful life are reviewed for impairment whenever events or changes in circumstances indicate that the carrying amount may not be recoverable. If an asset s carrying amount exceeds its recoverable amount, the asset is regarded as impaired and the carrying amount is written down to the recoverable amount. The total impairment loss is recognised in the surplus or deficit. The reversal of an impairment loss is recognised in surplus or deficit. An impairment loss is recognised for the amount by which the asset s carrying amount exceeds its recoverable amount. The recoverable amount is the higher of an asset s fair value less costs to sell and value in use. Value in use for non-cash-generating assets Non-cash-generating assets are those assets that are not held with the primary objective of generating a commercial return. For non-cash-generating assets, value in use is determined using an approach based on either a depreciated replacement cost approach, restoration cost approach, or a series of service units approach. The most appropriate approach used to measure value in use depends on the nature of the impairment and availability of information. Value in use for cash-generating assets Cash-generating assets are those assets that are held with the primary objective of generating a commercial return. The value in use for cash-generating assets and cash-generating units is the present value of expected future cash flows. Annual Report WAIKATO DISTRICT COUNCIL 103
106 Council Group Computer software Consents Total Computer software Consents Total Balance at 1 July 2016 Cost 4,897 5,060 9,957 5,062 5,060 10,122 Accumulated amortisation and impairment (3,709) (849) (4,558) (3,874) (849) (4,723) Opening carrying amount 1,188 4,211 5,399 1,188 4,211 5,399 Year ended 30 June 2017 Additions , ,214 Disposal cost (11) - (11) (176) - (176) Disposal accumulated amortisation Impairment losses Amortisation charge (413) (208) (621) (248) (208) (456) Closing carrying amount 1,547 4,434 5,981 1,547 4,434 5,981 Balance at 30 June 2017 Cost 5,669 5,491 11,160 5,669 5,491 11,160 Accumulated amortisation and impairment (4,122) (1,057) (5,179) (4,122) (1,057) (5,179) Closing carrying amount 1,547 4,434 5,981 1,547 4,434 5,981 Balance at 1 July 2015 Cost 4,359 5,060 9,419 4,553 5,060 9,613 Accumulated amortisation and impairment (3,352) (643) (3,995) (3,444) (643) (4,087) Opening carrying amount 1,007 4,417 5,424 1,109 4,417 5,526 Year ended 30 June 2016 Additions Disposal cost Disposal accumulated amortisation Impairment losses (29) - (29) Amortisation charge (357) (206) (563) (430) (206) (636) Closing carrying amount 1,188 4,211 5,399 1,188 4,211 5,399 Balance at 30 June 2016 Cost 4,897 5,060 9,957 5,062 5,060 10,122 Accumulated amortisation and impairment (3,709) (849) (4,558) (3,874) (849) (4,723) Closing carrying amount 1,188 4,211 5,399 1,188 4,211 5,399 The carrying amount of the assets has been assessed as less than their replacement cost. There are no restrictions over the title of the Council s intangible assets, nor are any intangible assets pledged as security for liabilities. There are no intangible assets which have been internally generated. 104 WAIKATO DISTRICT COUNCIL Annual Report
107 Note 18 INVESTMENT PROPERTY Accounting policy Properties leased to third parties under non-cancellable operating leases are classified as investment property unless the property is held to meet service delivery objectives, rather than to earn rentals or for capital appreciation. Investment property is initially measured at cost, including transaction costs. After initial recognition, all investment properties are measured at fair value effective at 30 June each year. Gains or losses arising from a change in the fair value of investment property are recognised in the surplus or deficit. Council Group Balance at 1 July Fair value gains (losses) on valuation Disposals (400) Balance at 30 June (at valuation) Valuation At 30 June 2017 the valuation was performed by Mairi Macdonald, an independent valuer from Quotable Value Limited. Quotable Value is an experienced valuer with extensive market knowledge in the types and locations of investment properties owned by Council. The fair value of Council s investment properties has been determined based on the highest and best use in accordance with PBE IPSAS 16 Investment Property. A number of estimates and assumptions must be made when valuing investment property. In this instance they include: z All land is valued on a fair market basis determined from market based evidence and conditions that prevailed at 30 June z Land has been valued as if vacant and incorporates the influences of size, contour, quality, location, zoning, designation and current and potential usage. z Where there is a designation held against the land, adjustments have been made to reflect that designation. z All buildings have been valued on either a fair market or depreciated replacement cost basis. Where the fair value of an asset can be determined by reference to the price in an active market for the same or similar asset, the fair value of the asset is determined using this information. Where the fair value of the asset is not able to be determined using market-based evidence, depreciated replacement cost is considered to be the most appropriate basis for determination of fair value. Income and expenses relating to investment property Council Group Rental income Expenses from investment property generating income Rental income from investment properties is recognised as revenue on a straight-line basis over the term of the lease. Annual Report WAIKATO DISTRICT COUNCIL 105
108 Note 19 INVESTMENT IN JOINT VENTURE Accounting policy A joint venture is a binding arrangement whereby two or more parties are committed to undertake an activity that is subject to joint control. Joint control is the agreed sharing of control over an activity. For jointly controlled operations, the Group recognises in its financial statements the assets it controls, the liabilities and expenses it incurs, and the share of income that it earns from the joint venture. Council s interest, through Strada, in Waikato Quarries Limited joint venture was accounted for as a jointly controlled entity using the equity method. The joint venture has no commitments or contingencies (2016: nil). There are no capital commitments in relation to Strada s prior interest in Waikato Quarries Limited. There remains a contingent liability in respect of Fulton Hogan Limited; see Note 28 for further details. Group Original investment - 2,000 Balance at 1 July - 2,672 Share of total comprehensive income - (2,438) Impairment of equity accounted investment - (234) Balance at 30 June - - Strada s interest is as follows: Current assets Non-current assets - - Current liabilities Non-current liabilities - - Income - 3,765 Expenses - 6,203 Based on the cessation of the joint venture, Strada s only remaining interest is in a non-current receivable of $510,000 (2016: $625,000). 106 WAIKATO DISTRICT COUNCIL Annual Report
109 Note 20 PAYABLES, TAXES AND TRANSFERS Accounting policy Short-term payables are recorded at their face value. Council Group Payables under exchange transactions Trade payables 3,950 5,365 3,955 5,508 Water rates in advance Accrued expenses 11,569 17,068 11,662 17,180 Amounts due to related parties Income in advance Total payables under exchange transactions 16,548 23,602 16,646 23,865 Taxes and transfers payable under non-exchange transactions Rates in advance Deposits and bonds GST and FBT payable Taxation payable Other non-exchange payables Total taxes and transfers payable 1,128 1,090 1,128 1,133 Total payables, taxes and transfers 17,676 24,692 17,774 24,998 Payables are non-interest bearing and are normally settled within 30 days, therefore the carrying value of payables approximates their fair value. Annual Report WAIKATO DISTRICT COUNCIL 107
110 Note 21 EMPLOYEE ENTITLEMENTS Accounting policy Short-term employee entitlements Employee benefits expected to be settled within 12 months after the end of the period in which the employee renders the related service are measured based on accrued entitlements at current rates of pay. These include salaries and wages accrued up to balance date, annual leave earned to, but not yet taken at balance date, retiring and long service leave entitlements expected to be settled within 12 months, and sick leave. A liability for sick leave is recognised to the extent that absences in the coming year are expected to be greater than the sick leave entitlements earned in the coming year. The amount is calculated based on the unused sick leave entitlement that can be carried forward at balance date, to the extent that it will be used by staff to cover those future absences. A liability and an expense are recognised for bonuses where Strada has a contractual obligation or where there is a past practice that has created a constructive obligation. Long-term employee entitlements Entitlements that are due to be settled beyond 12 months after the end of the period in which the employee renders the related service, such as long service leave and retirement gratuities, have been calculated on an actuarial basis. The calculation is based on: z Likely future entitlements accruing to staff, based on years of service, years to entitlement, the likelihood that staff will reach the point of entitlement and contractual entitlement information; z The present value of the estimated future cash flows; and z An inflation factor based on the expected long term increase in remuneration for employees. Council Group Current portion Annual leave 1,731 1,925 1,731 1,969 Long service leave Sick leave provision Accrued payroll Other employee liabilities Total current portion 2,790 3,184 2,790 3,251 Non-current portion Long service leave Retirement gratuities Sick leave Total non-current portion Total employee entitlements 2,889 3,353 2,889 3, WAIKATO DISTRICT COUNCIL Annual Report
111 Estimating retirement and long service leave obligations The present values of Council s non-current retirement gratuities and long service leave obligations depend on a number of factors that are determined on an actuarial basis. Two key assumptions used in calculating this liability include the discount rate and the salary inflation factor. Any change in these assumptions will affect the carrying amount of the liability. Expected future payments are discounted using forward rates derived from 10 year New Zealand government bonds. The salary inflation factor has been determined in accordance with the inflation factors used in the Long Term Plan. A discount rate of 2.97% (2016: 2.66%) and an inflation factor of 1.4% (2016: 1.81%) have been used. Note 22 BORROWING Accounting policy All borrowing is initially recognised at cost, being the fair value of the consideration received less directly attributable transaction costs. After initial recognition, interest bearing loans and borrowings are measured at amortised cost using the effective interest method. Borrowings are classified as current liabilities unless Council or the Group has an unconditional right to defer settlement of the liability at least 12 months after the balance date. Council Group Current portion LGFA borrowing 20,000-20,000 - Total current portion 20,000-20,000 - Non-current portion LGFA borrowing 60,000 60,000 60,000 60,000 Total non-current portion 60,000 60,000 60,000 60,000 Total borrowing (all secured) 80,000 60,000 80,000 60,000 Council secured debt of $80,000,000 (2016: $60,000,000) is either issued at a fixed rate of interest or has been swapped for fixed interest instruments. Council has 33 swap contracts in place. During the year two swaps matured (2016: two) and four new swap contracts (2016: seven) have been undertaken. Council has 12 (2016: ten) swaps with start dates after 30 June Council s committed cash advance facility of $15,000,000 (2016: $15,000,000) expires on 31 July At 30 June 2017 total borrowings from Local Government Funding Agency Limited (LGFA) were $80,000,000 (2016: $60,000,000). The average rate of interest was 2.79% (2016: 3.16%). Annual Report WAIKATO DISTRICT COUNCIL 109
112 The carrying amounts and the fair values of non-current borrowings are as follows: Carrying amount Fair value Council Secured loans 60,000 60,000 59,474 58,877 Total non-current borrowing 60,000 60,000 59,474 58,877 Group Secured loans 60,000 60,000 59,474 58,877 Total non-current borrowing 60,000 60,000 59,474 58,877 The fair values are based on cash flows discounted using a weighted average rate based on the borrowing rates which range: From 2.6% 3.00% To 2.9% 3.28% Internal loans Council has a policy to utilise investment funds for internal debt purposes so that external borrowing is minimised and Council keeps its borrowing costs to a minimum Balance at 1 July Borrowing Repayments Balance at 30 June Interest paid Water supply 10,080 6,051 (697) 15, Wastewater 9, (710) 9, Stormwater 2, (100) 2, Roading 24, (1,753) 23,535 1,236 Sustainable environment (29) Sustainable communities 14,799 1,801 (765) 15, Governance 1,485 - (723) Organisational support (20) Total internal loans (gross) 64,830 8,875 (4,797) 68,908 3, Water supply 5,893 4,755 (568) 10, Wastewater 10, (659) 9, Stormwater 2, (86) 2, Roading 26, (1,645) 24,898 1,341 Sustainable environment (26) Sustainable communities 12,938 2,470 (609) 14, Governance 2,171 - (686) 1, Organisational support (17) Total internal loans (gross) 60,486 8,640 (4,296) 64,830 3, WAIKATO DISTRICT COUNCIL Annual Report
113 Note 23 PROVISIONS Accounting policy A provision is recognised for future expenditure of uncertain amount or timing when there is a present legal or constructive obligation as a result of a past event, it is probable that an outflow of future economic benefits will be required to settle the obligation and a reliable estimate can be made of the amount of the obligation. Provisions are measured at the present value of the expenditure expected to be required to settle the obligation using a pre-tax discount rate that reflects current market assessments of the time value of money and the risks specific to the obligation. The increase in the provision due to the passage of time (discount unwinding) is recognised as an interest expense and is included in finance costs. Council Group Current portion Weathertightness Landfill aftercare Contract completion Total current portion Non-current portion Landfill aftercare 2,012 1,772 2,012 1,772 Total non-current portion 2,012 1,772 2,012 1,772 Total provisions 2,111 2,441 2,116 2,451 Movements for each class of provision are as follows: Council 2017 Landfill aftercare Weathertightness Total Balance at 1 July , ,441 Change in provision made during the year Amounts used (200) (217) (417) Unused amounts reversed - (227) (227) Discount unwind Balance at 30 June ,111-2, Balance at 1 July , ,052 Change in provision made during the year Amounts used (218) (169) (387) Unused amounts reversed Discount unwind Balance at 30 June , ,441 Annual Report WAIKATO DISTRICT COUNCIL 111
114 Group 2017 Landfill aftercare Weathertightness Contract completion $,000 Total Balance at 1 July , ,451 Change in provision made during the year Amounts used (200) (217) (5) (422) Unused amounts reversed - (227) - (227) Discount unwind Balance at 30 June , , Balance at 1 July , ,068 Change in provision made during the year Amounts used (218) (169) (6) (393) Discount unwind Balance at 30 June , ,451 Weathertightness claims No claims remain with the Weathertight Homes Resolution Service (WHRS) as at 30 June 2017 (2016: two). The 2016 claims related to weathertightness issues of homes in Council s district. A provision for these claims was established based on estimates of Council s share in excess of Council s insurance cover. At 30 June 2017, no further claim had been received directly by Council (2016: one). Landfill aftercare costs Council has five landfill sites within the district. They are at Te Kauwhata, Ngaruawahia, Huntly, Raglan and Tuakau. Council has responsibility under the resource consents to provide ongoing maintenance and monitoring of the landfills after the sites are closed. The cash outflows for landfill post-closure are expected to occur over 35 years. The long term nature of the liability means that there are inherent uncertainties in estimating the costs which will be incurred. The provision has been made taking into account existing technology and known changes to legal requirements. The gross provision before discounting is $4,329,954 (2016: $4,225,245). A discount rate of 5.50% (2016: 5.50%) and an inflation factor of 2.5% (2016: 2.5%) have been used. Contract completion costs Provision for contract completion costs is estimated based on the likelihood of further construction work being required to rectify construction deficiencies. Note 24 DERIVATIVE FINANCIAL INSTRUMENTS Accounting policy Council uses derivative financial instruments to manage exposure to interest rate risks arising from financing activities. In accordance with its treasury policy, Council does not hold or issue derivative financial instruments for trading purposes. Derivatives are initially recognised at fair value on the date a derivative contract is entered into and are subsequently re-measured at their fair value at each balance date. The associated gains or losses on derivatives are recognised in the surplus or deficit. The portion of the fair value of non-hedge accounted interest rate derivatives that is expected to be realised within 12 months of the balance date is classified as current, with the remaining portion of the derivative classified as non-current. 112 WAIKATO DISTRICT COUNCIL Annual Report
115 Council Group Current liability portion Interest rate swaps Non-current liability portion Interest rate swaps 4,719 5,456 4,719 5,456 Total derivative financial instruments liabilities 4,963 5,561 4,963 5,561 The fair values of interest rate swaps are measured against the prevailing market conditions at balance date. The Council s interest rate swaps have been independently valued using Hedgebook software designed to capture, value and report interest rate swaps. Hedgebook uses daily rate feeds of floating rate references such as BKBM and NNSW from industry benchmark sources. The notional principal amounts of outstanding interest rate swap contracts for Council and the Group is: No. No. Active swaps 61, , Forward starting swaps 41, , , , Note 25 REVALUATION RESERVE PROPERTY, PLANT AND EQUIPMENT Council Group Land 69,808 44,029 69,808 44,102 Buildings 30,890 29,624 30,890 29,663 Parks and reserves 19,883 14,225 19,883 14,225 Wastewater 35,585 35,567 35,585 35,567 Water 35,337 35,863 35,337 35,863 Bridges 80,116 73,792 80,116 73,792 Roading 338, , , ,992 Urban stormwater 14,083 11,481 14,083 11,481 Rural drainage Solid waste Balance at 30 June 625, , , ,243 Annual Report WAIKATO DISTRICT COUNCIL 113
116 Note 26 RECONCILIATION OF NET SURPLUS (DEFICIT) AFTER TAX WITH NET CASH FLOWS FROM OPERATING ACTIVITIES Council Group Net surplus (deficit) after tax 21,488 28,896 21,079 25,230 Plus (minus) non-cash items Depreciation, amortisation and asset write-off 29,837 30,152 29,898 30,589 Decrease (increase) in future tax benefits (54) Impairment loss computer software Vested and found assets (13,569) (25,292) (13,569) (25,292) (Gains) losses on fair value of investment property (15) (30) (15) (30) (Gains) losses on derivative financial instruments (599) 3,509 (599) 3,509 (Gains) losses on revaluation of property, plant and equipment (Gains) losses on financial assets - - (317) 165 (Gains) losses on cattle Interest income on financial assets not at fair value through surplus (deficit) (1) (5) (1) (5) Capitalised internal charges (759) (712) (759) (712) Share of joint venture s operating (profit) loss after tax ,438 Gain on cessation of joint venture (105) Impairment of equity accounted investment Plus (minus) items classified as investing or financing activities (Gains) losses on disposal of investment property (47) (Gains) losses on disposal of property, plant and equipment (362) (40) (1,176) (718) Decrease (increase) in creditors for capital expenditure 6,110 10,222 6,110 10,222 Plus (minus) movements in working capital items Receivables and recoverables 3,741 8,350 4,233 8,633 Prepayments (104) (145) (83) (157) Inventories Cattle (16) (18) (16) (18) Payables, taxes and transfers (7,016) (10,523) (7,175) (10,275) Changes in provision (535) 285 (539) 279 Income tax payable Employee entitlements (463) 396 (531) 219 Net cash inflow (outflow) from operating activities 37,867 45,051 36,684 44, WAIKATO DISTRICT COUNCIL Annual Report
117 Note 27 RECONCILIATION OF TOTAL COMPREHENSIVE INCOME WITH NET OPERATING FUNDING (PER FUNDING IMPACT STATEMENT) Council Total comprehensive income wholly attributable to Waikato District Council 96,295 40,873 Surplus (deficit) of operating funding per Whole of Council funding impact statement 15,433 15,670 80,862 25,203 The difference comprises: Capital income 20,941 21,811 Revaluation of assets 64,849 12,072 Revaluation reserve landfill (204) (104) Financial assets at fair value 10,761 (3,500) Depreciation and amortisation (25,132) (22,683) Profit (loss) on sale Write off of assets (4,705) (7,469) Vested and found assets 13,569 25,292 Change in provisions 535 (285) Interest income from financial assets 1 5 Unrealised gains Unrealised losses (130) (6) Total difference 80,862 25,203 Note 28 CAPITAL COMMITMENTS AND OPERATING LEASES Council and Group Capital commitments are for expenditure on: Water 2,082 10,218 Wastewater 2,306 1,736 Stormwater Parks and reserves Buildings operational Roading 50,377 65,629 Bridges 822 2,110 Vehicles / moveable plant Intangible assets Total capital commitments 57,283 80,590 Capital commitments represent capital expenditure contracted for at balance date but not yet incurred. Strada has no significant capital commitments at balance date (2016: $nil). Annual Report WAIKATO DISTRICT COUNCIL 115
118 Operating leases as lessee Council and the Group lease property, plant and equipment in the normal course of business. The leases have non-cancellable terms of between three years three months and five years three months (2016: 12 months and three years three months). The future aggregate minimum lease payments to be paid under non-cancellable operating leases are as follows: Council Group Not later than one year Later than one year and not later than five years Later than five years Total minimum operating lease payments payable Council Council had a contract with Canon NZ for the lease of photocopiers. There are no minimum amounts payable; charges are based on actual volumes of printing. The agreement has been renewed with a term of five years from October No contingent rent was recognised during the period relating to copiers. Council s Tuakau office is leased from Young Investors Limited. The current agreement has a three year term effective from October 2017 with one right of renewal for a further three year term. Other leases may be renewed at Council s option, with rents set by reference to current market rates for items of equivalent age and condition. Council and the Group do not have the option to purchase any assets at the end of the lease term. Strada Strada has no leased property. Operating leases as lessor Council leases community and investment properties and grazing rights under operating leases. The leases have non-cancellable terms ranging from less than one year up to 35 years. The future aggregate minimum lease payments to be collected under non cancellable operating leases are as follows: Council and Group Not later than one year Later than one year and not later than five years 1, Later than five years 1, Total non - cancellable operating leases 2,784 1,991 Council has recognised no contingent rents during the period (2016: $nil). 116 WAIKATO DISTRICT COUNCIL Annual Report
119 Note 29 CONTINGENCIES Contingent liabilities Quantifiable contingent liabilities are as follows: Council Group Guarantee Strada s share of joint venture contingency ,500 Uncalled share capital (LASS ordinary shares) Uncalled share capital (LASS - WRPS shares) Guarantees Strada has no (2016: $343,262) bonds guaranteed by the ANZ National Bank Limited. Outstanding insurance claims There are six outstanding claims (2016: seven) in varying stages of progress. Council is unable to quantify its contingent liability for all (2016: all) of these claims. The maximum Council liability for each of the claims is $10,000 including GST (2016: $10,000) for each claim which is the excess on the insurance policies. manufactured and prepared by CHH. Subsequently, in December 2016, CHH commenced third party proceedings against 48 councils, including Council alleging a breach of duty on the processing of building consents, undertaking building inspections and issuing Code Compliance Certificates. The Councils have applied for orders setting aside and striking out CHH s claims against them. The MOE s claim against CHH is for 833 school buildings, 46 of which are located within Waikato District. At present there is insufficient information to conclude on potential liability and claim quantum, if any. Capital contributions As disclosed in note 14, Council holds four classes of share in Waikato Local Authority Shared Services Limited (LASS). There is uncalled capital on two classes of share. Unquantified claims As disclosed in Note 23, no provision (2016: $444,000) has been recognised for weathertightness claims where Council has received notice of the claim. Council is exposed to potential future claims which have not yet been advised until the statutory limitation period expires. The amount of potential future claims is not able to be reliably measured and is therefore unquantifiable. Claims must be made within ten years of construction or alteration of the dwelling in order for the claim to be eligible under the Weathertight Homes Resolution Services (WHRS) Act 2006, but other statutory limitation periods could also affect claims. In April 2013, the Ministry of Education (MOE) initiated High Court proceedings against Carter Holt Harvey Limited (CHH) and others alleging inherent defects in the cladding sheets and cladding systems Other claims At balance date no other claims (2016: one) expose Council or the Group to contingent liabilities. Council s maximum financial exposure is $nil (2016: $12,000). NZ Local Government Funding Agency Limited (LGFA) Waikato District Council is a guarantor of LGFA. The LGFA was incorporated in December 2011 with the purpose of providing debt funding to local authorities in New Zealand and it has a current credit rating from Standard and Poor s of AA+. Council is one of 44 local authority guarantors - 30 of which are also shareholders of LGFA. The aggregate amount of uncalled shareholder capital ($20m) is available in the event that an imminent default is identified. Also, together with other guarantors and shareholders, Council is guarantor of all LGFA s borrowings. At 30 June 2017 LGFA had borrowings totalling $7.946 billion (2016: $6.501billion). Financial reporting standards require Council to recognise the guarantee liability at fair value. However, Council is unable to determine a sufficiently reliable Annual Report WAIKATO DISTRICT COUNCIL 117
120 fair value of the guarantee and therefore has not recognised a liability. Council considers the risk of LGFA defaulting on payments of interest or capital to be very low on the basis that: z We are not aware of any local authority debt default in New Zealand; and z Local government legislation would enable local authorities to levy a rate to recover sufficient funds to meet any debt obligations if further funds were required. Contingent assets Council is a 35% capital beneficiary of the WEL Energy Trust. The life of the Trust ends in 2073 unless terminated earlier if its purpose is completed. Given the uncertainty surrounding the life of the Trust, Council is unable to accurately establish an appropriate value for the 35% share. Note 30 RELATED PARTY TRANSACTIONS Waikato District Council has a 100% shareholding in Strada Corporation Limited. Strada had a 50% interest in a joint venture with Perry Aggregates Limited. The joint venture is called Waikato Quarries Limited. The joint venture agreement ceased during the last financial year. All related party transactions and related payments are on normal commercial terms. There was no impairment of any of these transactions (2016: nil). The following transactions were carried out between related parties: Group Between Council and Strada Dividend paid by Strada Share capital re-purchased by Strada 2,500 - Capital contribution returned by Strada 1,300 - Road construction and urban services provided by Strada - 1,087 Rates paid to and refuse disposal by Council - 7 Council s accounts payable to Strada - 19 Property purchase 2 & 8A Brownlee Avenue, Ngaruawahia - 1,210 Between Council and Waikato District Community Wellbeing Trust (WBT) Council s accounts receivable from WBT Between Council and Local Authority Shared Services (LASS) Services provided to LASS Charges from LASS Council s accounts payable to LASS Council s accounts receivable from LASS 30 1 Between Council and Waikato Regional Airport Limited (WRAL) Regional Tourism funding payment to WRAL Between Strada and Waikato Quarries Limited (WQL) Lease revenue Deferred settlement receivable from WQL Between Strada and Perry Aggregates Limited Metal purchases by Strada WAIKATO DISTRICT COUNCIL Annual Report
121 Key management personnel compensation Council s key management personnel include the Mayor, Councillors, the Chief Executive and General Managers. The Group enters into various transactions such as rates, water charges and the sale of goods or services with key management personnel in the ordinary course of business and on an arm s length basis. No disclosure has been made for these transactions. Council Remuneration Councillors Senior management team (including CE) 1,055 1,043 Total key management personnel remuneration 1,783 1,753 Actual Actual Full-time equivalent members Councillors Senior management team (including CE) 4 4 Total full-time equivalent personnel Because of the difficulties inherent in estimating the number for full-time equivalent Councillors, the figure used is the number of Councillors. There are close family members of key management personnel employed by Council and the Group. The terms and conditions of these arrangements are no more favourable than they would have been if there were no relationships to key management personnel. Related party transactions requiring disclosure During the year Strada Corporation Limited purchased $8,914 (2016: $77,717) of legal and employment advice from Tompkins Wake in which a Strada director is a partner. There was a balance payable at 30 June 2017 of $160 (2016: $7,583). Annual Report WAIKATO DISTRICT COUNCIL 119
122 Note 31 REMUNERATION Remuneration of elected members Council Councillors Cash benefits A Sanson, Mayor C Baddeley A Bech 28 - J Church R Costar D Fulton J Gibb W Hayes S Henderson 28 - S Lynch B Main 28 - R McGuire F McInally 28 - E Patterson 28 - L Petersen J Sedgwick N Smith M Solomon G Tait L Thomson 28 - Total cash benefits paid to Councillors Non-cash benefits A Sanson, Mayoral car Total non-cash benefits paid to Councillors Total remuneration of Councillors Community board and committee members Cash benefits A Anderson 1 5 J Ayers 1 5 S Boyde 1 5 K Bredenbeck 5 5 B Cameron 9 5 K Clarkson 1 4 K Clelow 1 3 C Conroy WAIKATO DISTRICT COUNCIL Annual Report
123 Council W Diamond 5 5 B Dixon 1 4 R Farrar 5 5 P Forsyth 3 10 R Gee 1 5 E Gouk - 1 F Gower 1 5 W Hansen 1 1 P Haworth 4 1 M Holl - 2 S Jackson 4 - R Kereopa 3 - R Kirkwood 4 - K Kohu - 1 D Lamb 5 5 K Langlands 7 - D Lovell 2 - H Lovell 1 1 R MacLeod 7 4 N Miller 3 10 J Morley 1 - K Morgan 4 - B Mounsey 1 5 S Ormsby-Cocup 1 - A Oosten 3 - G Parson 3 - L Petersen 4 - C Rees 4 - V Reeve 4 - J Ross 1 1 B Sherson 5 5 J Stevens 4 - S Stewart 6 10 E Thomson 1 4 T Tukere - 3 R Van Dam 1 - A Vink 6 8 B Watson 5 5 J Whetu 8 5 Total cash benefits paid to community board and committee members Total remuneration of Councillors and other elected representatives Annual Report WAIKATO DISTRICT COUNCIL 121
124 Remuneration of Chief Executive The Chief Executive of Waikato District Council is appointed under section 42 of the Local Government Act He received a salary of $299,913 (2016: $291,298) in terms of his contract. The Chief Executive s total remuneration included other benefits as follows: Council Salary and other short-term employee benefits Vehicle Defined contribution plan employer contributions (KiwiSaver) 9 9 Expenses allowance 10 3 Other fringe benefits (value of benefit plus FBT) Total Chief Executive s remuneration Employee numbers Number of employees (at 30 June) Actual Council Actual Full-time employees Part-time employees (including casual employees) Total employees A full-time employee works 40 hours per week Full-time equivalent employees Full-time employees Part-time employees (in full-time equivalents) Total full-time equivalent employees Total annual employee remuneration by band Council Actual Actual $0 $60, $60,001 $80, $80,001 $100, $100,001 $120, $120,001 $140, $140,001 $380, Total employees Total remuneration includes non financial benefits provided to employees. There are fewer than five employees on each of the bands above $140,001 therefore the numbers for those bands have been combined in a single band of $140,001 - $380,000. Note 32 SEVERANCE PAYMENTS For the year ended 30 June 2017, Council made one (2016: one) severance payment to an employee amounting to $16,000 (2016: $25,080). Strada made no severance payments to employees during the year (2016: $5,000 paid to 13 employees). 122 WAIKATO DISTRICT COUNCIL Annual Report
125 Note 33 EVENTS AFTER BALANCE DATE No events which provide evidence of conditions existing for Council at balance date have occurred between then and the date these financial statements were authorised for issue. For Strada, no material events are expected to occur subsequent to 30 June Note 34 FINANCIAL INSTRUMENTS A: Financial instruments categories The accounting policies for financial instruments have been applied to the line items below: Council Group Financial assets Loans and receivables Cash and cash equivalents 3,705 4,010 4,473 6,522 Recoverables and receivables 9,345 13,019 9,254 13,468 Community loans Deferred settlement receivable Term deposit 10,590-10,590 - LGFA borrower notes 1, , Total loans and receivables 25,174 18,302 26,361 21,888 Fair value through surplus (deficit) Fixed interest investments - - 1,711 1,578 Equity investments - - 1,951 1,664 Total fair value through surplus (deficit) - - 3,662 3,242 Fair value through other comprehensive income Unlisted shares in NZ Government Insurance Corporation Limited Waikato Regional Airport Limited 12,797-12,797 - Total fair value through other comprehensive income 12, , Financial assets at cost Local Authority Shared Services Limited Shares in Strada Corporation Limited (subsidiary) 700 4, Waikato Regional Airport Limited - 2,639-2,639 Total financial assets at cost 919 7, ,859 Financial liabilities Fair value through surplus (deficit) Derivative financial instruments liabilities 4,963 5,561 4,963 5,561 Financial liabilities at amortised cost Payables, taxes and transfers 17,676 24,692 17,774 24,998 Borrowing -secured loans 80,000 60,000 80,000 60,000 Total financial liabilities at amortised cost 97,676 84,692 97,774 84,998 Annual Report WAIKATO DISTRICT COUNCIL 123
126 B: Fair value hierarchy disclosures For those instruments recognised at fair value in the statement of financial position, fair values are determined according to the following hierarchy: z Quoted market price (level 1): financial instruments with quoted prices for identical instruments in active markets. z Valuation technique using observable inputs (level 2): financial instruments with quoted prices for similar instruments in active markets or quoted prices for identical or similar instruments in inactive markets and financial instruments valued using models where all significant inputs are observable. z Valuation technique with significant non-observable inputs (level 3): financial instruments valued using models where one or more significant inputs are not observable. The following table analyses the basis of the valuation of classes of financial instruments measured at fair value in the statement of financial position: Council Group Valued at quoted market price (level 1) Fixed interest investments - - 1,711 1,578 Equity investments - - 1,951 1,664 Total financial instruments valued at quoted market price - - 3,662 3,242 Valued using observable inputs (level 2) Financial liabilities derivatives 4,963 5,561 4,963 5,561 Valued using significant non-observable inputs (level 3) Unlisted shares 12, , Instruments valued using significant non-observable inputs (level 3) The table below provides a reconciliation between the opening and closing balances for level 3 financial instruments: Group Balance at 1 July Gains and losses recognised in other comprehensive income 10,162 9 Other movements - - Balance at 30 June 10, There were no transfers between the different levels of the fair value hierarchy. C: Financial instruments risks Council has a series of policies to manage the risks associated with financial instruments. Council is risk averse and seeks to minimise exposure from its treasury activities. Council has established and approved a Treasury Risk Management Policy which includes a Liability Management Policy and an Investment Policy. These policies do not allow any transactions that are speculative in nature to be entered into. Market risk Price risk Price risk is the risk that the fair value or future cash flows of a financial instrument will fluctuate as a result of 124 WAIKATO DISTRICT COUNCIL Annual Report
127 change in market prices. Council has no exposure to price risk because it does not hold any listed securities. Equity securities price risk arises on listed equity investments which are held by the Waikato District Community Wellbeing Trust (WBT) and are classified as financial assets held at fair value through surplus or deficit. The price risk arises due to market movements in listed share prices. Gareth Morgan Investments Limited (GMI) which manages the investment portfolio on behalf of the trustees, manages price risk via diversification and liquidity of investments. Currency risk Currency risk is the risk that the fair value or future cash flows of a financial instrument will fluctuate due to changes in foreign exchange rates. Council is not exposed to currency risk, as it has minimum foreign currency transactions. WBT holds investments in foreign currencies and is exposed to currency risk. GMI, on behalf of the trustees, enters into forward currency contracts on all fixed interest investments. The default currency exposure for equity investments is 50%. Fair value interest rate risk Fair value interest rate risk is the risk that the value of a financial instrument will fluctuate due to changes in market in interest rates. Borrowings and investments issued at fixed rates of interest expose Council to interest rate risk. Council s Treasury Risk Management Policy sets a range of control limits for the fixed rate proportion of borrowings with different maturities. The range is from a maximum of 100% for debt maturing in the current period through to 55% for debt maturing in ten years. GMI actively manages the average maturity date of WBT s fixed interest investments in response to changes in GMI s interest rate view. Cash flow interest rate risk Cash flow interest rate risk is the risk that the cash flows from a financial instrument will fluctuate because of changes in market interest rates. Borrowings and investments issued at variable interest rates expose Council to cash flow interest rate risk. GMI actively manages the average maturity date of WBT s fixed interest investments in response to changes in GMI s interest rate view. Generally, Council raises long term borrowing at floating rates and swaps them into fixed rates using interest rate swaps to manage the cash flow interest rate risk. Council enters into interest rate swaps in order to manage the cash flow interest rate risk. Such interest rate swaps have the economic effect of converting borrowings at floating rates into fixed rates that are generally lower than those available if Council borrowed at fixed rates directly. Under the interest rate swaps, Council agrees with other parties to exchange, at specified intervals, the difference between fixed contract rates and floating rate interest amounts calculated by reference to the agreed notional principal amounts. Credit risk Credit risk is the risk that a third party will default on its obligation to Council and the Group, causing it to incur a loss. Council s Treasury Risk Management Policy clearly specifies approved institutions, minimum credit ratings and investment limits. WBT is consolidated into Council s group financial statements and also includes cash and fixed interest securities that are a credit risk. GMI, on behalf of the trustees of WBT invests only in fixed interest investments in liquid securities, which means there is a secondary market available where these assets are readily traded. In addition, GMI invest primarily in investment-grade instruments and has established counterparty limits for fixed interest investments depending on their credit rating. Council is exposed to credit risk as a guarantor of all of LGFA s borrowings. Information about this exposure is explained in Note 29. Council and the Group have no other collateral or credit enhancements for financial instruments that give rise to credit risk. Annual Report WAIKATO DISTRICT COUNCIL 125
128 Maximum exposure to credit risk Council s maximum credit risk exposure for each class of financial instrument is as follows: Council Group Cash and cash equivalents 3,705 4,010 4,473 6,522 Recoverables and receivables 9,345 13,019 9,254 13,468 Term deposits 10,590-10,590 - Community loans Deferred settlement receivable Fixed interest investments - - 1,711 1,578 Equity investments - - 1,951 1,664 LGFA borrower notes 1, , Total credit risk 25,174 18,302 30,023 25,130 The credit quality of financial assets that are neither past due nor impaired can be assessed by reference to Standard and Poor s credit ratings (if available) or to historical information about counterparty default rates: Council Group Counterparties with credit ratings Cash and cash equivalents AA- 3,705 4,010 4,473 6,522 Term deposits AA- 10,590-10,590 - Fixed interest investments AA ,558 A BBB BBB Borrower notes AA+ 1, , Counterparties without credit ratings Community and related party loans Community loans with no defaults in the past Deferred settlement receivable with no default in the past Unrated equity investments 13,716 7,359 14,967 9,024 Unrated fixed interest investments - - 1,711 - Debtors and other receivables mainly arise from Council s statutory functions, therefore there are no procedures in place to monitor or report the credit quality of debtors and other receivables with reference to internal or external credit ratings. Council has no significant concentrations of credit risk in relation to debtors and other receivables, as it has a large number of credit customers, mainly ratepayers, and Council has powers under the Local Government (Rating) Act 2002 to recover outstanding debts from ratepayers. 126 WAIKATO DISTRICT COUNCIL Annual Report
129 Liquidity risk Management of liquidity risk Liquidity risk is the risk that Council will encounter difficulty raising liquid funds to meet commitments as they fall due. Prudent liquidity risk management implies maintaining sufficient cash, the availability of funding through an adequate amount of committed credit facilities and the ability to close out market positions. Council aims to maintain flexibility in funding by keeping committed credit lines available. Council manages its liquidity risks including borrowings in accordance with its Treasury Risk Management Policy, which includes a Liability Management Policy. These policies have been adopted as part of Council s Long Term Plan. Council has a $500,000 overdraft facility (2016: $500,000) and a committed cash advance facility of $15,000,000 (2016: $15,000,000), of which $15,000,000 (2016 $15,000,000) is available to be drawn. Council s committed cash advance facility expires July Council utilises funding through the Local Government Funding Agency Limited (LGFA). As at 30 June 2017 Council had borrowed $80,000,000 (2016: $60,000,000) and held borrower notes with a face value of $1,280,000 (2016: $960,000). Council is also exposed to liquidity risk as a guarantor of all of LGFA s borrowings. This guarantee becomes callable in the event of the LGFA failing to pay its borrowings when they fall due. Information about this exposure is contained in Note 29. Contractual maturity analysis of financial liabilities, excluding derivatives The table below analyses Council and the Group s financial liabilities into relevant maturity groupings based on the remaining period at the balance date to the contractual maturity date. Future interest payments on floating rate debt are based on the floating rate on the instrument at balance date. The amounts disclosed are the contractual undiscounted cash flows and include interest payments. Council Group Carrying amount Payables, taxes and transfers 17,676 24,692 17,774 24,998 Secured loans 80,000 60,000 80,000 60,000 Total carrying amount 97,976 84,692 97,774 84,998 Contractual cash flows Payables, taxes and transfers 17,676 24,692 17,774 24,998 Secured loans 89,389 69,589 89,389 69,589 Total contractual cash flows 107,065 94, ,163 94,587 Annual Report WAIKATO DISTRICT COUNCIL 127
130 The following table summarises the pattern of contractual cash flows: Less than 1 yr 1-2 yrs 2-5 yrs More than 5 yrs Council 2017 Payables, taxes and transfers 17, Secured loans 21,924 11,585 23,354 32,526 Total 39,600 11,585 23,354 32,526 Council 2016 Payables, taxes and transfers 24, Secured loans 1,897 1,897 38,392 27,403 Total 26,589 1,897 38,392 27,403 Group 2017 Payables, taxes and transfers 17, Secured loans 21,924 11,585 23,354 32,526 Total 39,698 11,585 23,354 32,526 Group 2016 Payables, taxes and transfers 24, Secured loans 1,897 1,897 38,392 27,403 Total 26,895 1,897 38,392 27,403 Contractual maturity analysis of derivative financial instruments The table below analyses Council and the Group s derivative financial instruments into those that will be settled on a net basis and those that will be settled on a gross basis in relevant maturity groupings based on the remaining period at balance date to the contractual maturity date. The amounts disclosed are the contractual undiscounted cash flows. Council Group Net settled derivative liabilities Carrying amount 4,963 5,561 4,963 5,561 Contractual cash flows 6,108 10,624 6,108 10,624 Net settled derivative liabilities Less than 1 yr 1-2 yrs 2-5 yrs More than 5 yrs 1,195 1,298 2,458 1,157 1,365 1,446 4,038 3, WAIKATO DISTRICT COUNCIL Annual Report
131 Contractual maturity analysis of financial assets The table below analyses Council and the Group s financial assets into relevant maturity groupings based on the remaining period at the balance date to the contractual maturity date. The amounts disclosed are the contractual undiscounted cash flows and include interest receipts. Council Group Carrying amount Cash and cash equivalents 3,705 4,010 4,473 6,522 Recoverables and receivables 9,345 13,019 9,890 14,170 Other financial assets term deposit 10,590-10,590 - community loans deferred settlement receivable LGFA borrower notes 1, , Total carrying amount 25,174 18,302 26,997 21,965 Contractual cash flows Cash and cash equivalents 3,705 4,010 4,473 6,522 Recoverables and receivables 9,345 13,019 9,890 14,170 Other financial assets term deposit 10,831-10,831 - community loans deferred settlement receivable LGFA borrower notes 1,411 1,067 1,411 1,067 Total contractual cash flows 25,592 18,473 27,415 22,761 Annual Report WAIKATO DISTRICT COUNCIL 129
132 The following table summarises the pattern of contractual cash flows: Less than 1 yr 1-2 yrs 2-5 yrs More than 5 yrs Council 2017 Cash and cash equivalents 3, Recoverables and receivables 9, Other financial assets term deposit 10, community loans LGFA borrower notes Total 24, Council 2016 Cash and cash equivalents 4, Recoverables and receivables 13, Other financial assets community loans LGFA borrower notes Total 17, Less than 1 yr 1-2 yrs 2-5 yrs More than 5 yrs Group 2017 Cash and cash equivalents 4, Recoverables and receivables 9, Other financial assets term deposit 10, community loans deferred settlement receivable LGFA borrower notes Total 25, Group 2016 Cash and cash equivalents 6, Recoverables and receivables 13, Other financial assets community loans loans to related parties LGFA borrower notes Total 20, , WAIKATO DISTRICT COUNCIL Annual Report
133 Sensitivity analysis The tables below illustrate the potential effect on the surplus or deficit and equity (excluding accumulated funds) for reasonably possible market movements, with all other variables held constant, based on Council and the Group s financial instrument exposures at the balance date. Interest rate risk Council Financial assets Actual -100bps Actual +100bps Actual -100bps Actual +100bps Cash and cash equivalents (37) 37 (40) 40 Financial liabilities Derivatives (3,854) 3,560 (2,628) 2,456 Group Financial assets Cash and cash equivalents (45) 45 (40) 40 Financial liabilities Derivatives (3,854) 3,560 (2,628) 2,456 Foreign exchange risk Group Financial assets Actual -100bps Actual +100bps Actual -100bps Actual +100bps Cash and cash equivalents 19 (19) 16 (16) Equity price risk Group Financial assets Actual -100bps Actual +100bps Actual -100bps Actual +100bps Equity investments 20 (20) 12 (12) Explanations of sensitivity analysis The interest rate, foreign exchange and equity price sensitivities are based on reasonably possible movements in interest rates, exchange rates and equity market valuations; with all other variables held constant, measured as a basis points (bps) movement. For example, a decrease in 100bps is equivalent to a decrease in interest rates of 1 per cent. The sensitivity for derivatives (interest rate swaps) has been calculated using a derivative valuation model based on a parallel shift in interest rates of -100bps/+100bps ( bps/+100bps). Annual Report WAIKATO DISTRICT COUNCIL 131
134 Note 35 CAPITAL MANAGEMENT Council s capital is its equity (or ratepayers funds) which include accumulated funds and other reserves. Equity is represented by net assets. The Local Government Act 2002 (the Act) requires Council to manage its revenues, expenses, assets, liabilities, investments and general financial dealings prudently and in a manner which promotes the current and future interests of the community. Ratepayers funds are largely managed as a by-product of managing revenues, expenses, assets, liabilities, investments and general financial dealings. The objective of managing these items is to achieve intergenerational equity which is a principle promoted in the Act and applied by Council. Intergenerational equity requires today s ratepayers to meet the costs of utilising Council s assets and not expecting them to meet the full cost of long term assets that will benefit ratepayers in future generations. Additionally, Council has in place asset management plans for major classes of asset detailing renewal and maintenance programmes to ensure ratepayers in future generations are not required to meet the costs of deferred renewals and maintenance. The Act requires Council to make adequate and effective provision in its Long Term Plan (LTP) and in its Annual Plan (where applicable) to meet the expenditure needs identified in those plans. The Act also sets out the factors that Council is required to consider when determining the most appropriate sources of funding for each of its activities. The sources and levels of funding are set out in the funding and financing policies in Council s LTP. Council has the following Council-created reserves: z reserves for different areas of benefit; z self-insurance reserves; and z trust and bequest reserves. Reserves for different areas of benefit are used where there is a discrete set of rate or levy payers as distinct from payers of general rate. Any surplus or deficit relating to these separate areas of benefit is applied to the specific reserve. Self-insurance reserves are built up annually from general rates and are made available for specific unforeseen events. The release of these funds generally can be approved only by Council. Trust and bequest reserves are set up where Council has been donated funds that are restricted for particular purposes. Interest is added to trust and bequest reserves where applicable and deductions are made where funds have been used for the purpose they were donated. Note 36 EXPLANATION OF MAJOR VARIANCES AGAINST BUDGET The major variance explanations are set out below and explain the significant differences between actual results for compared to the budget for. Overall revenue was greater than budgeted mainly due to vested asset income not being budgeted. Also not budgeted was the gain on fair value change of derivative financial assets. Subsidy income was greater due to more NZTA funding because of adverse weather events and emergency works required during the year. Development and financial contributions were also greater because financial contributions were not budgeted. Rates revenue was lower than budgeted, specifically in relation to water-by-meter charging. This variance relates to a difference in the level of assumed water-by-meter consumption and actual consumption. Overall expenses were greater than budget. Asset write-offs occur when assets are disposed and were not budgeted. Less was spent on employees compared to budget due to vacancies during the year and that was offset by more spent on consultants to cover staff shortages and to meet increased demand for services particularly in the regulatory area. At an operating level the surplus was $6.7m above budget. 132 WAIKATO DISTRICT COUNCIL Annual Report
135 Total comprehensive income was $96.3m and was $56m above budget. Other comprehensive revenue was significantly increased due to revaluation of assets accounting for $39m of the difference to budget. The land and buildings classes were revalued this year ahead of the planned revaluation in the following year so were not budgeted. Land values increased significantly during the two years since the last valuation was carried out in 2015 and reflects a more buoyant property market of recent times. Road assets revalued also showed an increase compared to budget due to a higher actual escalation of replacement costs than was budgeted. In addition other comprehensive income was increased by a change to valuing Council s interest in the Waikato Regional Airport Limited to fair value which increased comprehensive income by $10.15m. The statement of financial position shows an increase in overall net assets of $53m compared to budget. The biggest variance was for property, plant and equipment being $41m above budget due to the revaluations as explained above. Total assets were $39m above budget and total liabilities were $14m below budget. Borrowings were close to budget and whilst cash and cash equivalents are less than budget this is offset by an increase in term deposits where funds have been held as part of cash flow planning around repayment of some borrowings during the 2017/18 year. Note 37 INSURANCE OF ASSETS The total value of all assets of Council that are covered by insurance contracts as at 30 June 2017 is $556,169,327 (2016: $529,566,063) and the maximum amount to which they are insured is $189,402,124 (2016: $189,263,759).). Insurance class Total declared value Policy limit Infrastructure $343,592,576 $6,000,000 per loss (primary layer contracts provide for recovery of 100% of the costs of loss or damage to declared assets) $35,000,000 per loss (for anything that falls outside the primary layer cover, these insurance contracts provide for the recovery of 40% of the cost of loss or damage to declared assets) Material Damage $208,174,627 $150,000,000 (each and every loss and in the annual aggregate) Motor Vehicle $3,987,194 $3,987,194 Other $414,930 $414,930 Total $556,169,327 $189,402,124 $125,000,000 (each and every loss and in the annual aggregate for Fire losses) In addition to the insurance contracts noted above, the council maintains a disaster recovery reserve to meet the costs of damage that may not be recoverable through insurance. At 30 June 2017 the balance of this reserve was $483,083 (2016: $1,306,928). Annual Report WAIKATO DISTRICT COUNCIL 133
136 OTHER LEGISLATIVE DISCLOSURES Funding impact statement Whole of Council Annual plan Annual report Annual plan Actual Sources of operating funding General rates, uniform annual general charge, rates penalties 49,798 50,300 51,604 52,394 Targeted rates 21,191 18,889 21,557 19,863 Subsidies and grants for operating purposes 8,412 7,886 8,047 8,143 Fees and charges 7,254 7,595 9,725 9,233 Interest and dividends from investments Local authorities fuel tax, fines, infringement fees, and other receipts 5,599 8,663 7,976 9,038 Total operating funding 92,654 93,932 99,409 99,526 Applications of operating funding Payments to staff and suppliers 68,846 71,372 74,556 77,828 Finance costs 3,008 4,149 3,588 3,549 Other operating funding applications 2,162 2,741 2,355 2,716 Total applications of operating funding 74,016 78,262 80,499 84,093 Surplus (deficit) of operating funding 18,638 15,670 18,910 15,433 Sources of capital funding Subsidies and grants for capital expenditure 9,577 11,995 9,494 11,174 Development and financial contributions 8,015 9,454 8,217 8,547 Increase (decrease) in debt 18,129 7,050 19,142 20,000 Gross proceeds from the sale of assets 218 1, ,537 Lump sum contributions Other dedicated capital funding 1, ,220 Total sources of capital funding 37,527 29,869 37,163 43,478 Applications of capital funding Capital expenditure to meet additional demand 11,200 13,073 9,360 9,381 to improve the level of service 11,649 11,230 12,945 12,264 to replace existing assets 25,623 25,639 25,826 26,597 Increase (decrease) in reserves 7,464 1,805 7,700 3,924 Increase (decrease) in investments 229 (6,208) 242 6,745 Total applications of capital funding 56,165 45,539 56,073 58,911 Surplus (deficit) of capital funding (18,638) (15,670) (18,910) (15,433) Funding balance for Whole of Council WAIKATO DISTRICT COUNCIL Annual Report
137 Funding impact statement Water supply Long term plan Long term plan Actual Sources of operating funding General rates, uniform annual general charge, rates penalties Targeted rates 9,450 10,129 7,681 Subsidies and grants for operating purposes Fees and charges Internal charges and overheads recovered Local authorities fuel tax, fines, infringement fees and other receipts Total operating funding 9,837 10,630 8,520 Applications of operating funding Payments to staff and suppliers 3,502 3,702 3,360 Finance costs Internal charges and overheads applied 3,057 3,374 2,894 Other operating funding applications Total applications of operating funding 6,597 7,116 6,436 Surplus (deficit) of operating funding 3,240 3,514 2,084 Sources of capital funding Subsidies and grants for capital expenditure Development and financial contributions 1,795 1,841 1,833 Increase (decrease) in debt 5,512 4,573 6,054 Gross proceeds from the sale of assets Lump sum contributions Other dedicated capital funding Total sources of capital funding 7,395 6,507 7,998 Applications of capital funding Capital expenditure to meet additional demand 4,053 2,472 4,346 to improve the level of service 4,481 3,527 5,820 to replace existing assets 1,814 1,890 2,138 Increase (decrease) in reserves 287 2,132 (2,222) Increase (decrease) in investments Total applications of capital funding 10,635 10,021 10,082 Surplus (deficit) of capital funding (3,240) (3,514) (2,084) Funding balance for Water supply Annual Report WAIKATO DISTRICT COUNCIL 135
138 Funding impact statement Wastewater Long term plan Long term plan Actual Sources of operating funding General rates, uniform annual general charge, rates penalties Targeted rates 5,866 6,642 7,081 Subsidies and grants for operating purposes Fees and charges 1,524 1, Internal charges and overheads recovered Local authorities fuel tax, fines, infringement fees, and other receipts Total operating funding 7,903 8,759 8,534 Applications of operating funding Payments to staff and suppliers 2,585 3,072 4,713 Finance costs Internal charges and overheads applied 3,608 3,713 3,210 Other operating funding applications Total applications of operating funding 6,295 6,892 8,256 Surplus (deficit) of operating funding 1,608 1, Sources of capital funding Subsidies and grants for capital expenditure Development and financial contributions 1,796 1,841 1,478 Increase (decrease) in debt 184 2, Gross proceeds from the sale of assets Lump sum contributions Other dedicated capital funding Total sources of capital funding 1,980 3,904 1,902 Applications of capital funding Capital expenditure to meet additional demand to improve the level of service 184 2,063 1,105 to replace existing assets 2,415 2,288 2,281 Increase (decrease) in reserves (2,008) Increase (decrease) in investments Total applications of capital funding 3,588 5,771 2,180 Surplus (deficit) of capital funding (1,608) (1,867) (278) Funding balance for Wastewater WAIKATO DISTRICT COUNCIL Annual Report
139 Funding impact statement Stormwater Long term plan Long term plan Actual Sources of operating funding General rates, uniform annual general charge, rates penalties Targeted rates 1,610 1,651 1,694 Subsidies and grants for operating purposes Fees and charges Internal charges and overheads recovered Local authorities fuel tax, fines, infringement fees, and other receipts Total operating funding 1,894 1,978 2,138 Applications of operating funding Payments to staff and suppliers Finance costs Internal charges and overheads applied Other operating funding applications Total applications of operating funding 1,030 1,265 1,126 Surplus (deficit) of operating funding ,012 Sources of capital funding Subsidies and grants for capital expenditure Development and financial contributions Increase (decrease) in debt Gross proceeds from the sale of assets Lump sum contributions Other dedicated capital funding Total sources of capital funding 1,168 1, Applications of capital funding Capital expenditure to meet additional demand to improve the level of service to replace existing assets Increase (decrease) in reserves ,348 Increase (decrease) in investments Total applications of capital funding 2,032 2,610 1,894 Surplus (deficit) of capital funding (864) (713) (1,012) Funding balance for Stormwater Annual Report WAIKATO DISTRICT COUNCIL 137
140 Funding impact statement Roading Long term plan Long term plan Actual Sources of operating funding General rates, uniform annual general charge, rates penalties 18,927 19,195 18,703 Targeted rates Subsidies and grants for operating purposes 8,412 8,429 7,965 Fees and charges Internal charges and overheads recovered 4,384 4,514 1,408 Local authorities fuel tax, fines, infringement fees, and other receipts ,336 Total operating funding 32,293 32,724 30,568 Applications of operating funding Payments to staff and suppliers 17,945 18,242 18,329 Finance costs Internal charges and overheads applied 5,939 6,283 4,186 Other operating funding applications - - (16) Total applications of operating funding 23,884 24,525 22,499 Surplus (deficit) of operating funding 8,409 8,199 8,069 Sources of capital funding Subsidies and grants for capital expenditure 9,577 9,494 9,827 Development and financial contributions 1,673 1,715 2,713 Increase (decrease) in debt 2,270 2, Gross proceeds from the sale of assets Lump sum contributions Other dedicated capital funding 1, Total sources of capital funding 15,020 13,335 13,100 Applications of capital funding Capital expenditure to meet additional demand 4,290 4,645 2,440 to improve the level of service 4,186 2,343 1,106 to replace existing assets 17,070 17,240 17,194 Increase (decrease) in reserves (2,117) (2,694) 429 Increase (decrease) in investments Total applications of capital funding 23,429 21,534 21,169 Surplus (deficit) of capital funding (8,409) (8,199) (8,069) Funding balance for Roading WAIKATO DISTRICT COUNCIL Annual Report
141 Funding impact statement Sustainable environment Long term plan Long term plan Actual Sources of operating funding General rates, uniform annual general charge, rates penalties 6,688 6,773 6,955 Targeted rates 3,482 2,459 2,594 Subsidies and grants for operating purposes Fees and charges 3,989 6,085 6,694 Internal charges and overheads recovered Local authorities fuel tax, fines, infringement fees, and other receipts 2,857 2,913 3,551 Total operating funding 17,674 18,898 20,473 Applications of operating funding Payments to staff and suppliers 12,443 13,760 15,949 Finance costs Internal charges and overheads applied 5,316 5,547 5,352 Other operating funding applications Total applications of operating funding 17,768 19,314 21,419 Surplus (deficit) of operating funding (94) (416) (946) Sources of capital funding Subsidies and grants for capital expenditure Development and financial contributions Increase (decrease) in debt Gross proceeds from the sale of assets Lump sum contributions Other dedicated capital funding Total sources of capital funding Applications of capital funding Capital expenditure to meet additional demand to improve the level of service to replace existing assets Increase (decrease) in reserves (164) (1,072) (1,196) Increase (decrease) in investments Total applications of capital funding (94) (262) (907) Surplus (deficit) of capital funding Funding balance for Sustainable environment Annual Report WAIKATO DISTRICT COUNCIL 139
142 Funding impact statement Sustainable communities Long term plan Long term plan Actual Sources of operating funding General rates, uniform annual general charge, rates penalties 17,487 18,421 18,856 Targeted rates Subsidies and grants for operating purposes Fees and charges 1,546 1,590 1,426 Internal charges and overheads recovered Local authorities fuel tax, fines, infringement fees, and other receipts 1,396 1,429 1,837 Total operating funding 21,345 22,362 23,269 Applications of operating funding Payments to staff and suppliers 13,231 13,100 13,014 Finance costs Internal charges and overheads applied 5,301 5,570 5,843 Other operating funding applications Total applications of operating funding 19,046 19,258 19,407 Surplus (deficit) of operating funding 2,299 3,104 3,862 Sources of capital funding Subsidies and grants for capital expenditure - - 1,308 Development and financial contributions 1,819 1,865 1,818 Increase (decrease) in debt 1,798 3,394 1,801 Gross proceeds from the sale of assets - - 2,248 Lump sum contributions Other dedicated capital funding Total sources of capital funding 3,617 5,259 8,113 Applications of capital funding Capital expenditure to meet additional demand 1, ,450 to improve the level of service 1,480 3,563 3,806 to replace existing assets 2,108 1,661 2,860 Increase (decrease) in reserves 435 2,247 3,859 Increase (decrease) in investments Total applications of capital funding 5,916 8,363 11,975 Surplus (deficit) of capital funding (2,299) (3,104) (3,862) Funding balance for Sustainable communities WAIKATO DISTRICT COUNCIL Annual Report
143 Funding impact statement Governance Long term plan Long term plan Actual Sources of operating funding General rates, uniform annual general charge, rates penalties 6,229 6,420 6,456 Targeted rates Subsidies and grants for operating purposes Fees and charges Internal charges and overheads recovered 1,046 1,073 1,243 Local authorities fuel tax, fines, infringement fees, and other receipts Total operating funding 7,478 7,942 8,147 Applications of operating funding Payments to staff and suppliers 2,427 2,770 2,835 Finance costs Internal charges and overheads applied 4,375 4,458 5,184 Other operating funding applications Total applications of operating funding 6,802 7,228 8,022 Surplus (deficit) of operating funding Sources of capital funding Subsidies and grants for capital expenditure Development and financial contributions Increase (decrease) in debt Gross proceeds from the sale of assets Lump sum contributions Other dedicated capital funding Total sources of capital funding Applications of capital funding Capital expenditure to meet additional demand to improve the level of service to replace existing assets Increase (decrease) in reserves Increase (decrease) in investments Total applications of capital funding Surplus (deficit) of capital funding (676) (714) (125) Funding balance for Governance Annual Report WAIKATO DISTRICT COUNCIL 141
144 Funding impact statement Organisational support Long term plan Long term plan Actual Sources of operating funding General rates, uniform annual general charge, rates penalties Targeted rates Subsidies and grants for operating purposes Fees and charges Internal charges and overheads recovered 30,871 32,389 31,588 Local authorities fuel tax, fines, infringement fees, and other receipts 1,045 1,147 1,864 Total operating funding 31,962 34,011 33,826 Applications of operating funding Payments to staff and suppliers 18,767 19,400 19,735 Finance costs 3,008 3,968 3,549 Internal charges and overheads applied 7,056 7,442 8,062 Other operating funding applications 1,495 1,630 1,531 Total applications of operating funding 30,326 32,440 32,877 Surplus (deficit) of operating funding 1,636 1, Sources of capital funding Subsidies and grants for capital expenditure Development and financial contributions Increase (decrease) in debt 8,129 3,763 11,155 Gross proceeds from the sale of assets Lump sum contributions Other dedicated capital funding Total sources of capital funding 8,347 3,980 11,444 Applications of capital funding Capital expenditure to meet additional demand to improve the level of service 1, to replace existing assets 2,126 2,328 1,940 Increase (decrease) in reserves 6,596 2,972 3,591 Increase (decrease) in investments ,745 Total applications of capital funding 9,983 5,551 12,393 Surplus (deficit) of capital funding (1,636) (1,571) (949) Funding balance for Organisational support WAIKATO DISTRICT COUNCIL Annual Report
145 Explanation of major variances against budget for funding impact statements The whole of Council funding impact statement reports cash or soon to be cash items (such as income or expenses in receivables or payables) and does not consider non-cash funded items such as asset write-offs or assets vested in Council. The report analyses separately the surplus or deficit for operating funding and capital funding. This year the overall operating funding surplus was $15.4m. It was $3.5m less than budget due to additional costs while the total sources of operating funding (income) was close to budget. Targeted rates were less than budget due to over estimation of chargeable water. There was additional other income from increased services in the regulatory area. The additional costs were mainly from an increase in consultant costs due to works that were not budgeted and included extra work in the regulatory area to keep up with the demand for services. There was also additional spend in the wastewater area because a continuous improvement plan was adopted for wastewater. The work was carried out using additional funding provided during the year. Sources of capital funding increased by $6.3m compared to budget. Increased subsidy income was received from NZTA due to storm damage and emergency works that arose during the year. Proceeds from sale of assets were more than budgeted and include property sales that were not planned. Other dedicated funding for the Te Awa cycle way was also not budgeted. At a whole of Council level capital expenditure overall was close to budget. Some projects for improving the level of service were delayed for more consultation and planning such as the Ngaruawahia community facility project and the Huntly wastewater upgrade project. Other projects were completed using budgets carried forward from the prior year for projects such as the Hopuhopu Reservoir and the Te Awa River Ride. The group of activities funding impact statements compare the actual to the LTP budget (whereas the whole of Council funding impact statement compares to the annual plan for ). The organisational support activity includes the treasury function for Council; therefore this activity includes external finance costs for all of Council which were slightly less than was budgeted due to a reduction of average interest rates compared to those used in the LTP budget. Also compared to the LTP budget there is an increase in debt but this is offset by an increase in investments. Annual Report WAIKATO DISTRICT COUNCIL 143
146 Annual report disclosure statement For the year ended 30 June 2017 What is the purpose of this statement? The purpose of this statement is to disclose Council s financial performance in relation to various benchmarks to enable the assessmentof whether Council is prudently managing its revenues, expenses, assets, liabilities and general financial dealings. Council is required to include this statement in its annual report in accordance with the Local Government (Financial Reporting and Prudence) Regulations 2014 (the regulations). Refer to the regulations for more information, including definition of some of the terms used in this statement. Rates affordability benchmark Council meets the rates affordability benchmarks if: z its actual rates income equals or is less than each quantified limit on rates; and z its actual rates increases equal or are less than each quantified limit on rates increases. Rates (income) affordability This graph compares Council s actual rates income with a quantified limit on rates contained in the financial strategy included in Council s long-term plan. The quantified limit for the current year is an average total rate per rateable property of $2,888. Average $ s per rateable property $3,000 $2,800 $2,600 $2,400 $2,200 $2, / / /15 Year Quantified limit on rates income Actual rates income (at or within limit) Actual rates income (exceeds limit) Rates (increases) affordability This graph compares Council s actual rates increases with a quantified limit on rates increases included in the financial strategy included in Council s long-term plan. The quantified limit on increases is 4% of the previous year s rates per rateable property. % Revenue increase per annum 6.0% 5.0% 4.0% 3.0% 2.0% 1.0% 0.0% 2012/ / /15 Year Quantified limit on rates increase Actual rates increase (at or within limit) Actual rates increase (exceeds limit) 144 WAIKATO DISTRICT COUNCIL Annual Report
147 Debt affordability benchmarks Council meets the debt affordability benchmarks if its actual borrowing is within each quantified limit on borrowing. Debt limit 1 This graph compares Council s actual borrowing with a quantified limit on borrowing stated in the financial strategy included in Council s long-term plan. The quantified limit on net debt is $177 million. $180 $160 $140 $120 $100 $80 $60 $40 $20 $0 2012/ / /15 Year debt ($m) Quantified limit on debt Actual debt (at or within limit) Actual debt (exceeds limit) Debt limit 2 This graph compares Council s actual borrowing with a quantified limit on borrowing stated in the financial strategy included in Council s long-term plan. The quantified limit on net debt per rateable property is $5,999. Average debt per rateable property $7,000 $6,000 $5,000 $4,000 $3,000 $2,000 $1, / / /15 Year Quantified limit debt Actual debt (at or within limit) Exceeds limit Annual Report WAIKATO DISTRICT COUNCIL 145
148 Balanced budget benchmark This graph displays Council s revenue (excluding development contributions; financial contributions; vested assets; gains on derivative financial instruments and revaluations of property, plant or equipment) as a proportion of operating expenses (excluding losses on derivative financial instruments and revaluations of property, plant or equipment). Revenue/expenditure (%) % /13 Benchmark met 104% 102% 98% 99% 2013/ /15 Year Benchmark not met Benchmark Council meets this benchmark if its revenue is equal to or greater than its operating expenses. Essential services benchmark This graph displays Council s capital expenditure on network services as a proportion of depreciation on network services. Council meets this benchmark if its capital expenditure on network services equals or is greater than depreciation on network services. Capital expenditure/depreciation (%) % 2012/13 290% 250% 2013/ /15 Year 210% 197% Benchmark met Benchmark not met Benchmark Debt servicing benchmark This graph displays Council s borrowing costs as a proportion of revenue (excluding development contributions, financial contributions, vested assets, gains on derivative financial instruments and revaluations of property plant or equipment). Borrowing costs/revenue (%) % 2.4% 2.7% 4.0% 3.3% 2012/ / /15 Year Because Statistics New Zealand projects that Council s population will grow faster than the national population growth rate, it meets the debt servicing benchmark if its borrowing costs equal or are less than 15% of its planned revenue. Benchmark met Benchmark not met Benchmark 146 WAIKATO DISTRICT COUNCIL Annual Report
149 Debt control benchmark This graph displays Council s actual net debt as a proportion of planned net debt. In this statement, net debt means financial liabilities less financial assets (excluding trade and other receivables). Council meets the debt control benchmark if its actual net debt equals or is less than planned net debt. Actual/budgeted net debt (%) % 50% 78% 92% 82% / / /15 Year Benchmark met Benchmark not met Benchmark Operations control benchmark This graph displays Council s actual net cash flow from operations as a proportion of its planned net cash flow from operations. Council meets the operations control benchmark if its actual net cash flow from operations equals or is greater than its planned net cash flow from operations. Actual/budget net cash flow from operations (%) % Benchmark met 95% 110% 2012/ / /15 Year Benchmark not met 102% 119% Benchmark Annual Report WAIKATO DISTRICT COUNCIL 147
150 awaiting new content AUDITOR S REPORT 148 WAIKATO DISTRICT COUNCIL Annual Report
151 awaiting new content AUDITOR S REPORT Annual Report WAIKATO DISTRICT COUNCIL 149
152 awaiting new content AUDITOR S REPORT 150 WAIKATO DISTRICT COUNCIL Annual Report

153 STATEMENT OF COMPLIANCE AND RESPONSIBILITY Statement of Compliance The Council and management of the Waikato District Council confirm that all the statutory requirements of Part 6 of the Local Government Act 2002 have been complied with. Statement of Responsibility The Council and management of the Waikato District Council accept responsibility for the preparation of the Annual Financial Statements and the judgements used in them, and for establishing and maintaining internal control systems to provide reasonable assurance as to the integrity and reliability of financial reporting. In the opinion of the Council and management of the Waikato District Council, the Annual Financial Statements and Statements of Service Performance for the year ended 30 June 2016 fairly reflect the financial position and operations of the Council. Allan Sanson Mayor Gavin Ion Chief Executive STATEMENT OF COMPLIANCE SECTION AND RESPONSIBILITY HEADING HERE Annual Report WAIKATO DISTRICT COUNCIL 151
Summary. This year there was one significant issue identified and consulted on in relation to wastewater. This is summarised on the following page.
 Contents page Summary... 1 Wastewater consultation process summary... 2 What we do... 3 Where do your rates go?... 4 Key projects for 2017/18... 6 Funding Impact Statement (FIS)... 9 Rating Base Information...
Contents. Council Controlled Organisations 69. Executive Summary 2. Key Consultation Issues 4. Corporate and Council Leadership 8
 Contents Executive Summary 2 Council Controlled Organisations 69 Tanlaw Corporation Limited 69 Key Consultation Issues 4 Corporate and Council Leadership 8 Corporate Services 12 Property 13 Area Offices
Supporting Information index.
 2018-28 Supporting Information index. Subject Page Financial Strategy 2 Infrastructure Strategy 10 Significant forecasting assumptions 51 Levels or service, Performance Measures, and Targets. 64 Financial
EXTRA CCL 1 2. CONFIRMATION OF STATUS OF AGENDA ITEMS. 4. RECEIPT OF STRATEGY & FINANCE COMMITTEE MINUTES - Meeting held 24 February 2015
 EXTRA CCL 1 Agenda for an extraordinary meeting of the Waikato District Council to be held in the Council Chambers, District Office, 15 Galileo Street, Ngaruawahia on MONDAY 2 MARCH 2015 commencing at
MINUTES MONDAY 13 JUNE pm. Present: Attending:
 MINUTES of a meeting of the Waikato District Council held in the Council Chambers, District Office, 15 Galileo Street, Ngaruawahia on MONDAY 13 JUNE 2016 commencing at 1.15pm. Present: His Worship the
Performance Management. Framework
 Management Framework Section Two Supporting Information LTP 2015-25 Structure of Groups of Activities Council carries out a number of activities or functions in order to meet it statutory responsibilities
achieving results in the public sector Kāpiti Coast District Council Financial Investigation of a Kāpiti Coast Unitary April 2013
 AUCKLAND SYDNEY BRISBANE PERTH Kāpiti Coast District Council Financial Investigation of a Kāpiti Coast Unitary achieving results in the public sector TABLE OF CONTENTS 1. INTRODUCTION... 1 2. METHODOLOGY...
Section 5 Dollars and Cents
 Section 5 Dollars and Cents section Revenue and financing policy 5a Financial statements 5b Funding impact statement rating implications 5c Rating changes 5d Balanced budget statement 5e Financial reporting
Introduction. Plan reflects the wider context. 21,000 Population growth over 5 years
 This Strategic Statement sets out the Vision, Strategic Objectives and broad policy directions of the City Council. These underpin the detailed programmes and list of projects which the Council plans to
Strategic Performance Framework
 Strategic Performance Framework Overview The strategic performance framework is a list of Key Performance Indicators (KPIs), which enable the Council to report how successful it has been in delivering
PEOPLE PLAN PROGRESS. Our Achievements
 Our Achievements Our Achievements (service performance reporting) In the statements of service performance there are references to an Annual Survey. This survey was undertaken by Key Research and the sample
UNDERSTANDING YOUR RATES ACCOUNT. INSTALMENT 1: Last day for payment 30 September 2016
 UNDERSTANDING YOUR S ACCOUNT INSTALMENT 1: Last day for payment 30 September HOW ARE S CALCULATED? Your rates account will show the different kinds of rate that we collect. Most of them are based on the
LIFESTYLE OPPORTUNITIES HOME
 MATAMATA-PIAKO THE PLACE OF CHOICE LIFESTYLE OPPORTUNITIES HOME CONSULTATION DOCUMENT FOR THE LONG TERM PLAN 2018-28 WELCOME A MESSAGE FROM THE MAYOR - Mayor Jan Barnes We have a new vision to make the
A loyal three made stronger in one. Loyalist Township Strategic Plan ( )
") A loyal three made stronger in one Loyalist Township Strategic Plan (2012-2015) Adopted by Council on August 13, 2012 Loyalist Township Strategic Plan I. Community Profile As prescribed by the Ministry
A loyal three made stronger in one Loyalist Township Strategic Plan (2012-2015) Adopted by Council on August 13, 2012 Loyalist Township Strategic Plan I. Community Profile As prescribed by the Ministry
ANNUAL REPORT 2015 / 2016
 WESTLAND DISTRICT COUNCIL Summary of the first Annual Report under Council s Long Term Plan 2015-2025 ANNUAL REPORT 2015 / 2016 2 Contents Some key facts... 5 Mayor and Chief Executive s report... 6 Highlights
achieving results in the public sector Wairarapa District Councils
 AUCKLAND SYDNEY BRISBANE PERTH Wairarapa District Councils Phase Three Report: Investigation into the formation of an Amalgamated Wairarapa District Council and a Wairarapa Unitary Authority achieving
our city our future DRAFT RESOURCING STRATEGY July 2014 FOR PUBLIC EXHIBITION 4 August - 15 September 2014
 our city our future SUSTAINABLE BLUE MOUNTAINS FOR PUBLIC EXHIBITION 4 August - 15 September 2014 DRAFT RESOURCING STRATEGY 2014-2024 July 2014 Including three possible options for Resourcing Our Future
Otorohanga District Council Summary Annual Report for the year ended 30 June 2016
 Otorohanga District Council Summary Annual Report for the year ended COMMENTS FROM THE MAYOR AND THE CHIEF EXECUTIVE The 2015/16 year was another year of steady performance by Council. Whilst there were
Delta Utility Services Limited
 Delta Utility Services Limited Statement of Intent for the year ending 30 June 2018 TABLE OF CONTENTS 1 Introduction... 3 2 Purpose of Statement of Intent... 3 3 Objectives... 3 4 Nature and Scope of Activities...
Revenue and financing policy
 Revenue and financing policy Revenue and Financing policy Background The Local Government Act 2002 (LGA) requires the Council to adopt a range of policies in order to provide predictability and certainty
Pre-Election Report. July 2016 Clare Hadley, Chief Executive
 Pre-Election Report July 2016 Clare Hadley, Chief Executive This document constitutes the pre-election report for the purposes of Section 99A of the Local Government Act 2002 Contents Contents... 2 Introduction...
REVENUE AND FINANCING POLICY
 001 Attachment 1 REVENUE AND FINANCING POLICY The purpose of this document is to set out, in accordance with Section 103 of the Local Government Act 2002, to outline Council s decision on the appropriate
Annual Report Summary
 KAWERAU DISTRICT COUNCIL Annual Report Summary For the Year Ended 30 June 2015 1 MAYOR S MESSAGE Welcome to Council s annual report summary for 2014/15. It was another successful year and Council continues
Te Kauwhata Consolidated Detailed Business Case. Housing Infrastructure Fund
 Te Kauwhata Consolidated Detailed Business Case Housing Infrastructure Fund April 2018 EXECUTIVE SUMMARY This business case proposes accelerated infrastructure development in Te Kauwhata to enable the
2018 Spring Pulse Survey Overview
 2018 Spring Pulse Survey Overview Strategic Meeting of Council July 4, 2018 Prepared for The City of Calgary by The Corporate Research Team Contact: Attachment 2 ISC: Unrestricted Krista Ring Manager,
Otorohanga District Council Summary Annual Report for the year ended 30 June 2015
 Otorohanga District Council Summary Annual Report for the year ended COMMENTS FROM THE MAYOR AND THE CHIEF EXECUTIVE Council continues to generally operate in a very lean and efficient mode, made possible
A BETTER BLUE MOUNTAINS
 A BETTER BLUE MOUNTAINS INFORMATION SHEET 1 JULY 2014 Resourcing Our Future Have Your Say Our Vision is to build a successful future for the Blue Mountains through improving the wellbeing of our community
MINISTRY OF TOURISM, CULTURE AND SPORT
 THE ESTIMATES, 1 The Ministry of Tourism, Culture and Sport provides leadership for these fast-growing sectors of the provincial economy which are fundamental to the prosperity and quality of life of Ontario
HAVE YOUR SAY CONSULTATION DOCUMENT ON THE ANNUAL PLAN CARTERTON DISTRICT COUNCIL ISSN
 CONSULTATION DOCUMENT HAVE YOUR SAY ON THE ANNUAL PLAN 2017-2018 CARTERTON DISTRICT COUNCIL ISSN 1171 7459 FROM HIS WORSHIP THE MAYOR The biggest issue facing us now is finding a way to eventually discharge
Ashburton District Council. Annual Report Summary 2015/16
 Ashburton District Annual Report Summary From the Mayor & Chief Executive The year was one that saw focus on its business as usual activities. With the opening of key community facilities in, worked hard
FUNDING NEEDS ANALYSIS
 FUNDING NEEDS ANALYSIS The purpose of this document is to set out, in accordance with section 101 (3) of the Local Government Act 2002 how each activity of Council will be funded. CONTENTS 1. Introduction
2018 Long Term Plan Financial forecasting assumptions
 2018 Long Term Plan Financial forecasting assumptions Forecasting assumption Risk Likelihood of occurrence Projected price change factors Forecast financial information That actual price changes vary Medium
Your Councillors. Taupo-Kaingaroa Ward Councillor Bernhard Chrustowski. Ph:
 Your Councillors His Worship the Mayor Rick Cooper, JP Ph: 07 377 0670 Bus Ph: 07 378 7547 Mob Ph: 027 494 2362 Email: rcooper@taupo.govt.nz Taupo-Kaingaroa Ward Deputy Mayor Councillor Christine McElwee,
Tax Supported Preliminary Operating Budget. Book 1. Budget Summary Report FCS17001
 2017 Tax Supported Preliminary Operating Budget Book 1 Budget Summary Report FCS17001 BOOK ONE: 2017 PRELIMINARY TAX SUPPORTED OPERATING BUDGET SUMMARY LIST OF APPENDICES APPENDIX DESCRIPTION PAGE Tax
2017 Quality of Life and Citizen Satisfaction Survey
 2017 Quality of Life and Citizen Satisfaction Survey Presentation Presented by: Jamie Duncan Vice President, Canada Ipsos Public Affairs Krista Ring Manager, Customer Experience & Research Customer Service
Section 4b. Our services: Governance and leadership
 Section 4b Our services: Governance and leadership Governance and Leadership GOVERNANCE & LEADERSHIP What this group includes: Democracy Iwi Liaison Policy Development Our governance and leadership group
HAMILTON'S 10-YEAR PLAN CONSULTATION DOCUMENT
 HAMILTON'S 10-YEAR PLAN CONSULTATION DOCUMENT 2015-2025 HAMILTON S 10-YEAR PLAN CONSULTATION DOCUMENT 2015-2025 Contents 4 Introduction 5 BACKGROUND 6 planning for a growing city 8 The Hamilton plan 10
Napier City Council Revenue and FINANCING POLICY
 Napier City Council Revenue and FINANCING POLICY Revenue and Financing Policy 1. Background Napier City Council (the Council) has reviewed the proposed funding for each activity to determine the funding
REVENUE AND FINANCING POLICY
 REVENUE AND FINANCING POLICY 2018 1 Far North District Council Long Term Plan 2018-28 Revenue and Financing Policy Overview The Local Government Act 2002 (LGA) requires all councils to adopt a Revenue
Funding Impact Statement
 Funding Impact Statement 1. Revenue and Financing Sources Generally The following revenue mechanisms will be used in 2015/16 and throughout the term of this LTP: General rates Targeted rates Fees and charges
Manawatū District Council. Revenue and Financing Policy. Draft Long Term Plan
 Manawatū District Council Revenue and Financing Policy Draft Long Term Plan 2018-28 Revenue and Financing Policy The Local Government Act 2002 requires Council to adopt a Revenue and Financing Policy.
MINISTRY OF TOURISM, CULTURE AND SPORT
 THE ESTIMATES, 201314 1 The Ministry of Tourism, Culture and Sport provides leadership for these fastgrowing sectors of the provincial economy which are fundamental to the prosperity and quality of life
Highlights From The Approved 2013 Budget Budget in Brief
 Highlights From The Approved 2013 Budget 2013 Budget in Brief Preparing for the FUTURE: The City of Brandon is committed to building a sustainable future. Our 2013 budget process was improved in many ways,
WHAT WE HEARD: A REPORT TO THE COMMUNITY. Budget Public Consultation September, 2018
 Budget Public Consultation September, 2018 WHAT WE HEARD: A REPORT TO THE COMMUNITY Prepared by the Public Engagement Budget Working Group: Monica Leatherdale, Sheena Linderman, Kelly Lloyd, Jennifer Lutz
ANNUAL PLAN 2018/19. WEL Energy Trust
 ANNUAL PLAN 2018/19 WEL Energy Trust This report presents an overview of the Trust s objectives, intentions and expected outcomes over the next 12 months within the framework of the 2017-21 Strategic Plan.
ASSESSMENT REPORT FOR ANNUAL PLAN 17/18 DIFFERENCES FROM YEAR 3 OF THE LTP
 ASSESSMENT REPORT FOR ANNUAL PLAN 17/18 DIFFERENCES FROM YEAR 3 OF THE LTP 2015-25 SIGNIFICANT OR MATERIAL? In order to determine if consultation is required on the Annual Plan 2017/18 Council must assess
THAT an apology be received from and leave of absence granted to Ms Grace, Mrs H Dillon, Mr L Wilson and Ms J Clegg.
 MINUTES of a meeting of the Te Kauwhata Community Committee held at the St John Ambulance Rooms, 4 Baird Avenue, Te Kauwhata on WEDNESDAY 3 AUGUST 2016 commencing at 7.00pm. Present: Mr D Boyde (Chairperson)
Winchester District Councillor Annual Report - March 2019
 Winchester District Councillor Annual Report - March 2019 Cllr Vicki Weston s Annual Report Winchester City Council Freezes Council Tax There will be more money in the pockets of residents as Winchester
Vote Prime Minister and Cabinet
 Vote Prime Minister and Cabinet APPROPRIATION MINISTER(S): Minister of Civil Defence (M11), Prime Minister (M52), Minister supporting Greater Christchurch Regeneration (M85), Minister for Communications
MINISTRY OF TOURISM, CULTURE AND SPORT
 THE ESTIMATES, 201213 1 The Ministry of Tourism, Culture and Sport provides leadership for these fastgrowing sectors of the provincial economy which are fundamental to the prosperity and quality of life
Revenue and Financing Policy 2018
 Revenue and Financing Policy 2018 Greater Wellington Regional Council Contents Core provisions... 2 1. Introduction... 2 2. Considerations for this policy... 2 3. Valuation system... 2 Equalised capital
Operating Budget Overview 2019
 OPERATING BUDGET Operating Overview 2019 Introduction In planning for a vibrant, healthy and sustainable community, the Town of Halton Hills is committed to providing community leadership on issues of
Vote Prime Minister and Cabinet
 Vote Prime Minister and Cabinet APPROPRIATION MINISTER(S): Minister of Civil Defence (M11), Prime Minister (M52), Minister supporting Greater Christchurch Regeneration (M85) APPROPRIATION ADMINISTRATOR:
Annual Report Summary
 KAWERAU DISTRICT COUNCIL Annual Report Summary For the Year Ended 30 June 2013 1 MAYOR S MESSAGE was another successful year for Council where we managed to achieve most of the tasks we set for ourselves
Mayoral Intent for the 10-year Budget (Long-term Plan)
") Mayoral Intent for the 10-year Budget (Long-term Plan) 2018 2028 Author: Mayor Phil Goff 22 August 2017 1 Purpose This report sets out my priorities as Mayor and the advice and work plans that I am asking
Mayoral Intent for the 10-year Budget (Long-term Plan) 2018 2028 Author: Mayor Phil Goff 22 August 2017 1 Purpose This report sets out my priorities as Mayor and the advice and work plans that I am asking
a. Options for managing any equity shares the Government takes in projects through the Fund
 implementation of the Fund (e.g. to reflect potential changes in the role of Senior Regional Officials). I also recommend that the RED Delegated Ministers be similarly authorised to make small scale changes
In Confidence. Office of the Minister for Regional Economic Development. Chair, Cabinet THE PROVINCIAL GROWTH FUND. Purpose
 In Confidence Office of the Minister for Regional Economic Development Chair, Cabinet THE PROVINCIAL GROWTH FUND Purpose This paper sets the broad parameters for the Provincial Growth Fund. This will enable
CITY OF VAUGHAN EXTRACT FROM COUNCIL MEETING MINUTES OF JUNE 19, 2018
 CITY OF VAUGHAN EXTRACT FROM COUNCIL MEETING MINUTES OF JUNE 19, 2018 Item 8, Report No. 6, of the Finance, Administration and Audit Committee, which was adopted without amendment by the Council of the
Future Proof Strategy Peer Review. Report for Hamilton City and Waikato and Waipa District Councils
 Future Proof Strategy Peer Review Report for Hamilton City and Waikato and Waipa District Councils Peter Winder May 2017 Table of Contents The Brief for the Review... 1 The Review... 2 What Has Been Reviewed?...
Vote Prime Minister and Cabinet
 Vote Prime Minister and Cabinet APPROPRIATION MINISTER(S): Minister of Civil Defence (M11), Prime Minister (M52), Minister for Greater Christchurch Regeneration (M85), Minister Responsible for the Earthquake
Operational achievements
 Taranaki Regional Council Pre-Election Report For the October 2016 Local Authority Elections Taranaki Regional Council JULY 2016 Working with people caring for Taranaki Issued by BG Chamberlain Chief Executive
ADOPTION OF THE DELIVERY PROGRAM AND OPERATIONAL PLAN INCLUDING FEES AND CHARGES 2014/15
 ITEM 6.2 REPORTING MANAGER TRIM FILE REF 2014/120944 ATTACHMENTS ADOPTION OF THE DELIVERY PROGRAM 2014-2018 AND OPERATIONAL PLAN INCLUDING FEES AND CHARGES 2014/15 DEPUTY GENERAL MANAGER ENVIRONMENT 1
Christchurch City Council Draft Annual Plan 2016/17 and Proposed Amendments to the Long-term Plan (Draft) Council Consideration Draft
 Council Consideration Draft") Christchurch City Council Draft Annual 2016/17 and Proposed Amendments to the Long-term 2015-2025 (Draft) Council Consideration Draft Please note: This document contains the Council consideration draft
Christchurch City Council Draft Annual 2016/17 and Proposed Amendments to the Long-term 2015-2025 (Draft) Council Consideration Draft Please note: This document contains the Council consideration draft
District of Lillooet 2018 Draft Budget
 District of Lillooet 2018 Draft Budget 1 Overview of Departments General Fund o o o o o o General Government Fiscal & Legislative Services Corporate Services Finance & Administration Development Services
Strategic Asset Management Policy
 Strategic Asset Management Policy Submission Date: 2018-04-24 Approved by: Council Approval Date: 2018-04-24 Effective Date: 2018-04-24 Resolution Number: Enter policy number. Next Revision Due: Enter
Report to COUNCIL for noting
 15/362 Subject: Chief Executive s Activity Report: September 2015 Prepared by: Judy Campbell (Chief Executive) Meeting Date: 8 October 2015 Report to COUNCIL for noting SUMMARY Attached is my report for
A GUIDE TO THE NEW LEGISLATIVE REQUIREMENTS CAPITAL PLANS FOR MUNICIPAL FINANCIAL &
 A GUIDE TO THE NEW LEGISLATIVE REQUIREMENTS FOR MUNICIPAL FINANCIAL & CAPITAL PLANS 2018 Government of Alberta. This publication is issued under the Open Government Licence Alberta (http://open.alberta.ca/licence)
HAMILTON CITY COUNCIL S 2016/17 ANNUAL REPORT
 HAMILTON CITY COUNCIL S 2016/17 ANNUAL REPORT SERVICE PERFORMANCE CONTENTS 2 4 7 8 9 10 15 19 23 28 33 37 41 44 48 52 56 62 67 68 72 131 132 137 144 145 From the Mayor and Chief Executive The Financial
CITY OF SACRAMENTO CALIFORNIA. April 27, 2012
 OFFICE OF THE CITY MANAGER CALIFORNIA April 27, 2012 CITY HALL 5 th FLOOR 915 I STREET SACRAMENTO, CA 95814-2684 PH 916-808-5704 FAX 916-808-7618 Honorable Mayor and City Council Sacramento, California
Revenue and Financing Policy 2017
 Revenue and Financing Policy 2017 Foreword Andrew Duncan Manager Financial Policy, Auckland Council Adopted by the Governing Body on 29 June 2017 Resolution number: GB/2017/65 4 Auckland Council Revenue
Government Policy Statement on land transport 2018 release for public engagement
 In Confidence Office of the Minister of Transport Chair, Cabinet Economic Development Committee Government Policy Statement on land transport 2018 release for public engagement Proposal 1. This paper seeks
PROPERTY ASSET MANAGEMENT PLAN EXECUTIVE SUMMARY
 PROPERTY ASSET MANAGEMENT PLAN EXECUTIVE SUMMARY - 2017 Introduction One of the main purposes of Local Authorities under the LGA 2002 is to meet the current and future needs of communities for good quality
Southland District Council. Pre-Election Report
 Southland District Council Pre-Election Report Chief Executive s Introduction Welcome to Southland District Council s first Pre-Election Report. The purpose of this report is to provide information to
Report Card May 2015 T H I S P L A N I S A V A I L A B L E I N A L T E R N A T E F O R M A T B Y R E Q U E S T
 Report Card May 2015 T H I S P L A N I S A V A I L A B L E I N A L T E R N A T E F O R M A T B Y R E Q U E S T Aurora Overview Vision: Goal: : : Objective 3: Objective 4: : Goal: : : Goal: : : An innovative
We are pleased to present the first implementation programme of the Waikato Plan.
 Waikato Plan Implementation Programme Foreword We are pleased to present the first implementation programme of the Waikato Plan. The Waikato Plan was adopted by the partner councils in July/August 2017.
Vote Business, Science and Innovation
 Vote Business, Science and Innovation APPROPRIATION MINISTER(S): Minister of Broadcasting, Communications and Digital Media (M8), Minister of Commerce and Consumer Affairs (M13), Minister for Economic
Funding Fire and Emergency Services for all New Zealanders PUBLIC CONSULTATION
 Funding Fire and Emergency Services for all New Zealanders PUBLIC CONSULTATION A public consultation paper on the setting of the rates of levy on contracts of fire insurance for the 2017/18 financial year
Swan Hill Incorporated Annual Marketing Plan & Budget
 Swan Hill Incorporated Annual Marketing Plan & Budget 2013-2014 Introduction Swan Hill Incorporated has developed this annual marketing plan and budget to deliver a comprehensive set of priorities and
Paying for Auckland s growth. Contributions Policy 2019 Consultation Document
 Paying for Auckland s growth Contributions Policy 2019 Consultation Document About this document This document provides: an overview of how the council is involved in accommodating, sequencing and supporting
2015 Town of Oakville Citizen Survey Presentation of Findings. February 23, 2015
 2015 Town of Oakville Citizen Survey Presentation of Findings February 23, 2015 S T R A T E G I C I N S I G H T S Objectives and Methodology In December of 2015, The Town of Oakville contacted Pollara
REVENUE AND FINANCING POLICY
 REVENUE AND FINANCING POLICY Napier City Council (the Council) has reviewed the proposed funding for each activity to determine the funding policy for each. In accordance with the Local Government Act
Draft Strategic Asset Management Plan
 Draft Strategic Asset Management Plan 2016-2026 December 2015 Revised to include Special Rate Variation Scenarios The capital works programs included in this Strategic Asset Management Plan are subjected
Message from the Treasurer. Proposed Property Tax Increases. Municipal Service Delivery. Economic Profile. Development Outlook
 Executive Summary Table of Contents Message from the Treasurer Proposed Property Tax Increases Exec-3 Exec-4 About Brampton Brampton Facts Municipal Service Delivery Economic Profile Development Outlook
City of Penticton: Financial Plan Reporting Structure
 City of Penticton: Financial Plan Reporting Structure General Utilities General Government Transportation Services Recreation and Culture Environmental Health Services Public Health and Safety Protective
DRAFT 10-YEAR PLAN SIGNIFICANT FORECASTING ASSUMPTIONS
 2018-28 DRAFT 10-YEAR PLAN SIGNIFICANT FORECASTING ASSUMPTIONS Purpose 1. To outline the significant forecasting assumptions that inform the draft 2018-28 10-Year Plan. Introduction 2. Legislation requires
33. Government financial support to local authorities
 33. Government financial support to local authorities Summary Specific government financial support to local authorities during or after an emergency is based on a range of mandates, criteria, and triggers,
The Township of Sioux Narrows Nestor Falls. Strategic Plan and Vision Statement: Prepared by:
 The Township of Sioux Narrows Nestor Falls Strategic Plan and Vision Statement: 2021 Prepared by: Jeffrey Port, MCIP, RPP Township of Sioux Narrows Nestor Falls 1 CONTENTS 1.0 INTRODUCTION 3 2.0 VISION
TOWN OF GAWLER POLICY
 TOWN OF GAWLER POLICY Policy Section: Policy Name: Classification: 6. Finance & Corporate Services Service Range Public Council Policy Adopted: 26 May 2015 Frequency of Review: Biennial Last Review: August
STRATEGIC PERFORMANCE MANAGEMENT REPORT Quarterly Strategic Plan Outcomes and Project Updates Q3 FY 2018
 STRATEGIC MANAGEMENT REPORT Quarterly Strategic Plan Outcomes and Project Updates Q3 FY 2018 THE STRATEGIC PLAN A strategic plan is an essential component of any organization. The City s new Strategic
Lound with Ashby, Herringfleet and Somerleyton NEIGHBOURHOOD PLAN QUESTIONNAIRE. It s time to have your say
 Lound with Ashby, Herringfleet and Somerleyton NEIGHBOURHOOD PLAN QUESTIONNAIRE It s time to have your say It s Here! NEIGHBOURHOOD PLAN QUESTIONNAIRE FOR Lound, Ashby, Herringfleet and Somerleyton The
Vote Prime Minister and Cabinet
 Vote Prime Minister and Cabinet APPROPRIATION MINISTER(S): Minister of Civil Defence (M11), Prime Minister (M52), Minister for Greater Christchurch Regeneration (M85), Minister Responsible for the Earthquake
Financial Tables BUDGET SUMMARY ACTUAL ADOPTED AMENDED RECOMM. % TOTAL ALL CITY FUNDS - EXPENDITURE BUDGET General 150
 BUDGET SUMMARY 2016-17 ACTUAL ADOPTED AMENDED RECOMM. % TOTAL ALL CITY FUNDS - EXPENDITURE BUDGET General 150,772,063 157,004,711 155,448,503 158,973,765 26% Special Revenue 105,738,661 110,778,338 113,004,933
2018 Draft Operating and Capital Budgets Introduction
 2018 Draft Operating and Capital Budgets Introduction 1 COUNCIL PRIORITIES IN 2018 OPERATING AND CAPITAL BUDGETS COUNCIL S PRIORITIES Council Priorities in 2018 Budget Create a smart economy 2017 2018
City of Port Moody Citizen Survey. Presented by: Catherine Knaus, Ipsos Reid
 City of Port Moody Citizen Survey Presented by: Catherine Knaus, Ipsos Reid Objectives and Methodology 2 Objective Provide a comprehensive overview of citizens satisfaction levels, attitudes, needs, and
STATEMENT OF CORPORATE INTENT
 PORTS OF AUCKLAND LIMITED STATEMENT OF CORPORATE INTENT For the period from 1 July 2018 to 30 June 2021 Ports of Auckland I SCI 2018/21 Page 1 of 9 CONTENTS 1. Introduction... 3 2. Purpose... 3 3. Nature
EXPLAINED. Your Rates
 Your Rates EXPLAINED 2018-2019 The Horizons Region extends over 22,200km2 - from Ruapehu in the north and Horowhenua in the south, to Whanganui in the west and Tararua in the east, and has a population
YOUR AUCKLAND. Auckland Council s Long-term Plan
 YOUR AUCKLAND Auckland Council s Long-term Plan Volume 1: Summary and context 1 November 2010-30 June 2019 FACTS ABOUT THE AUCKLAND council s area Auckland Council s Long-term Plan Age 0-4 7.2 5-9 7.3
Cultural Investment by the City of Saskatoon
 Cultural Investment by the City of Saskatoon 2009 to 2012 Report prepared by Kelly Hill May 2014 Table of Contents Executive Summary... 1 Section 1: Introduction... 7 Section 2: Local structure, plans,
2017 Citizen Satisfaction Survey Final Report
 2017 Citizen Satisfaction Survey Final Report Survey conducted for the City of Colwood by: DISCOVERY RESEARCH Purpose Apply scientific methods to public consultation. Hear from a broad range of citizens
Toronto & Region Conservation Authority (TRCA)
") OPERATING ANALYST NOTES OPERATING PROGRAM SUMMARY Contents Toronto & Region Conservation Authority (TRCA) 2014 OPERATING BUDGET OVERVIEW What We Do TRCA protects, restores and celebrates the natural environment
OPERATING ANALYST NOTES OPERATING PROGRAM SUMMARY Contents Toronto & Region Conservation Authority (TRCA) 2014 OPERATING BUDGET OVERVIEW What We Do TRCA protects, restores and celebrates the natural environment