Accounting For Loss Water & Revenues
|
|
|
- Claribel McDowell
- 6 years ago
- Views:
Transcription
1 Accounting For Loss Water & Revenues Ohio Section AWWA Southeast/Southwest Districts Joint Spring Meeting Tom Schwing Deer Creek State Park April 21, 2016
 + Click to add a comment Reporting Year: 2013 1/2013-12/2013 Please")
 using the drop-down list to the left of the input cell.")


2 AWWA Tools for Water Loss Control AWWA Free Water Audit Software: Reporting Worksheet WAS v5.0 American Water Works Association. Copyright 2014, All Rights Reserved.? Click to access definition Water Audit Report for: Northern San Leandro Combined Water Sewer Storm Utility District ( ) + Click to add a comment Reporting Year: / /2013 Please enter data in the white cells below. Where available, metered values should be used; if metered values are unavailable please estimate a value. Indicate your confidence in the accuracy of the input data by grading each component (n/a or 1-10) using the drop-down list to the left of the input cell. Hover the mouse over the cell to obtain a description of the grades AWWA Free Water Audit Software: System Attributes and Performance Indicators WAS v5.0 American Water Works Association. Copyright 2014, All Rights Reserved. All volumes to be entered as: MILLION GALLONS (US) PER YEAR Water Audit Report for: Philadelphia Water Department To select the correct data grading for each input, determine the highest grade where the utility meets or exceeds all criteria for that grade and all grades below it. Master Meter Error Adjustments Reporting Year: / /2013 WATER SUPPLIED < Enter grading in column 'E' and 'J' > Pcnt: Value: Volume from own sources: +? 5 1, MG/Yr +? MG/Yr *** YOUR WATER AUDIT DATA VALIDITY SCORE IS: 77 out of 100 *** Water imported: +? MG/Yr +? MG/Yr Water exported: +? System MG/Yr Attributes: +? MG/Yr Enter negative % or value for under-registration Apparent Losses: 7, MG/Yr WATER SUPPLIED: MG/Yr Enter positive % or value for over-registration. + Real Losses: 21, MG/Yr AUTHORIZED CONSUMPTION Click here:? Billed metered: +? MG/Yr for help using option = Water Losses: 28, MG/Yr Billed unmetered: +? MG/Yr buttons below Unbilled metered: +? MG/Yr Pcnt: Value: Unbilled unmetered: +? ? Unavoidable Annual Real Losses (UARL): 2, MG/Yr MG/Yr 1.25% MG/Yr Default option selected for Unbilled unmetered - a grading of 5 is applied but not displayed Use buttons to select Annual cost of Apparent Losses: $54,788,450 AUTHORIZED CONSUMPTION:? MG/Yr percentage of water supplied Annual cost of Real Losses: $7,368,338 Valued at Variable Production Cost OR value Return to Reporting Worksheet to change this assumpiton WATER LOSSES (Water Supplied - Authorized Consumption) MG/Yr Apparent Losses Performance Indicators: Pcnt: Value: Unauthorized consumption: +? MG/Yr 0.25% MG/Yr Unauthorized consumption volume entered is greater than the recommended default value Non-revenue water as percent by volume of Water Supplied: 38.1% Customer metering inaccuracies: +? Financial: MG/Yr 1.00% MG/Yr Non-revenue water as percent by cost of operating system: 25.2% Real Losses valued at Variable Production Cost Systematic data handling errors: +? MG/Yr 0.25% MG/Yr Apparent Losses:? MG/Yr Apparent Losses per service connection per day: gallons/connection/day Real Losses (Current Annual Real Losses or CARL) Real Losses = Water Losses - Apparent Losses:? MG/Yr Real Losses per service connection per day: gallons/connection/day Operational Efficiency: WATER LOSSES: MG/Yr Real Losses per length of main per day*: N/A NON-REVENUE WATER NON-REVENUE WATER:? MG/Yr Real Losses per service connection per day per psi pressure: 1.70 gallons/connection/day/psi = Water Losses + Unbilled Metered + Unbilled Unmetered SYSTEM DATA Length of mains: +? miles From Above, Real Losses = Current Annual Real Losses (CARL): 21, million gallons/year Number of active AND inactive service connections: +? 6 1,000 Service connection density:? 10 conn./mile main? Infrastructure Leakage Index (ILI) [CARL/UARL]: 8.52 Are customer meters typically located at the curbstop or property line? Yes (length of service line, beyond the property Average length of customer service line: +? ft boundary, that is the responsibility of the utility) * This performance indicator applies for systems with a low service connection density of less than 32 service connections/mile of pipeline Average length of customer service line has been set to zero and a data grading score of 10 has been applied Average operating pressure: +? psi WAS v5.0 AWWA Free Water Audit Software: Water Balance COST DATA American Water Works Association. Copyright 2014, All Rights Reserved. Total annual cost of operating water system: +? 5 $1,000,000 $/Year Customer retail unit cost (applied to Apparent Losses): +? 7 $3.50 $/1000 gallons (US) Variable production cost (applied to Real Losses): +? 7 $3, $/Million gallons Use Customer Retail Unit Cost to value real losses Water Audit Report for: Philadelphia Water Department Reporting Year: / /2013 WATER AUDIT DATA VALIDITY SCORE: Data Validity Score: 77 *** YOUR SCORE IS: 60 out of 100 *** Water Exported A weighted scale for the components of consumption and water loss is included in the calculation of the Water Audit Data Validity Score Billed Water Exported 5, PRIORITY AREAS FOR ATTENTION: Billed Metered Consumption (water Based on the information provided, audit accuracy can be improved by addressing the following components: Revenue Water Billed Authorized Consumption exported is removed) 1: Volume from own sources 49, : Customer metering inaccuracies Authorized 3: Total annual cost of operating water system Own Sources 49, Billed Unmetered Consumption 49, Consumption (Adjusted for known errors) 51, Unbilled Metered Consumption Non-Revenue Water Unbilled Authorized Consumption (NRW) 86, , Unbilled Unmetered Consumption 1, Water Supplied Unauthorized Consumption 30, Apparent Losses 2, , , Customer Metering Inaccuracies 1, Systematic Data Handling Errors Water Losses 3, Leakage on Transmission and/or Water Imported 28, Distribution Mains Real Losses Not broken down Leakage and Overflows at Utility's Storage 21, Tanks Not broken down Leakage on Service Connections Not broken down
 Reporting Year: 2013 1/2013-12/2013 Please")
3 AWWA Free Water Audit Software AWWA Free Water Audit Software: Reporting Worksheet WAS v5.0 American Water Works Association. Copyright 2014, All Rights Reserved.? Click to access definition + Click to add a comment Water Audit Report for: Northern San Leandro Combined Water Sewer Storm Utility District ( ) Reporting Year: / /2013 Please enter data in the white cells below. Where available, metered values should be used; if metered values are unavailable please estimate a value. Indicate your confidence in the accuracy of the input data by grading each component (n/a or 1-10) using the drop-down list to the left of the input cell. Hover the mouse over the cell to obtain a description of the grades All volumes to be entered as: MILLION GALLONS (US) PER YEAR To select the correct data grading for each input, determine the highest grade where the utility meets or exceeds all criteria for that grade and all grades below it. Master Meter Error Adjustments WATER SUPPLIED < Enter grading in column 'E' and 'J' > Pcnt: Value: Volume from own sources: +? 5 1, MG/Yr +? MG/Yr Water imported: +? MG/Yr +? MG/Yr Water exported: +? MG/Yr +? MG/Yr Enter negative % or value for under-registration WATER SUPPLIED: MG/Yr Enter positive % or value for over-registration. AUTHORIZED CONSUMPTION Click here:? Billed metered: +? MG/Yr for help using option Billed unmetered: +? MG/Yr buttons below Unbilled metered: +? MG/Yr Pcnt: Value: Unbilled unmetered: +? MG/Yr 1.25% MG/Yr Default option selected for Unbilled unmetered - a grading of 5 is applied but not displayed AUTHORIZED CONSUMPTION:? MG/Yr Use buttons to select percentage of water supplied OR WATER LOSSES (Water Supplied - Authorized Consumption) MG/Yr value Apparent Losses Pcnt: Value: Unauthorized consumption: +? MG/Yr 0.25% MG/Yr Customer metering inaccuracies: +? MG/Yr 1.00% MG/Yr Systematic data handling errors: +? MG/Yr 0.25% MG/Yr Apparent Losses: Real Losses (Current Annual Real Losses or CARL) Real Losses = Water Losses - Apparent Losses: WATER LOSSES: NON-REVENUE WATER NON-REVENUE WATER: = Water Losses + Unbilled Metered + Unbilled Unmetered SYSTEM DATA Unauthorized consumption volume entered is greater than the recommended default value MG/Yr MG/Yr MG/Yr MG/Yr Length of mains: +? miles Number of active AND inactive service connections: +? 6 1,000 Service connection density:? 10 conn./mile main??? Are customer meters typically located at the curbstop or property line? Yes (length of service line, beyond the property Average length of customer service line: +? ft boundary, that is the responsibility of the utility) Average length of customer service line has been set to zero and a data grading score of 10 has been applied Average operating pressure: +? psi Industry Standard (M36) Free Defaults provided ~10 Volume Inputs ~7 System Data Inputs COST DATA Total annual cost of operating water system: +? 5 $1,000,000 $/Year Customer retail unit cost (applied to Apparent Losses): +? 7 $3.50 $/1000 gallons (US) Variable production cost (applied to Real Losses): +? 7 $3, $/Million gallons Use Customer Retail Unit Cost to value real losses awwa.org/waterlosscontrol
4 Water Loss Management Historic Water Loss Management practice focused on: Unaccounted-for-Water (UAW) - Often arbitrary set at a percentage i.e. 15% Did not consider the true source of water loss Apparent or Real Did not consider the cost/benefit of water leak control Water Industry s Best Management Practices focuses on: Accounting for all water there is no Unaccounted-for-Water Determining if water losses are Apparent Losses or Real Losses Addressing Real Losses based on realistic, cost effective activities rather than activity for the sake of activity!
5 Water Loss Management Water Resource Issue Is water supply (source) limited? Operational Issue Is it limiting the water facility s ability to provide an adequate reliable supply of water to the customers? Economic Issue Is the value of the loss water greater than the cost of recovering the loss water?
6 Water Loss Impact on Private Water Companies Traditionally Viewed as Economic Issue Disallow cost for chemical and power costs for producing water above the 15% UAW Penalty for an UAW greater than 15% The lower the level of Real Losses in a water system, the higher the cost of further reducing water losses to a lower level. Diminishing return on Water Loss Control activities
7 Water Loss Audit Bottom Up! Start with the activity Timeframe Minimum one (1) year period Resources Time, Personnel, Money Measurement Tools Meters measuring input into the water system Meters measuring consumption Data Collection Validity of the data
8 Known Knowns & Knowns Unknowns Develop a Water Balance Quantified via Measurement or Estimates the Consumption and Losses of the water system Based on Knowns Therefore There is no Unaccounted-for-Water!
9 Water Consumption Authorized & Billed Consumption (Revenue Water) Billed Water Exported Billed Metered Consumption Billed Unmetered Consumption Authorized & Unbilled Consumption (Non- Revenue Water) Unbilled Metered Consumption Unbilled Unmetered Consumption
10 Water Losses (Non-Revenue) Apparent Losses Unauthorized Consumption Customer Metering Inaccuracies Systematic Data Handing Errors Real Losses Leakage on Transmission & Distribution Mains Leakage & Overflows at Utility Storage Tanks Leakage on Service Connections up to point of the Customer Metering

11 Who Needs a Meter?

12 Water Over the Top
13 Some Definitions System Input Volume The annual volume of water input into the water supply system Authorized Consumption The annual volume of metered and/or unmetered water taken by registered customers and others authorized to do so. Water Losses The difference between System Input Volume and Authorized Consumption consisting of Apparent Losses plus Real Losses Apparent Losses The unauthorized consumption, all types of customer metering inaccuracies and systematic data handling errors (nonphysical losses)
14 Some More Definitions Real Losses The annual volume of water lost through all types of leaks, breaks, overflows on mains, tanks, service connections up to the customer s metering (physical losses) Revenue Water The components of System Input Volume that are billed and produce revenue. Nonrevenue Water The sum of unbilled authorized consumption, Apparent and Real Losses The Value can be determined by the difference between System Input Volumes and Billed Authorized Consumption
 Water Exported Water Supplied Authorized")


15 IWA/AWWA Standard Water Balance Own Sources Water Imported Total System Input ( allow for known errors ) Water Exported Water Supplied Authorized Consumption Water Losses Billed Authorized Consumption Unbilled Authorized Consumption Apparent Losses Real Losses Revenue Water Non- Revenue Water Billed Water Exported Billed Metered Consumption Billed Unmetered Consumption Unbilled Metered Consumption Unbilled Unmetered Consumption Unauthorized Consumption Customer Metering Inaccuracies Systematic Data Handling Errors Leakage on Mains Leakage on Service Lines Leakage & Overflows at Storage

16 Four Pillars of Apparent Loss Control
17 Unmetered Water System 90,000 80,000 70,000 60,000 50,000 40,000 30,000 20, ,000 - Jan Feb Mar Apr May June July Aug Sept Oct Nov Dec


18 Four Pillars of Real (Leakage) Loss Control Losses flex with pressure Pressure Management Economic Level of Real Losses Speed and Quality of repairs Unavoidable Annual Real Losses Active Leakage Control Potentially Recoverable Real Losses Current Annual Real Losses Pipeline and Asset Management Selection, Installation, Maintenance, Renewal, Replacement
19 Water Loss Control Program Components Active Leakage Control Reactive Proactive Optimized Leak Repair Activities Timely & Quality Repairs Controlling the ALR times Water System Pressure Management Control system pressure to reduce leakage & creation of new leaks System Rehabilitation & Renewal Reinvestment in aged infrastructure
20 Type of Leakage Reported Leakage Generally surfacing, is visible and readily reported by public Unreported Leakage Generally non-surfacing, not visible but is detectable using traditional leak detection methods Background Leakage Small weeping leaks, non-surfacing, no visible water and not detectable using traditional leak detection methods
21

22 Water Main Break

23 Service Leak

24 Time Period in the Life of a Leak A Awareness, L Location, R - Repair
25 Time Period in the Life of a Leak Awareness Time The time to become aware of that a leak exists. Location Time The time to taken to pinpoint the source of the leak once aware of the leak. Repair Time The time it takes to actually repair the leak and stop its water loss.

26 Comparing Water Leak Loss Impacts Example of various leakage types & impacts of time on the volume of loss
27 How are we doing? Unavoidable Annual Real Losses (UARL) The theoretical value representing the low limit of leakage that could be achieved if all of today s best technology could be successfully applied. Current Annual Real Losses (CARL) Real losses from the system Infrastructure Leakage Index (ILI) The ratio of Current Annual Real Losses (CARL) to Unavoidable Annual Real Losses (UARL
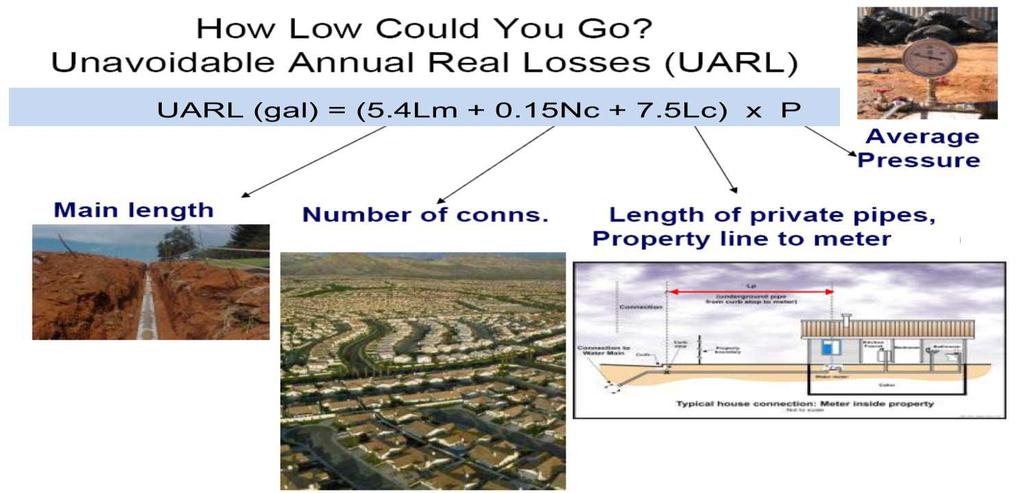
28 Components of UARL Miles of Water Main (including fire hydrant leads) Gallons / mile of main / day / psi Service Connections from Water Main to Curb Stop Gallons / Service Connection / day / psi Service Connection from Curb Stop to Meter Gallons / Mile of Service Connection / day / psi
29
30 Calculation of UARL UARL = (5.4 Lm Nc Lc) X P Variables: Lm Length of water main Nc Number of Connections Lp Average Length of service Line Lc = Nc X Lp P - Pressure
 UARL (technical low leakage")
31 Infrastructure Leakage Index ILI ILI = CARL (current leakage) UARL (technical low leakage limit)
32 Calculation of ILI ILI = CARL / UARL ILI of 1 means the Current Annual Real Losses equal the Unavoidable Annual Real Losses. While in theory an ILI of 1 is possible, it is not realistic.
33
34 Review of AWWA Software Marion PWS Program
Water Loss Control in Effective Utility Management
 Water Loss Control in Effective Utility Management M. Steve Cavanaugh, Jr., PE steve.cavanaugh@cavanaughsolutions.com Feb 22, 2017 Strategic Planning/Core Values include Relevant Goals and Objectives for
Water Loss Control Tools. Software Tools for Supply Side Efficiency
 Water Loss Control Tools Software Tools for Supply Side Efficiency PNWS, April 2015 Today s Goals 1) What is Water Loss? (10 min) 2) Water Loss Baseline AWWA Audits (20 min) 3) Intervention Strategies
Using Performance Indicators as Part of a Water Audit
 Using Performance Indicators as Part of a Water Audit Smart Management for Small Water Systems What are Performance Indicators? A series of water loss measures that are consistent, repeatable and presented
Water Research Foundation 4372a
 Water Research Foundation 4372a Real Loss Component Analysis: What s Your Leakage Profile Project Team Downloading the 4372 Materials www.waterrf.org, then search for 4372 or real losses 7 The AWWA Water
BEST PRACTICE 3: System Water Loss Control Overview Why a Best Practice? State Planning Requirements
 BEST PRACTICE 3: System Loss Control Foundational best practice Utility operations - implemented by water utilities on their own system Customer participation not applicable Overview loss control is the
Water Research Foundation 4372a. Real Loss Component Analysis: A Tool for Economic Water Loss Control
 Water Research Foundation 4372a Real Loss Component Analysis: A Tool for Economic Water Loss Control Project Team TECHNICAL TEAM Reinhard Sturm, Water Systems Optimization Kate Gasner, Water Systems Optimization
An Introduction to Strategic Water Loss Reduction
 An Introduction to Strategic Water Loss Reduction Webinar 2: Strategies to Address Real Water Losses When you know better you do better Maya Angelou Logistics At the top right corner of your screen: Show
George Kunkel, Will Jernigan, Cor Merks
 Learning Module #3 A Listening and Learning Session on the Use of Percentage Performance Indicators for Non-revenue Water Management George Kunkel, Will Jernigan, Cor Merks North American Water Loss Conference
WRF Webcast. A Snapshot of Water Loss: Examining the Country s Water Audit Submissions
 No part of this presentation may be copied, reproduced, or otherwise utilized without permission. WRF Webcast A Snapshot of Water Loss: Examining the Country s Water Audit Submissions November 5, 2015
Gallons per Capita - v2.05
 Gallons per Capita - v2.5 This spreadsheet-based GPCD calculator is designed to help quantify and track water uses associated with water distribution systems. The spreadsheet contains several separate
Performance Audit: Department of Watershed Management Efforts to Reduce Water Loss
 Performance Audit: Department of Watershed Management Efforts to Reduce Water Loss April 2017 City Auditor s Office City of Atlanta File #16.10 CITY OF ATLANTA City Auditor s Office Leslie Ward, City
FOR RELEASE: MONDAY, MARCH 21 AT 4 PM
 Interviews with 1,012 adult Americans conducted by telephone by Opinion Research Corporation on March 18-20, 2011. The margin of sampling error for results based on the total sample is plus or minus 3
REPORT ON THE EVALUATION OF WATER AUDIT DATA FOR PENNSYLVANIA WATER UTILITIES
 REPORT ON THE EVALUATION OF WATER AUDIT DATA FOR PENNSYLVANIA WATER UTILITIES Prepared by: Philadelphia, Pennsylvania Prepared for: Natural Resources Defense Council TABLE OF CONTENTS 1. Introduction 1
Performance-based contract financing options Pristina, 7 October, IFC Advisory Services in Public-Private Partnerships
 Performance-based contract financing options Pristina, 7 October, 2014 IFC Advisory Services in Public-Private Partnerships 2 Authorized Consumption Billed Authorized Consumption Unbilled Authorized Consumption
The Importance of Real Loss Component Analysis for Determining the Correct Intervention Strategy
 Leakage 2005 - Conference Proceedings Page 1 The Importance of Real Loss Component Analysis for Determining the Correct Intervention Strategy P Fanner*, J Thornton** *Fanner & Associates Ltd, 7 Brunswick
Village of Baltimore Water & Wastewater Analysis. July 2018
 Village of Baltimore Water & Wastewater Analysis July 2018 Table of Contents Introductory Summary... 1 Data... 1 Water Treatment Plant (WTP)... 1 Production... 2 Costs & Debts... 2 Wastewater Treatment
NON REVENUE WATER INTERNATIONAL BEST PRACTICE FOR ASSESSMENT, MONITORING AND CONTROL
 NON REVENUE WATER INTERNATIONAL BEST PRACTICE FOR ASSESSMENT, MONITORING AND CONTROL Malcolm Farley, Principal Consultant, Malcolm Farley Associates Oxfordshire, UK 12th Annual CWWA Conference Paradise
Mbombela Water Indaba : April 2012
 Background South Africa is a dry country, with a low average rainfall. Our rivers are small in comparison with other countries and shared with other countries. Presented by: Willem Wegelin Many of our
Toronto Water Budget BU Recommended Operating Budget Recommended Capital Plan 2017 Recommended Water Rate
 2017 BU25.1 Toronto Water Budget 2017 Recommended Operating Budget 2017 2026 Recommended Capital Plan 2017 Recommended Water Rate Lou Di Gironimo, General Manager, Toronto Water Budget Committee, November
Common stock prices 1. New York Stock Exchange indexes (Dec. 31,1965=50)2. Transportation. Utility 3. Finance
2. Transportation. Utility 3. Finance") Digitized for FRASER http://fraser.stlouisfed.org/ Federal Reserve Bank of St. Louis 000 97 98 99 I90 9 9 9 9 9 9 97 98 99 970 97 97 ""..".'..'.."... 97 97 97 97 977 978 979 980 98 98 98 98 98 98 987 988
Digitized for FRASER http://fraser.stlouisfed.org/ Federal Reserve Bank of St. Louis 000 97 98 99 I90 9 9 9 9 9 9 97 98 99 970 97 97 ""..".'..'.."... 97 97 97 97 977 978 979 980 98 98 98 98 98 98 987 988
Investit Software Inc. INVESTOR PRO CANADA 20 UNIT CONDOMINIUM DEVELOPMENT EXAMPLE
 INVESTOR PRO CANADA 20 UNIT CONDOMINIUM DEVELOPMENT EXAMPLE INTRODUCTION This example uses the Development Condominium template. This practice example consists of two Sections; 1. The input information
General Manager s Report
 1 General Manager s Report April 2018 Students engage in hands-on activities during WSSC s Water Works STEM session 3 50% in lost workday cases 65% in lost work days 54% in workers compensation costs Lyles
Key IRS Interest Rates After PPA
 Key IRS Rates - After PPA - thru 2011 Page 1 of 10 Key IRS Interest Rates After PPA (updated upon release of figures in IRS Notice usually by the end of the first full business week of the month) Below
2019 CITRUS HEIGHTS WATER DISTRICT BUDGET, CAPITAL IMPROVEMENT PROGRAM (CIP) AND RATE PRESENTATION
 AND RATE PRESENTATION") 2019 CITRUS HEIGHTS WATER DISTRICT BUDGET, CAPITAL IMPROVEMENT PROGRAM (CIP) AND RATE PRESENTATION 1 Mission Statement It is the mission of the Citrus Heights Water District to furnish a dependable supply
2019 CITRUS HEIGHTS WATER DISTRICT BUDGET, CAPITAL IMPROVEMENT PROGRAM (CIP) AND RATE PRESENTATION 1 Mission Statement It is the mission of the Citrus Heights Water District to furnish a dependable supply
360 CMR (2005)
") 1 of 15 DOCUMENTS 360 CMR 12.01 (2005) 12.01: Preamble The purpose of 360 CMR 12.00 is to promote water conservation by the communities that receive some or all of their water supply from the Authority
1 of 15 DOCUMENTS 360 CMR 12.01 (2005) 12.01: Preamble The purpose of 360 CMR 12.00 is to promote water conservation by the communities that receive some or all of their water supply from the Authority
Economic Level of Leakage (ELL)
") Conferenze sulle Strategie di Gestione delle Perdite Idriche 1 Economic Level of Leakage (ELL) Stuart Trow United Kingdom Leakage Consultant and Director of CaL Solutions Ltd Approaches to Estimating and
Conferenze sulle Strategie di Gestione delle Perdite Idriche 1 Economic Level of Leakage (ELL) Stuart Trow United Kingdom Leakage Consultant and Director of CaL Solutions Ltd Approaches to Estimating and
FOR RELEASE: WEDNESDAY, JULY 23 AT 6 AM
 Interviews with 1,012 adult Americans conducted by telephone by ORC International on July 18-20, 2014. The margin of sampling error for results based on the total sample is plus or minus 3 percentage points.
Mar 31, 2018 Cash Balance
 Staff Report To: Mayor Muhlfeld and City Councilors From: Dana Smith, Finance Director Date: April 28, 2018 Re: 3rd Quarter Financial Report for Fiscal Year 2018 This quarterly financial report provides
Pay or Play Penalties Look-back Measurement Method Examples
 Brought to you by Sullivan Benefits Pay or Play Penalties Look-back Measurement Method Examples The Affordable Care Act (ACA) imposes a penalty on applicable large employers (ALEs) that do not offer health
Performance Based Contracts in Non- Revenue Water Reduction Programs March Session 4: What is a PBC?
 Performance Based Contracts in Non- Revenue Water Reduction Programs March 2017 Session 4: What is a PBC? www.wsp.org www.worldbank.org/water www.blogs.worldbank.org/water @WorldBankWater Introduction
Office of Utilities Regulation REGULATORY FRAMEWORK FOR THE NATIONAL WATER COMMISSION ( )
") REGULATORY FRAMEWORK FOR THE NATIONAL WATER COMMISSION (2008-2013) REGULATORY FRAMEWORK FOR NATIONAL WATER COMMISSION (2008-2013) Introduction - Legal Authority Pursuant to Section 4(1) (a) of the OUR
REGULATORY FRAMEWORK FOR THE NATIONAL WATER COMMISSION (2008-2013) REGULATORY FRAMEWORK FOR NATIONAL WATER COMMISSION (2008-2013) Introduction - Legal Authority Pursuant to Section 4(1) (a) of the OUR
Spheria Australian Smaller Companies Fund
 29-Jun-18 $ 2.7686 $ 2.7603 $ 2.7520 28-Jun-18 $ 2.7764 $ 2.7681 $ 2.7598 27-Jun-18 $ 2.7804 $ 2.7721 $ 2.7638 26-Jun-18 $ 2.7857 $ 2.7774 $ 2.7690 25-Jun-18 $ 2.7931 $ 2.7848 $ 2.7764 22-Jun-18 $ 2.7771
Key IRS Interest Rates After PPA
 Key IRS Interest After PPA (updated upon release of figures in IRS Notice usually by the end of the first full business week of the month) Below are Tables I, II, and III showing official interest rates
EMPLOYER MUNICIPAL QUARTERLY WITHHOLDING BOOKLET
 CITY OF ST. MARYS 106 EAST SPRING STREET ST. MARYS, OHIO 45885-2363 IMPORTANT TAX INFORMATION EMPLOYER MUNICIPAL QUARTERLY WITHHOLDING BOOKLET INSTRUCTIONS FOR FILING WHO MUST FILE Each employer within
a b c d (c-b) Sept 30, 2015 Cash Balance
 Sept 30, 2015 Cash Balance") Staff Report To: From: Mayor John Muhlfeld and City Councilors Dana Smith, Finance Director Date: October 29, 2017 Re: 1st Quarter Financial Report for Fiscal Year 2018 This quarterly financial report
Staff Report To: From: Mayor John Muhlfeld and City Councilors Dana Smith, Finance Director Date: October 29, 2017 Re: 1st Quarter Financial Report for Fiscal Year 2018 This quarterly financial report
Muskegon County Wastewater Management System
 Muskegon County Wastewater Management System Municipal Wastewater Committee City of Muskegon City of North Muskegon City of Montague Fruitport Township Whitehall Township Cedar Creek Township Dalton Township
GROUNDWATER REDUCTION PLAN MONTHLY OPERATIONS REPORT MONTH REPORTED: DECEMBER, 2018
 [Type here] GROUNDWATER REDUCTION PLAN MONTHLY OPERATIONS REPORT MONTH REPORTED: DECEMBER, 2018 FY 2019 - Operating Actual vs. Budgeted FYTD 2019 - Key Performance Indicators Actual Budgeted % Variance
TEXAS GPCD CALCULATOR. Cheri Vogel, President CRVogel Consulting, LLC October 11, 2013
 TEXAS GPCD CALCULATOR Cheri Vogel, President CRVogel Consulting, LLC October 11, 2013 Today s Presentation History of the GPCD Calculator Existing Resources Overview of Texas GPCD Calculator Input Worksheets
CSV Import Instructions
 CSV Import Instructions The CSV Import utility allows a user to import model data from a prepared CSV excel file into the Foresight software. Unlike other import functions in Foresight, you will not create
2016 General Fund Actual Revenues, Expenses & Fund Balance
 Month 2016 YTD Revenues 2016 YTD Expenses Fund Balance Jan 741,592 522,981 8,146,240 Feb 1,437,152 1,759,804 7,604,976 March 2,223,544 2,142,743 8,008,429 Apr 3,383,880 3,471,582 7,839,926 May 5,183,323
Consolidation of the Warm Beach Water System
 Consolidation of the Warm Beach Water System Public Hearing July 24, 2018 Last Discussed: July 10, 2018 Warm Beach Water Association (WBWA) - Location and Size WBWA WBWA water system has ~600 water service
City of West Hollywood 8300 Santa Monica Boulevard West Hollywood, CA
 City of West Hollywood 8300 Santa Monica Boulevard West Hollywood, CA 90069-4314 GROUP IV City of West Hollywood 2017 Business Tax Forms & Instructions Payment Deadline: May 1, 2018 Renew your Business
Strategic Business Plan Department of Water Resources. Gwinnett County Department of Water Resources
 g w i n n e t t c o u n t y Strategic Business Plan Department of Water Resources Gwinnett County Department of Water Resources A Message from the Director The Department of Water Resources Strategic Business
Rule No. 16 Service Connections, Meters, and Customer s Facilities
 Sierra Park Water Company ORIGINAL SHEET Sheet #: 58-W Rule No. 16 Service Connections, Meters, and Customer s Facilities A. General 1. Utility s Responsibility a. In urban areas with dedicated front streets,
ENGINEERING AND OPERATIONS COMMITTEE. November 27, :30 PM Greenspot Road, Highland CA AGENDA
 ENGINEERING AND OPERATIONS COMMITTEE November 27, 2017-2:30 PM 31111 Greenspot Road, Highland CA 92346 CALL TO ORDER PLEDGE OF ALLEGIANCE PUBLIC COMMENTS NEW BUSINESS AGENDA 1. Approve the September 25,
Using practical predictions of Economic Intervention Frequency to calculate Short-run Economic Leakage Level, with or without Pressure Management
 Using practical predictions of Economic Intervention Frequency to calculate Short-run Economic Leakage Level, with or without Pressure Management A.O. Lambert, ILMSS Ltd, UK, ILMSS@CastillianLtd.com A.
2016 CITRUS HEIGHTS WATER DISTRICT BUDGET, CAPITAL IMPROVEMENT PROGRAM (CIP) AND RATE PRESENTATION
 AND RATE PRESENTATION") 2016 CITRUS HEIGHTS WATER DISTRICT BUDGET, CAPITAL IMPROVEMENT PROGRAM (CIP) AND RATE PRESENTATION COMMUNITY PRESENTATION Hilary Straus, Assistant General Manager Paul Dietrich, Project Manager 1 CHWD
2016 CITRUS HEIGHTS WATER DISTRICT BUDGET, CAPITAL IMPROVEMENT PROGRAM (CIP) AND RATE PRESENTATION COMMUNITY PRESENTATION Hilary Straus, Assistant General Manager Paul Dietrich, Project Manager 1 CHWD
Reducing Non-Revenue Water: Actions to Reduce Real Losses and Improve Customer Satisfaction. June 21, 2016
 Reducing Non-Revenue Water: Actions to Reduce Real Losses and Improve Customer Satisfaction June 21, 2016 A growing problem VS. 2 Good news and bad news No magic wand! Knowledgeable people sharing insight
SedonaOffice Users Conference. San Francisco, CA January 21 24, Deferred Income. Presented by: Bob Esquerra Debbie Stephens
 SedonaOffice Users Conference San Francisco, CA January 21 24, 2018 Deferred Income Presented by: Bob Esquerra Debbie Stephens This Page Intentionally Left Blank Page 2 of 20 Table of Contents What is
EARNED INCOME DISALLOWANCE (EID)
") EARNED INCOME DISALLOWANCE (EID) The purpose of the Earned Income Disallowance (EID) is to reward qualified residents who go to work or have increased earnings. Applicability of the Earned Income Disallowance
EARNED INCOME DISALLOWANCE (EID) The purpose of the Earned Income Disallowance (EID) is to reward qualified residents who go to work or have increased earnings. Applicability of the Earned Income Disallowance
WATER AND SEWER SERVICES AGREEMENT
 WATER AND SEWER SERVICES AGREEMENT Execution Copy WATER AND SEWER SERVICES AGREEMENT Between CITY OF DETROIT And GREAT LAKES WATER AUTHORITY Dated June 12, 2015 TABLE OF CONTENTS Page RECITALS... 1 ARTICLE
Hypothetical Illustration
 Hypothetical Illustration February 17, 2003 Mutual Fund American Funds Balanced A American Funds Gr Fnd of America A American Funds Intm Bd Fd Amer A Index Thomson US: Aggressive Growth - MF Thomson US:
PG&E Corporation. Fourth Quarter Earnings Call February 21, 2013
 1 PG&E Corporation Fourth Quarter Earnings Call February 21, 2013 This presentation is not complete without the accompanying statements made by management during the webcast conference call held on February
PETERS TOWNSHIP SANITARY AUTHORITY 2011 BUDGET WORKSHOP. November 30, 2010
 PETERS TOWNSHIP SANITARY AUTHORITY 2011 BUDGET WORKSHOP November 30, 2010 Agenda A. 2010 Budget Performance Summary B. 2011 Budget Request C. 2011 Capital Plan D. Consulting Engineer s Annual Report Preliminary
Business & Financial Services December 2017
 Business & Financial Services December 217 Completed Procurement Transactions by Month 2 4 175 15 125 1 75 5 2 1 Business Days to Complete 25 Jan Feb Mar Apr May Jun Jul Aug Sep Oct Nov Dec 217 Procurement
Supplier Charges in the Capacity Market
 Public Supplier Charges in the Capacity Market Webinar 7 September 2016 Jo Alexander Disclaimer: Please note that whilst these slides have been prepared with due care, EMR Settlement Limited does not make
City of Justin NOVEMBER
 City of Justin MONTHLY FINANCIAL REPORT NOVEMBER - 2018 1 Revenues: Sales tax revenue is up 14.5% from this time prior year and November s sales tax collections increased 2.4% from November 2017. The City
Regional overview Gisborne
 Regional overview Purchasing intentions - additional income-related rent subsidy (IRRS) places Area District 1 2 3 4+ TOTAL 3 35 5 7 total 3 35 5 7 7 8 9 1 11 Purchasing intentions - change within the
CITY OF RIVIERA BEACH, FLORIDA UTILITY SPECIAL DISTRICT S SYSTEMS AND OPERATIONS FOR FISCAL YEAR ENDING SEPTEMBER 30, 2010.
 UTILITY SPECIAL DISTRICT S SYSTEMS AND OPERATIONS FOR FISCAL YEAR ENDING SEPTEMBER 30, 2010 Overview The service area of the Utility District s Water System includes the entire City of Riviera Beach (approximately
Establishing a new account:
 221 S. Nursery Avenue, Purcellville VA 20132 540 338 7093 Hours 8 a.m. 5 p.m. By requesting utility service from the Town of Purcellville, the customer agrees to comply with all local ordinances concerning
VALUE AVERAGING - TECHNOLOGY MODEL PORTFOLIO - INVESTMENT SUMMARY
 VALUE AVERAGING TECHNOLOGY MODEL PORTFOLIO INVESTMENT SUMMARY Portfolio Start Date January 15, 2013 Statement Date March 29, 2013 Security Total Current Avg Cost Adjusted Cost Current % of Gain/Loss Gain/Loss
Defining a Resilient Business Model for Water Utilities
 Defining a Resilient Business Model for Water Utilities Water Research Foundation Project #4366 Shadi Eskaf, Environmental Finance Center at UNC eskaf@sog.unc.edu www.efc.unc.edu National Water & Wastewater
ACCT 101 GROUP PROJECT INSTRUCTIONS
 ACCT 101 GROUP PROJECT INSTRUCTIONS This project is to be completed as a group. All group members should actively participate in the project and it is up to the group to decide who will be responsible
Earned Value Management An Overview March 2014
 Earned Value Management An Overview March 2014 SAVE International Cascadia Chapter Introduction What is Earned Value? Why is Earned Value important? What is required? Earned Value Definitions & Process
Fichtner Management Consulting. Development of the Cost-plus Methodology in Water Supply. International Best Practice
 Fichtner Management Consulting Development of the Cost-plus Methodology in Water Supply International Best Practice Tbilisi, October 17, 2015 I Dr Maria Belova Table of Contents Scope of Work Critical
Form 8885 Health Coverage Tax Credit March 1, 2012
 Form 8885 Health Coverage Tax Credit March 1, 2012 (Updated 2012-03-01; changes are highlighted in red) It is that time of the year again time to file your federal income tax return. For those of you who
Lookout Mountain Water District: Genesis and Evolution
 Lookout Mountain Water District: Presented by: Genesis and Evolution John Roscoe, President of the Board and Panel: Board of Directors and Contractors September 30, 2010 1 Introduction Purpose: Update
EMPLOYER MUNICIPAL QUARTERLY WITHHOLDING BOOKLET
 DIVISION OF TAXATION CITY OF WESTERVILLE P.O. BOX 130 WESTERVILLE, OHIO 43086-0130 IMPORTANT TAX INFORMATION EMPLOYER MUNICIPAL QUARTERLY WITHHOLDING BOOKLET IN ORDER TO INSURE PROPER POSTING OF YOUR WITHHOLDING
Regional overview Hawke's Bay
 Regional overview Purchasing intentions - additional income-related rent subsidy (IRRS) places Area Hastings Central 1 2 3 4+ TOTAL 5 5 25 125 3 3 1 7 total 8 8 35 195 7 8 9 1 11 Purchasing intentions
2017 ENTERPRISE ASSET MANAGEMENT PLAN
 Corporate Asset Management 2017 ENTERPRISE ASSET MANAGEMENT PLAN Investments in Peel s Infrastructure We are all asset managers! Executive Summary The Region s infrastructure is a public investment with
Electric Price Outlook for Indiana Low Load Factor (LLF) customers December 2016
 customers December 2016") Electric Price Outlook for Indiana Low Load Factor (LLF) customers December 2016 Price projection We project our prices for Low Load Factor customers to increase 4 to 6 percent in 2017 compared to 2016.
Electric Price Outlook for Indiana Low Load Factor (LLF) customers December 2016 Price projection We project our prices for Low Load Factor customers to increase 4 to 6 percent in 2017 compared to 2016.
MIAMI PARKING AUTHORITY
 Revenue & Expenses Summary For the Five Months Ending February 28, 2019 Page 1 Adopted FY 2018 Actual Actual Actual Budget Actual Versus FY 2018 Versus 2019 Budget Year-To-Date $ $ $ $ % $ % Operating
Electric Price Outlook for Indiana High Load Factor (HLF) customers December 2016
 customers December 2016") Electric Price Outlook for Indiana High Load Factor (HLF) customers December 2016 Price projection We project our prices for High Load Factor customers to increase 4 to 6 percent in 2017 compared to 2016.
Electric Price Outlook for Indiana High Load Factor (HLF) customers December 2016 Price projection We project our prices for High Load Factor customers to increase 4 to 6 percent in 2017 compared to 2016.
Investit Software. Investor Pro & Express Projection Wizard Video Tutorial Manual. August 2011
 Investit Software Investor Pro & Express Projection Wizard Video Tutorial Manual August 2011 Neil Osborne M.B.A. DL. (604) 988-5518 nosborne@investitsoftware.com Investit Software Inc. Toll free 877-878-1828
WATER ASSET MANAGEMENT PLAN
 WATER ASSET MANAGEMENT PLAN Georgetown Charter Township Ottawa County, Michigan November 2017 Where we re going: System Goals INTRODUCTION About this Document This document is our Water Asset Management
Dryland Bermuda Enterprise Budget - Hay Only 1000 acres farmed, 160 acres for this budget. OSU Name. OKLAHOMA COOPERATIVE Farm Description
 Dryland Bermuda Enterprise Budget - Hay Only 1000 acres farmed, 160 acres for this budget OSU Name OKLAHOMA COOPERATIVE Farm Description EXTENSION SERVICE Total PRODUCTION Units Price Quantity $/Acre Hay
Toronto Water Budget. Toronto Water Budget. Water. Recommended. Lou Di Gironimo General Managou Di Gironi. Budget Committee.
 2016 Toronto Water Budget Toronto Water Budget 2016 2016 Recommended Recommended Ope Opearting 2016 Recommned2016 Budget Operating 2016 2025 2016-2025 Budget Recommended rating Recommended Budget Capital
RECENT ADVANCES IN CALCULATING ECONOMIC INTERVENTION FREQUENCY FOR ACTIVE LEAKAGE CONTROL, AND IMPLICATIONS FOR CALCULATION OF ECONOMIC LEAKAGE LEVELS
 IWA International Conference on Water Economics, Statistics, and Finance Rethymno, Greece, 8-10 July 2005 RECENT ADVANCES IN CALCULATING ECONOMIC INTERVENTION FREQUENCY FOR ACTIVE LEAKAGE CONTROL, AND
Two SWIFT Case Studies
 Two SWIFT Case Studies City of Bedford, TX (2015) City of Keller, TX (2016) Project Team William Moriarty, P.E. Thomas Hoover, P.E. Pioneers 1. First SWIFT application submitted 2. First Water Conservation
Energy Yield Reconciliation in Monthly O&M Reports
 Energy Yield Reconciliation in Monthly O&M Reports Claire Puttock, Lee Cameron & Alex Clerc April 15, 2016 EWEA Technology Workshop, Bilbao Contents Introduction to variance explanation Motivation Key
Department of Public Welfare (DPW)
") Department of Public Welfare (DPW) Office of Income Maintenance Electronic Benefits Transfer Card Risk Management Report Out-of-State Residency Review FISCAL YEAR 2014-2015 September 2014 (June, July and
Department of Public Welfare (DPW) Office of Income Maintenance Electronic Benefits Transfer Card Risk Management Report Out-of-State Residency Review FISCAL YEAR 2014-2015 September 2014 (June, July and
SPRINGVILLE CITY CULINARY WATER IMPACT FEE ANALYSIS (IFA) MAY 2014
 MAY 2014") SPRINGVILLE CITY CULINARY WATER IMPACT FEE ANALYSIS (IFA) MAY 2014 Adopted May 20, 2014 TABLE OF CONTENTS IMPACT FEE CERTIFICATION... 3 SECTION 1: EXECUTIVE SUMMARY... 4 PROPOSED CULINARY WATER IMPACT
SPRINGVILLE CITY CULINARY WATER IMPACT FEE ANALYSIS (IFA) MAY 2014 Adopted May 20, 2014 TABLE OF CONTENTS IMPACT FEE CERTIFICATION... 3 SECTION 1: EXECUTIVE SUMMARY... 4 PROPOSED CULINARY WATER IMPACT
Water, Sewer and Storm Sewer Rate Analysis
 Water, Sewer and Storm Sewer Rate Analysis August 8, 207 68 North Main Street Bowling Green, Ohio 43402 49-352-7537 www.poggemeyer.com Table of Contents Introduction................................................................
EMPLOYER JEDZ MONTHLY WITHHOLDING BOOKLET
 BLENDON TOWNSHIP JEDZ C/O CITY OF WESTERVILLE PO BOX 636 WESTERVILLE, OH 43086-0636 IMPORTANT TAX INFORMATION EMPLOYER JEDZ MONTHLY WITHHOLDING BOOKLET IN ORDER TO INSURE PROPER POSTING OF YOUR WITHHOLDING
Asset Manager Performance Comparison
 Cape Peninsula University of Technology Retirement Fund August 2017 DISCLAIMER AND WARNINGS: Towers Watson (Pty) Ltd, a Willis Towers Watson company, is an authorised financial services provider. Although
FOR RELEASE: Wednesday, February 19 at 6:00 a.m. ET
 Interviews with 1,027 adult Americans conducted by telephone by ORC International on February 12-15, 2015. The margin of sampling error for results based on the total sample is plus or minus 3 percentage
Asset Manager Performance Comparison
 Cape Peninsula University of Technology Retirement Fund September 2017 DISCLAIMER AND WARNINGS: Towers Watson (Pty) Ltd, a Willis Towers Watson company, is an authorised financial services provider. Although
GROUNDWATER REDUCTION PLAN MONTHLY OPERATIONS REPORT
 GROUNDWATER REDUCTION PLAN MONTHLY OPERATIONS REPORT GRP REVIEW COMMITTEE MEETING OCTOBER 22, 2018 SJRA BOARD MEETING OCTOBER 25, 2018 TABLE OF CONTENTS Table of Contents 1 Acronyms and Defini ons 2 1.0
SmallBizU WORKSHEET 1: REQUIRED START-UP FUNDS. Online elearning Classroom. Item Required Amount ($) Fixed Assets. 1 -Buildings $ 2 -Land $
 Fixed Assets. 1 -Buildings $ 2 -Land $") WORKSHEET 1: REQUIRED START-UP FUNDS Item Required Amount () Fixed Assets 1 -Buildings 2 -Land 3 -Initial Inventory 4 -Equipment 5 -Furniture and Fixtures 6 -Vehicles 7 Total Fixed Assets Working Capital
WORKSHEET 1: REQUIRED START-UP FUNDS Item Required Amount () Fixed Assets 1 -Buildings 2 -Land 3 -Initial Inventory 4 -Equipment 5 -Furniture and Fixtures 6 -Vehicles 7 Total Fixed Assets Working Capital
VALUE ADDED TAX (VAT) RETURNS USER GUIDE
 RETURNS USER GUIDE") VALUE ADDED TAX (VAT) RETURNS USER GUIDE February 2018 1 Contents 1. Brief overview of this user guide... 3 2. Important notes about the VAT Return... 3 3. Completing and Submitting the VAT Return Form...
VALUE ADDED TAX (VAT) RETURNS USER GUIDE February 2018 1 Contents 1. Brief overview of this user guide... 3 2. Important notes about the VAT Return... 3 3. Completing and Submitting the VAT Return Form...
Research Accounting & Analysis Grant & Contract Accounting? Management Accounting & Analysis
 Research Accounting & Analysis Grant & Contract Accounting? Management Accounting & Analysis Operational Performance Dashboard for August 20 Quarter 3 FY 20 (April - June 20) Grant and Contract Accounting
NR614: Foundations of Health Care Economics, Accounting and Financial Management
 NR614: Foundations of Health Care Economics, Accounting and Financial Management WEEK 7: Budgeting SLIDE 1: Week 7: Week Seven Sample Problem: Budgeting... There is one sample problem provided in week
REQUEST FOR PROPOSALS
 REQUEST FOR PROPOSALS Water & Sewer Utilities Optimization City of Wichita Public Works & Utilities May 14, 2015 PROJECT DEFINITION The City of Wichita is seeking proposals for assistance with the risk,
SELF-STORAGE FOR SALE
 PURCHASE PRICE: $495,000 CAP RATE: 8.68% OCCUPANCY: 86.4% NOI: $42,973 LOT SIZE: 1.462ac (combined) BLDG CLASS: C OVERVIEW Multi-building storage facility in a rapidly growing area. The land offers over
Risk-based Prioritization of Transmission & Distribution Projects in Westchester County
 Risk-based Prioritization of Transmission & Distribution Projects in Westchester County NYS AWWA Water Event April 26, 2017 Alberto Quiroz, PE Outline Background Methodology Results SUEZ in North America
January 2015 Monthly Financial Report PREPARED BY
 January 2015 Monthly Financial Report PREPARED BY Financial Accounting & Reporting Division City of Phoenix Monthly Financial Report January 2015 Table of Contents by Programs Page Performance Status
BODEGA BAY PUBLIC UTILITY DISTRICT Water and Wastewater Rate Study
 BODEGA BAY PUBLIC UTILITY DISTRICT Water and Wastewater Rate Study FINAL REPORT March 22, 2018 BARTLE WELLS ASSOCIATES Independent Public Finance Advisors 1889 Alcatraz Avenue Berkeley, CA 94703-2714 Tel.
PRINCIPLES OF ACCOUNTING
 GRADED PROJECT Directions: Be sure to make an electronic copy of your answer before submitting it to Ashworth College for grading. Unless otherwise stated, answer in complete sentences, and be sure to
UTILITY RATE STUDY. Public Hearing
 UTILITY RATE STUDY Public Hearing. Public January 23, 2018 Resources Management Group, Inc. Utility, Rate, Financial, and Management Consultants Rate Guiding Principles Recognized Revenues Should Be Sufficient
Water Operations Current Month - November 2018
 November 2018 Water Operations Current Month - November 2018 $8.0 Net Operating Revenue (Net of Bad Debt) $8.1 $8.6 $8.0 2.0 1.5 Volumes Billions of Gallons Sold 1.8 1.7 1.6 $6.0 1.0 $4.0 $2.0 0.5 Actual