PETERS TOWNSHIP SANITARY AUTHORITY 2011 BUDGET WORKSHOP. November 30, 2010
|
|
|
- Eugene Parker
- 5 years ago
- Views:
Transcription
1 PETERS TOWNSHIP SANITARY AUTHORITY 2011 BUDGET WORKSHOP November 30, 2010
2 Agenda A Budget Performance Summary B Budget Request C Capital Plan D. Consulting Engineer s Annual Report
3 Preliminary Advertised Budget Workshop Should have 4 separate documents 2010 Budget Performance Summary Report and Year 2011 Budget Request (Purple Cover) Year 2011 Budget Request (Orange Cover) Appendix (for both documents, White Cover) Proposed Capital Improvement Plan for 2011
4 Why Do We Budget?
5 Responsive
6 Sustainable Level of Service Defined in our Capital Plan as: A service level which provides the capacity for sustained customer growth while providing for uninterrupted service to our customers, and meeting all regulatory requirements. In measurable terms? Benchmarking Rates No Sewage Backups No Plant Bypasses Brush Run 1994 DC 1998 No Pump Station Overflows (two in 2010 due to 21-in snowfall) No NPDES Excursions Brush Run None 1994 DC Infrequent Jan 09
7 Sustainable Level of Service, cont Eliminate MH Overflows 4 dry weather in 2010 Wet Weather, None: Ultimately, Infrequent to the point of being practically non-existent Dry Weather: Realistic, Once every 2 years Capacity Available at Plants and Interceptors Say with confidence capacity available for 5 years Provide Safe Working Environment Only One lost time accident over 10 years Take Pride in our Organization and Facilities

8 Where We Came From and Why We Budget?
9 Budget Summary 2010 Summary Surplus of $364,552 $40,052, + $74,000 cover, + $250,500 Eq. Rpl. Charges for Services Revenue On Target $ Reduced Residential Water Consumption Increased Non-Residential Water Consumption Non-Operating Revenue $16,700 more than budget forecast
10 Budget Summary 2011 Summary Operating Revenue of $2,995,000 Operating Revenue increases by $9,000 Adequate Funds for 2011 Equip Replace Allow stays at $250,000 Non-Operating Revenue expected to decrease by 39% Less taps due to slow housing market Less investment interest earned
11 2010 Revenues Operating Revenue = $2,986,000 $3,800 > Budget $873,431 29% Debt and Admin 2010 Operating Revenue $34,284 $75,517 1% 3% Penalties and Interest Misc Sewer Rentals Non-Operating Rev =$238,000 $15,000 > Budget Total Revenue = $3,224,000 $18,800 > Budget $48,252 20% 2010 Non-Operating Revenue Investment Interest Taps and Assessments $2,003,222 67% $189,663 80%
12 Non-Operating Revenue How Tap Fee Reimbursements Shown Tap Fee Reimbursements are shown under Non-Operating Revenues as a subcategory of the Tap Fee Revenue. Each development has its own account in order to properly track the reimbursement back to the Developer. The reimbursement is reflected in the Capital Budget.
13 Operating Surplus transferred to CIRF Funds Capital Plan Transfers to CIRF $800,000 $700,000 $600,000 $500,000 $400,000 $300,000 $220,957 $236,633 $302,272 $423,000 $578,000 $253,000 $167,000 $250,000 $148,000 Projected $105,600 $200,000 $100,000 $179,882 $193,575 $211,000 $286,535 $450,000 $180,000 $180,000 $250,000 $300,000 $240,000 $321,296 $251,580 $0 $72,000 $ Operating Fund Taps/Assessments
14 Revenue Detail Sewer Rentals Sewer Rentals Comparison of Budget Forecast to Actual Projected $1,800,000 $1,600,000 $1,400,000 $1,200,000 $1,000,000 $800,000 $600,000 $400,000 $200,000 $0 Residential Sewer Non-Residential Budget Projected
15 Sewer Rentals Water Consumption Quarterly Residential Water Consumption by Year After Deduct Meter Adjustments Gallons 140,000, ,000, ,000, ,180, ,828, ,491, ,279, ,678,405 80,000,000 60,000,000 40,000,000 20,000, st Q 2nd Q 3rd Q 4th Q
16 Revenue Detail Minimum Service Charge Minimum Service Charge Comparison of Budget forecast to Actual Projected $800,000 $700,000 $600,000 $500,000 $400,000 $300,000 $200,000 $100,000 $0 Residential Sewer Non-Residential Meter Charge Budget Projected
17 Revenue Detail Penalties, Interest, Misc Penalties, Interest, and Miscellaneous Revenue Comparison of Budget Forecast to Actual Projected Series1 Series2 $40,000 $35,000 $30,000 $25,000 $20,000 $15,000 $10,000 $5,000 $- Penalties Interest Deduct Meter App. Lien Letter Fees Dye Test Fees Curtailment Revenue Miscellaneous Income Labor Reim from CIRF/Dev Deduct Meter Read Fees Dev Review/Inspec Fees Revenue Fund Interest
18 Non-Operating Revenue Detail Non-Operating Revenue Comparison of Budget Forecast to Actual Projected $200,000 $180,000 $160,000 $140,000 $120,000 $100,000 $80,000 $60,000 $40,000 $20,000 $0 Tap Fees Investment Interest Church Hill Rental Ivy Lane Assessments 2007 E. McMurray Payments Budget Projected
19 2010 Operating Expenses Expenses Overall Total, including Debt Service. $2,872,400 $101,500 less than budgeted Departments All on budget or under Major Budget Variances Utilities, Over $19,600 (10%) Personnel, Under $23,700 (2%, retirement) Professional Services Under $13,000 (14%)


20
21 Debt Service Insurance Admin Services $1,200,000 $1,000,000 $800,000 $600,000 $400,000 $200,000 $ Expenses Comparison of Budget Forecast with Actual Projected Budget Projected Equip/Facilities Maint & Repair Utilities Biosolids Personnel Computer/Network POTW Fees Professional Services Vehicles Cone Supplies
22 Treatment Expenses Treatment Statistics Brush Run Treated 383 million gallons of wastewater Disposed of 1,735 tons of biosolids Treatment Statistics DC Treated 226 million gallons of wastewater Service to a total of 6,735 EDUs 19,200 equivalent persons
23 Brush Run WPCP 2010 Performance Summary Previous 12 Months 30 Day Average Final Effluent Concentration CBOD5 TSS NH3-N TSS Permit Limit 30 mg/l CBOD Permit Limit 20 mg/l Ammonia Permit Limit 2.0 mg/l Nov-09 Dec Jan-10 Feb Mar Apr May Jun Jul Aug Sep Oct
24 DC WPCP 2010 Performance Summary Previous 12 months 30 Day Average Final Effluent Concentration CBOD5 TSS NH3-N TSS Permit Limit 30 mg/l CBOD Permit Limit 25 mg/l m g /L Ammonia Permit Limit 9 mg/l Nov-09 Dec Jan-10 Feb Mar Apr May Jun Jul Aug Sep Oct
25 Treatment Expenses Significant Items Department is under budget by $12,400(1%) Most Line Items on Target Maintenance & Repair Under budget by $10,800 (24%) Less than expected equipment failures Utilities Over budget by $21,200 (12.6%) Electrical Power Rate Increase
26 Treatment Expenses Significant Items Biosolids (sludge disposal) Under budget by $9,100 (11%) Improved Cake Performance 215 less tons disposed of than budgeted 12-month Average Cake Conc.= 14.7% Slightly less than 15% target Still room for improvement Vendor reduced contract disposal fee From $$40.16 to $38.00/ton (5.4% decrease) Effective October 2010.
27 Treatment Expenses Significant Items POTW Fees Treatment Charges paid to ALCOSAN for Marella Manor (82 Customers) Required to budget 120% of estimated charges Results in $3,900 under budget
28 Treatment Expenses Significant Items Individual Plant Performance Brush Run $1,090/million gallons DC $1,380/million gallons Brush Run operates 21% more efficiently Treatment Charge Alone Based on two services of Treatment and Collection $3.16/1,000 gallons of sewage (includes I/I) $4.86/1,000 gallons of water consumed Treatment is 68% of our charge to customers
29 2010 Collection System Expenses Department is under budget by $29,100 Major Accomplishments TVed 10,700 feet of sewer (46% of target) Rehabilitated 7,300 feet of sewer (61% of target) Dye tested 207 homes on property transfer by PTSA staff at a charge of $ each 7% failure rate (compare: 4% when plumbers performed test) Dye tested 63 homes area wide 5% failure rate Inspected all Grease Traps in DC
30 Time of Sale Dye Tests Projected No. of Tests/Year
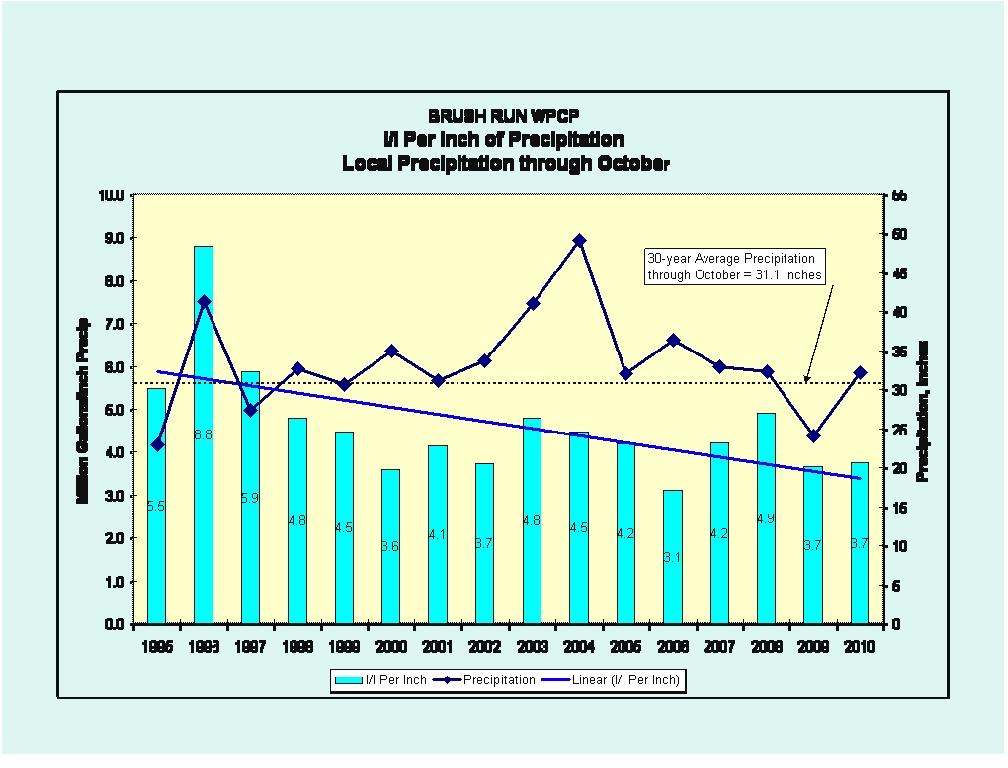
31 I/I Removal Evaluation 35% of sewage processed at the two plants combined is Infiltration Total Sewage Flow Metered Water Consumption = Infiltration 1995 Brush Run annual avg flow = 1.00 MGD, with 28.9 inches of precipitation 2010 Brush Run annual avg flow = 1.05 MGD (12 months), with 37.0 inches precip Approximates 165,000 gpd I/I removed Removed 35% of the infiltration present in 1995
32
33 Brush Run WPCP September 27, 2010 Rain Event /29/2010 2:40 9/29/2010 5:10 9/27/ :10 9/27/ :40 9/27/ :10 9/27/ :40 9/27/ :10 9/28/2010 1:40 9/28/2010 4:10 9/28/2010 6:40 9/28/2010 9:10 9/28/ :40 9/28/ :10 9/28/ :40 9/28/ :10 9/28/ :40 9/29/2010 0:10 9/27/ :40 9/27/2010 5:40 9/27/2010 8:10 Flow, MGD Rain, inches Still a lot of work to do! Highest Peak Rain Event in inches on Dry Ground Flow Rain
34 Collection System Significant Items Maintenance & Repair Under budget by $1,000 (1%) Vehicles Under budget by $660 (2.9%) Fuel costs low 35,000 total miles vs. 2009s 44,300 total miles Repair expenses low
35 Collection System Significant Items Utilities On budget No substantial rain events help to keep pump station power expense on target Changed three pump station autodialers to cell phones during year
36 Collection System Significant Items Salary & Wages, 4 employees (currently 3) Under budget by $11,300 (4.9%) Retirement of one employee POTW Fees 3% of USC s operation and maintenance sot of their Brush Run Pump Station Marella Manor Customers Equates to $10.68/quarter per customer Compare to $33.76/quarter we charge
37 Administration Department Department over budget by $3,800 (0.5%) Completed 100% of deduct meters between 2005 and 2010 Completed attaching Construction Plans to GIS sewer segments Continued with Workplace Safety committee and received 5% credit on Workers Compensation premium Administered H2O grant and Conservation Works grant In process of updating Authority s website
38 Admin - Significant Budget Items Materials & Supplies Over budget by $2,000 (move-in supplies) Maintenance & Repair Over by $300 (13%) Copier Usage 2010 Color includes color prints from Laser printer B&W 44,000 30,000 Color 3,746 1,951 Total 47,746 31,951
39 Administration Significant Items Utilities Under budget by $1,100 (4.3%) Office Power over budget $560 (16%) Other Utilities under budget Salary & Wages, 5 employees Under budget by $2,000 (0.6%)
40 Administration Significant Items Professional Services On budget Engineering total = $223,000 (YTD) Includes Operating, CIRF, and Developer (2008 = $165,700, 2009 =$240,200) Legal total = $23,300 (YTD) Insurance Over budget by $3,800 (9.4%) Engaged Insurance Consultant Administrative Services Over budget by $1,900 (1.8%) JTS fee of 1.9% of amount collected
41 Administration- Debt Service $62,400 less than budgeted (7.5%) $74,000 due to 10% cover Under estimated Bond Interest by $(7,875) Sewer Revenue Bonds Principle balance $3,745,000 Final payment 9/2/2017 Ivy Lane Pennvest Loan Principle balance $293,949 Final payment March 31, 2023
42 Administration- Debt Service Total outstanding debt is $4,039, % of Net Assets of $22 million Based on data from the Authority s bond insurer in 1998, a Debt to Net Assets ratio for an Operating Authority is: Excellent if between 30% and 50% Adequate if between 60% and 70% Concerned if greater than 70% - After DC Borrowing still only 39% Other Benchmarks Debt/EDU = $602/EDU Debt/person = $209/person 1992 Benchmark Stronger if less than $750/person CPI Adjusted = $1,170/person After DC Borrowing = $760/person Brush Run Borrowing,1996 = $518/person, CPI adjusted=$722
43 End of 2010 Performance Summary Questions? 10 minute Break 2011 is not that long
2018 Budget Performance Summary
 2018 Budget Performance Summary Management projects a year-end budget surplus of approximately $344,773 in the Operating Budget. However, it should be noted that Operating Revenue is projected $27,627
Peters Township Sanitary Authority. Summary Report of Tapping Fee Calculation and Connection Charges
 Peters Township Sanitary Authority Summary Report of Tapping Fee Calculation and Connection Charges June 30, 2008 Update No. 2 August 12, 2008 Summary Report Tapping Fee Calculation and Connection Charges
PETERS TOWNSHIP SANITARY AUTHORITY. Audited Financial Statements and Required Supplementary Information
 Audited Financial Statements and Required Supplementary Information For The Years Ended TABLE OF CONTENTS PAGE NO.... Independent Auditors Report. i-xiv... Management Discussion and Analysis. 1... Statements
SANITARY SEWER FUND PUBLIC WORKS
 285 2015 2016 2017 2017 2018 Actual Actual Budget Estimate Budget Beginning Net Position $ 1,556,256 $ 2,133,912 $ 3,537,945 $ 3,537,945 $ 3,333,823 Operating Revenue 5,758,183 6,475,486 6,751,246 6,681,766
City of Justin NOVEMBER
 City of Justin MONTHLY FINANCIAL REPORT NOVEMBER - 2018 1 Revenues: Sales tax revenue is up 14.5% from this time prior year and November s sales tax collections increased 2.4% from November 2017. The City
Cash & Liquidity The chart below highlights CTA s cash position at March 2017 compared to March 2016.
 To: Chicago Transit Authority Board From: Jeremy Fine, Chief Financial Officer Re: Financial Results for March 2017 Date: May 10, 2017 I. Summary CTA s financial results are $0.6 million favorable to budget
Muskegon County Wastewater Management System
 Muskegon County Wastewater Management System Municipal Wastewater Committee City of Muskegon City of North Muskegon City of Montague Fruitport Township Whitehall Township Cedar Creek Township Dalton Township
PETERS TOWNSHIP SANITARY AUTHORITY. Audited Financial Statements and Required Supplementary Information
 Audited Financial Statements and Required Supplementary Information For The Years Ended December 31, 217 and 216 TABLE OF CONTENTS PAGE NO. Independent Auditors' Report. i-xiv 1 2-3 4-5 6-23 Management
Cash & Liquidity The chart below highlights CTA s cash position at September 2017 compared to September 2016.
 To: Chicago Transit Authority Board From: Jeremy Fine, Chief Financial Officer Re: Financial Results for September 2017 Date: November 15, 2017 I. Summary CTA s financial results are $7.7 million favorable
City of Northfield, Minnesota Wastewater Treatment Facility Plan. Council Workshop September 8, 2015
 City of Northfield, Minnesota Wastewater Treatment Facility Plan Council Workshop September 8, 2015 Introduction Background of Wastewater Treatment Facility Approach to Evaluation Study Results Implementation
Cash & Liquidity The chart below highlights CTA s cash position at December 2017 compared to December 2016.
 To: Chicago Transit Authority Board From: Jeremy Fine, Chief Financial Officer Re: Financial Results for December 2017 Date: February 14, 2018 I. Summary CTA s financial results are $4.7 million favorable
Cash & Liquidity The chart below highlights CTA s cash position at February 2017 compared to February 2016.
 To: Chicago Transit Authority Board From: Jeremy Fine, Chief Financial Officer Re: Financial Results for February 2017 Date: April 5, 2017 I. Summary CTA s financial results are $0.3 million favorable
SAUSALITO-MARIN CITY SANITARY DISTRICT 1 EAST ROAD SAUSALITO, CALIFORNIA Telephone: (415) Fax: (415)
 Fax: (415)") 1 EAST ROAD SAUSALITO, CALIFORNIA Telephone: (415) 332-0244 Fax: (415) 332-0453 Budget FY 2017/18 Adopted by Board on June 5, 2017 BUDGET EXECUTIVE SUMMARY FISCAL YEAR 2017/18 DISTRICT OVERVIEW The Sausalito-Marin
1 EAST ROAD SAUSALITO, CALIFORNIA Telephone: (415) 332-0244 Fax: (415) 332-0453 Budget FY 2017/18 Adopted by Board on June 5, 2017 BUDGET EXECUTIVE SUMMARY FISCAL YEAR 2017/18 DISTRICT OVERVIEW The Sausalito-Marin
Cash & Liquidity The chart below highlights CTA s cash position at January 2018 compared to January 2017.
 To: Chicago Transit Authority Board From: Jeremy Fine, Chief Financial Officer Re: Financial Results for January 2018 Date: March 14, 2018 I. Summary CTA s financial results are $1.7 million unfavorable
Glacial Lakes Sanitary Sewer & Water District Utility Rate Study. Shelly Eldridge Ehlers Jeanne Vogt - Ehlers
 Glacial Lakes Sanitary Sewer & Water District Utility Rate Study Shelly Eldridge Ehlers Jeanne Vogt - Ehlers 05/30/2017 1 Background What are Utility Funds Utility funds are used to pay for operations,
Cash & Liquidity The chart below highlights CTA s cash position at August 2018 compared to August 2017.
 To: Chicago Transit Authority Board From: Jeremy Fine, Chief Financial Officer Re: Financial Results for August 2018 Date: October 10, 2018 I. Summary CTA s financial results are favorable to budget for
The year to date is less than budget and prior year by 15.4 million and 11.6 million, respectively.
 To: Chicago Transit Authority Board From: Jeremy Fine, Chief Financial Officer Re: Financial Results for September 2016 Date: November 16, 2016 I. Summary CTA s financial results are $0.3 million unfavorable
Cash & Liquidity The chart below highlights CTA s cash position at June 2018 compared to June 2017.
 To: Chicago Transit Authority Board From: Jeremy Fine, Chief Financial Officer Re: Financial Results for June 2018 Date: August 15, 2018 I. Summary CTA s financial results are unfavorable to budget for
Village of Baltimore Water & Wastewater Analysis. July 2018
 Village of Baltimore Water & Wastewater Analysis July 2018 Table of Contents Introductory Summary... 1 Data... 1 Water Treatment Plant (WTP)... 1 Production... 2 Costs & Debts... 2 Wastewater Treatment
General Manager s Report
 1 General Manager s Report April 2018 Students engage in hands-on activities during WSSC s Water Works STEM session 3 50% in lost workday cases 65% in lost work days 54% in workers compensation costs Lyles
Cash & Liquidity The chart below highlights CTA s cash position at March 2018 compared to March 2017.
 To: Chicago Transit Authority Board From: Jeremy Fine, Chief Financial Officer Re: Financial Results for March 2018 Date: May 9, 2018 I. Summary CTA s financial results are $0.9 million favorable to budget
Wastewater Utility Enterprise
 Wastewater Utility Enterprise Wastewater Utility Operating Fund Summary Wastewater Utility Revenue (62) Wastewater Utility Collection Systems Operations (62-4510) Wastewater Treatment Operations (62-4515)
WESTWOOD LUTHERAN CHURCH Summary Financial Statement YEAR TO DATE - February 28, Over(Under) Budget WECC Fund Actual Budget
 Budget WECC Fund Actual Budget") WESTWOOD LUTHERAN CHURCH Summary Financial Statement YEAR TO DATE - February 28, 2018 General Fund Actual A B C D E F WECC Fund Actual Revenue Revenue - Faith Giving 1 $ 213 $ 234 $ (22) - Tuition $ 226
WESTWOOD LUTHERAN CHURCH Summary Financial Statement YEAR TO DATE - February 28, 2018 General Fund Actual A B C D E F WECC Fund Actual Revenue Revenue - Faith Giving 1 $ 213 $ 234 $ (22) - Tuition $ 226
GLWA: Working In Collaboration. Sue McCormick, CEO
 GLWA: Working In Collaboration MWEA Collections Seminar October 2, 216 Sue McCormick, CEO One Water 2 Who is GLWA? VISION: We are the Service Provider of Choice in Southeast Michigan Sue McCormick, CEO
WATER AND WASTEWATER FUND REVENUES
 WATER AND WASTEWATER FUND REVENUES Water revenues comprise $12.11 million, or 70.6% of total revenues of the fund, while wastewater (sewer) charges comprise $4.25 million, or 24.7% of total revenues. Water
METRO. Fiscal Year 2012 Monthly Board Report. September 2012 (Fourth Quarter Fiscal Year-to-Date)
") METRO Fiscal Year 2012 Monthly Board Report Revenue Expense Ridership Performance (Fourth Quarter Fiscal Year-to-Date) This report is based on a preliminary closing of the year-end financials for FY2012
METRO Fiscal Year 2012 Monthly Board Report Revenue Expense Ridership Performance (Fourth Quarter Fiscal Year-to-Date) This report is based on a preliminary closing of the year-end financials for FY2012
LEHIGH COUNTY AUTHORITY FINANCIAL STATEMENTS NOVEMBER 2018
 FINANCIAL STATEMENTS FINANCIAL STATEMENTS SUMMARY MONTH YEARTODATE FULL YEAR Actual Forecast FC Var Actual Forecast FC Var Forecast Budget Variance Income Statement 31,329 (55,500) 86,829 Suburban Water
General Manager s Report January 2018
 General Manager s Report January 2018 Lyttonsville Crew Working on Water Main Break January 2018 Table of Contents Customer Service Call Center Operations Percent of Calls Answered... 1 Delinquent Accounts...
Toronto Water Budget BU Recommended Operating Budget Recommended Capital Plan 2017 Recommended Water Rate
 2017 BU25.1 Toronto Water Budget 2017 Recommended Operating Budget 2017 2026 Recommended Capital Plan 2017 Recommended Water Rate Lou Di Gironimo, General Manager, Toronto Water Budget Committee, November
NORTH HUNTINGDON TOWNSHIP MUNICIPAL AUTHORITY
 NORTH HUNTINGDON TOWNSHIP MUNICIPAL AUTHORITY T a p p i n g F e e C a l c u l a t i o n A p r i l 2 0 1 8 5 1 7 3 C A M P B E L L S R U N R O A D P I T T S B U R G H, P A 1 5 2 0 5-9 7 3 3 Table of Contents
Final Report Water and Sewer Rate Model Town of Denton, MD
 Final Report Water and Sewer Rate Model Town of Denton, MD January 30, 2014 MCET Water and Sewer Rate Model for Denton, MD Page 1 Table of Contents Water and Sewer Rate Model Study Town of Denton, MD January
Cash & Liquidity The chart below highlights CTA s cash position at July 2016 compared to July 2015.
 To: Chicago Transit Authority Board From: Jeremy Fine, Chief Financial Officer Re: Financial Results for July 2016 Date: September 14, 2016 I. Summary CTA s financial results are $0.4 million favorable
Financial Report - FY 2017 Year to Date May 31, 2017
 Financial Report - FY 2017 Year to Date July 19, 2017 1 Major Highlights Revenue Sales tax remittances received through YTD April 2017 are 4.2% higher than YTD April 2016 Plaza Saltillo lease income budgeted
Review of Membership Developments
 RIPE Network Coordination Centre Review of Membership Developments 7 October 2009/ GM / Lisbon http://www.ripe.net 1 Applications development RIPE Network Coordination Centre 140 120 100 80 60 2007 2008
Accountant s Compilation Report
 Tel: 817-738-2400 Fax: 817-738-1995 www.bdo.com 6050 Southwest Blvd, Suite 300 Fort Worth, TX 76109 Accountant s Compilation Report Joseph Portugal Town Administrator Town of Westover Hills, Texas Management
February 2016 Financial Report
 2016 February 2016 Financial Report Capital Metropolitan Transportation Authority 4/13/2016 Table of Contents SUMMARY REPORT Budgetary Performance - Revenue 2 - Sales Tax Revenue 5 - Operating Expenses
Detroit Water and Sewerage Department
 Detroit Water and Sewerage Department Briefing to GLWA Board DWSD Water and Sewer Rate Setting - A Historical Perspective ADDITIONAL BACKGROUND MATERIAL March 5, 2015 Sewer Rate Settlement Agreements and
GROUNDWATER REDUCTION PLAN MONTHLY OPERATIONS REPORT MONTH REPORTED: DECEMBER, 2018
 [Type here] GROUNDWATER REDUCTION PLAN MONTHLY OPERATIONS REPORT MONTH REPORTED: DECEMBER, 2018 FY 2019 - Operating Actual vs. Budgeted FYTD 2019 - Key Performance Indicators Actual Budgeted % Variance
SCHEDULE and 2019 Budget Assumptions
 SCHEDULE 3.4 2018 and 2019 Budget Assumptions 1 2018-19 Budgets Assumptions 2 3 The following assumptions were used by EGNB in the development of its 2018 and 2019 Budgets: 4 5 Budget Item Assumption 6
HIPIOWA - IOWA COMPREHENSIVE HEALTH ASSOCIATION Unaudited Balance Sheet As of July 31
 Unaudited Balance Sheet As of July 31 Total Enrollment: 407 Assets: Cash $ 9,541,661 $ 1,237,950 Invested Cash 781,689 8,630,624 Premiums Receivable 16,445 299,134 Prepaid 32,930 34,403 Assessments Receivable
HIPIOWA - IOWA COMPREHENSIVE HEALTH ASSOCIATION Unaudited Balance Sheet As of January 31
 Unaudited Balance Sheet As of January 31 Total Enrollment: 371 Assets: Cash $ 1,408,868 $ 1,375,117 Invested Cash 4,664,286 4,136,167 Premiums Receivable 94,152 91,261 Prepaid 32,270 33,421 Assessments
WATER POLLUTION CONTROL
 WATER POLLUTION CONTROL WATER POLLUTION CONTROL NARRATIVE City of Warrensburg Water Pollution Control Division is under the supervision of the Public Works Department. The Administration budget includes
SUBJECT: Financial Statement and Fund Analysis for November & December 2006
 TAMPA WATER Supplying Water To The Region AGENDA ITEM IS DATE: February 1, 27 TO: J etr y L. Maxwell, General Manager FROM: Koni M. Cassini, Director of Finance and Administration" SUBJECT: Financial Statement
MIAMI PARKING AUTHORITY
 Revenue & Expenses Summary For the Five Months Ending February 28, 2019 Page 1 Adopted FY 2018 Actual Actual Actual Budget Actual Versus FY 2018 Versus 2019 Budget Year-To-Date $ $ $ $ % $ % Operating
Washington State Health Insurance Pool Treasurer s Report February 2018 Financial Review
 Washington State Health Insurance Pool Treasurer s Report February 2018 Financial Review 1. 2017 Interim III Assessment Required An assessment of $8.5 M was required to adequately fund the pool until the
WATER, WASTEWATER, AND RECLAIMED WATER RATE STUDY Public Meeting to Review Study Results. January 5, 2016
 WATER, WASTEWATER, AND RECLAIMED WATER RATE STUDY Public Meeting to Review Study Results January 5, 2016. Public Resources Management Group, Inc. Utility, Rate, Financial and Management Consultants Utility
Statement of Revenues, Expenses, and Changes in Net Position (Income Statement) Page 4
 Page 4") M E M O R A N D U M EUGENE WATER & ELECTRIC BOARD TO: FROM: DATE: August 26, 2016 SUBJECT: OBJECTIVE: Commissioners Simpson, Helgeson, Manning, Mital and Brown Sue Fahey, CFO; Susan Eicher, Accounting
M E M O R A N D U M EUGENE WATER & ELECTRIC BOARD TO: FROM: DATE: August 26, 2016 SUBJECT: OBJECTIVE: Commissioners Simpson, Helgeson, Manning, Mital and Brown Sue Fahey, CFO; Susan Eicher, Accounting
DISTRICT OF COLUMBIA WATER AND SEWER AUTHORITY
 DC Retail Water and Sewer Rates Committee - 1. Call to Order - Alan Roth, Chairman DISTRICT OF COLUMBIA WATER AND SEWER AUTHORITY Board of Directors DC Retail Water and Sewer Rates Committee Tuesday November
Washington State Health Insurance Pool Treasurer s Report January 2018 Financial Review
 Washington State Health Insurance Pool Treasurer s Report January 2018 Financial Review 1. 2017 Interim III Assessment Required An assessment of $8.5 M was required to adequately fund the pool until the
Executive Summary. July 17, 2015
 Executive Summary July 17, 2015 The Revenue Estimating Conference adopted interest rates for use in the state budgeting process. The adopted interest rates take into consideration current benchmark rates
Washington State Health Insurance Pool Treasurer s Report September 2018 Financial Review
 Washington State Health Insurance Pool Treasurer s Report September 2018 Financial Review 1. 2018 Interim III Assessment Required An assessment of $8.5 M was required to adequately fund the pool until
Washington State Health Insurance Pool Treasurer s Report March 2018 Financial Review
 Washington State Health Insurance Pool Treasurer s Report March 2018 Financial Review 1. 2017 Interim III Assessment Required An assessment of $8.5 M was required to adequately fund the pool until the
Washington State Health Insurance Pool Treasurer s Report April 2018 Financial Review
 Washington State Health Insurance Pool Treasurer s Report April 2018 Financial Review 1. 2018 Interim I Assessment Required An assessment of $7.0 M is required to adequately fund the pool until the next
a b c d (c-b) Sept 30, 2015 Cash Balance
 Sept 30, 2015 Cash Balance") Staff Report To: From: Mayor John Muhlfeld and City Councilors Dana Smith, Finance Director Date: October 29, 2017 Re: 1st Quarter Financial Report for Fiscal Year 2018 This quarterly financial report
Staff Report To: From: Mayor John Muhlfeld and City Councilors Dana Smith, Finance Director Date: October 29, 2017 Re: 1st Quarter Financial Report for Fiscal Year 2018 This quarterly financial report
METRO. Fiscal Year Monthly Performance Report. Revenue Expense Ridership Performance. November 2018 (Third Quarter Fiscal Year-to Date)
") METRO Fiscal Year 2019 Monthly Performance Report Revenue Expense Ridership Performance (Third Quarter Fiscal Year-to Date) 12/12/2018 Table of Contents Section A Section B Section C Section D Section
METRO Fiscal Year 2019 Monthly Performance Report Revenue Expense Ridership Performance (Third Quarter Fiscal Year-to Date) 12/12/2018 Table of Contents Section A Section B Section C Section D Section
QUARTERLY FINANCIAL REPORT June 30, 2017
 California Independent System Operator QUARTERLY FINANCIAL REPORT June 30, 2017 250 Outcropping Way Folsom, CA 95630 (916) 351-4000 CALIFORNIA INDEPENDENT SYSTEM OPERATOR CORPORATION QUARTERLY FINANCIAL
METRO. Fiscal Year 2013 Monthly Board Report. November 2012
 METRO Fiscal Year 2013 Monthly Board Report Revenue Expense Ridership Performance 12/13/2012 Table of Contents Section A Section B Section C Section D Section E Section F Section G Section H Section I
CPA Australia Plan Your Own Enterprise Competition
 Financial Plan Your financial plan should include: 1. A list of Start-Up Costs and how these will be paid for (eg from savings, bank loan or family loan) 2. A Breakeven Analysis, which includes: a list
NPDES compliance summary report, fiscal year Massachusetts Water Resources Authority Environmental Quality, Water and Wastewater Report
 NPDES compliance summary report, fiscal year 2016 Massachusetts Water Resources Authority Environmental Quality, Water and Wastewater Report 2016-17 Citation: Pacheco, N. 2017. NPDES compliance summary
Using projections to manage your programs
 Using projections to manage your programs To project total provider reimbursements To do what ifs based on caseloads or other metrics To project amounts of admin & support available for spending Based
FUEL PRICE RISK MANAGEMENT POLICY REPORT "FUEL HEDGE"
 FUEL PRICE RISK MANAGEMENT POLICY REPORT "FUEL HEDGE" Sep-18 FUEL PRICE RISK MANAGEMENT POLICY REPORT Sep-18 (Office of Management and Budget 09/30/2018) The Fuel Price Risk Management Policy approved
FUEL PRICE RISK MANAGEMENT POLICY REPORT "FUEL HEDGE"
 FUEL PRICE RISK MANAGEMENT POLICY REPORT "FUEL HEDGE" December 2018 FUEL PRICE RISK MANAGEMENT POLICY REPORT December 2018 The Fuel Price Risk Management Policy approved by the Board on February 16, 2006
 ENCINA WASTEWATER AUTHORITY Key Performance Indicators FY2019 August 31, 2018 Encina Water Pollution Control Facility These key performance indicators illustrate various aspects of the EWA's operations
METRO. Fiscal Year Monthly Performance Report. Revenue Expense Ridership Performance. February 2018 (First Quarter Fiscal Year-to Date)
") METRO Fiscal Year 2018 Monthly Performance Report Revenue Expense Ridership Performance (First Quarter Fiscal Year-to Date) 3/12/2018 Table of Contents Section A Section B Section C Section D Section E
METRO Fiscal Year 2018 Monthly Performance Report Revenue Expense Ridership Performance (First Quarter Fiscal Year-to Date) 3/12/2018 Table of Contents Section A Section B Section C Section D Section E
GROUNDWATER REDUCTION PLAN MONTHLY OPERATIONS REPORT
 GROUNDWATER REDUCTION PLAN MONTHLY OPERATIONS REPORT GRP REVIEW COMMITTEE MEETING OCTOBER 22, 2018 SJRA BOARD MEETING OCTOBER 25, 2018 TABLE OF CONTENTS Table of Contents 1 Acronyms and Defini ons 2 1.0
Washington State Health Insurance Pool Treasurer s Report January 2017 Financial Review
 Washington State Health Insurance Pool Treasurer s Report January 2017 Financial Review 1. 2016 Interim III Assessment Required An assessment of $8.5 M is required to adequately fund the pool until the
METRO. Fiscal Year 2012 Monthly Board Report. December 2011 (First Quarter Fiscal Year-to-Date)
") METRO Fiscal Year 2012 Monthly Board Report Revenue Expense Ridership Performance (First Quarter Fiscal Year-to-Date) 1/27/2012 Table of Contents Section A Section B Section C Section D Section E Section
METRO Fiscal Year 2012 Monthly Board Report Revenue Expense Ridership Performance (First Quarter Fiscal Year-to-Date) 1/27/2012 Table of Contents Section A Section B Section C Section D Section E Section
Washington State Health Insurance Pool Treasurer s Report August 2017 Financial Review
 Washington State Health Insurance Pool Treasurer s Report August 2017 Financial Review 1. 2017 Interim I Assessment Required An assessment of $9.5 M was required to adequately fund the pool until the next
SIGNIFICANT BUDGET CHANGES
 Department of Environmental Services Our Mission: To build and maintain water delivery, sanitary sewer collection, and wastewater treatment systems that provide high-quality water and sewer services and
Washington State Health Insurance Pool Treasurer s Report December 2017 Financial Review
 Washington State Health Insurance Pool Treasurer s Report December 2017 Financial Review 1. 2017 Interim III Assessment Required An assessment of $8.5 M is required to adequately fund the pool until the
City of Milton 4th Qtr Financial Report
 1 TO: CC: FROM: Debra Perry, Mayor Milton City Council City Administrator Department Directors Lisa Tylor, Finance Director DATE: March 17, 2014 SUBJECT: - Fourth Quarter/Year-End Financial Status Report
TERMS OF REFERENCE FOR THE INVESTMENT COMMITTEE
 I. PURPOSE The purpose of the Investment Committee (the Committee ) is to recommend to the Board the investment policy, including the asset mix policy and the appropriate benchmark for both ICBC and any
XML Publisher Balance Sheet Vision Operations (USA) Feb-02
 Feb-02") Page:1 Apr-01 May-01 Jun-01 Jul-01 ASSETS Current Assets Cash and Short Term Investments 15,862,304 51,998,607 9,198,226 Accounts Receivable - Net of Allowance 2,560,786
Page:1 Apr-01 May-01 Jun-01 Jul-01 ASSETS Current Assets Cash and Short Term Investments 15,862,304 51,998,607 9,198,226 Accounts Receivable - Net of Allowance 2,560,786
San Antonio Water System
 CONDENSED MONTHLY FINANCIAL REPORT December 2018 San Antonio, Texas CONDENSED MONTHLY FINANCIAL REPORT SAN ANTONIO WATER SYSTEM DECEMBER 31, 2018 Attached is the monthly financial report of the (SAWS)
Operating Budget. Third Quarter Financial Report (July 2005 March 2006)
") Third Quarter Financial Report (July 2005 March 2006) INDEX A. Executive Summary...page 2 B. Revenue and Expense Analysis...page 3 C. Budget Variance Reports...page 14 D. Ridership and Performance Measures...page
Third Quarter Financial Report (July 2005 March 2006) INDEX A. Executive Summary...page 2 B. Revenue and Expense Analysis...page 3 C. Budget Variance Reports...page 14 D. Ridership and Performance Measures...page
ORANGE WATER AND SEWER AUTHORITY SCHEDULE OF RATES, FEES, AND CHARGES APPLICABLE TO ALL BILLINGS AND SERVICES ON AND AFTER OCTOBER 1, 2017
 APPLICABLE TO ALL BILLINGS AND SERVICES ON AND AFTER OCTOBER 1, 2017 Page SECTION I: SCHEDULE OF WATER RATES AND FEES... 2 SECTION II: SCHEDULE OF SEWER RATES AND FEES... 8 SECTION III: SCHEDULE OF RECLAIMED
THE B E A CH TO WN S O F P ALM B EA CH
 THE B E A CH TO WN S O F P ALM B EA CH C OU N T Y F LO R I D A August www.luxuryhomemarketing.com PALM BEACH TOWNS SINGLE-FAMILY HOMES LUXURY INVENTORY VS. SALES JULY Sales Luxury Benchmark Price : 7,
Charlotte County Airport Authority BUDGET WORKSHOP AGENDA August 2, :00 A.M. Punta Gorda Airport
 Authority Commissioners James Herston, Chair Robert D. Hancik, A.A.E., Vice-Chair Kathleen Coppola, Secretary/Treasurer Paul Andrews, Asst. Secretary/Treasurer Pam Seay, Commissioner C CEO James W. Parish,
Kirkwood Meadows Public Utility District Finance Committee REGULAR MEETING NOTICE
 Kirkwood Meadows Public Utility District Finance Committee REGULAR MEETING NOTICE NOTICE IS HEREBY GIVEN that the Finance Committee of the Kirkwood Meadows Public Utility District has called a Special
Capital Region Water Proposed 2019 Budget and Rates. November 20, 2018
 Capital Region Water Proposed 2019 Budget and Rates November 20, 2018 Road Map Successes to Date and Challenges Ahead Budget and Rate Setting Process Proposed 2019 Budgets and Rates Questions and Comments
Village of Oak Park, IL Department of Finance. Quarterly Finance and Performance Report 2016, 1st Quarter
 Village of Oak Park, IL Department of Finance Quarterly Finance and Performance Report 2016, 1st Quarter May, 2016 Table of Contents Section 1: Introduction... 3 Section 2: 1 st Quarter Financial Report
Re: Project No Pacific Northern Gas (N.E.) Ltd Revenue Requirements Application Update for Fort St. John/Dawson Creek Division
 Ltd Revenue Requirements Application Update for Fort St. John/Dawson Creek Division") B-7 Craig P. Donohue Director, Regulatory Affairs & Gas Supply Pacific Northern Gas Ltd. Suite 950 1185 West Georgia Street Vancouver, BC V6E 4E6 Tel: (604) 691-5673 Tel: (604) 697-6210 Email: cdonohue@png.ca
B-7 Craig P. Donohue Director, Regulatory Affairs & Gas Supply Pacific Northern Gas Ltd. Suite 950 1185 West Georgia Street Vancouver, BC V6E 4E6 Tel: (604) 691-5673 Tel: (604) 697-6210 Email: cdonohue@png.ca
METRO. Fiscal Year 2013 Monthly Board Report. December 2012 (First Quarter Fiscal Year-to-Date)
") METRO Fiscal Year 2013 Monthly Board Report Revenue Expense Ridership Performance (First Quarter Fiscal Year-to-Date) 1/14/2013 Table of Contents Section A Section B Section C Section D Section E Section
METRO Fiscal Year 2013 Monthly Board Report Revenue Expense Ridership Performance (First Quarter Fiscal Year-to-Date) 1/14/2013 Table of Contents Section A Section B Section C Section D Section E Section
Water Consultancy. Montecito Sanitary District Wastewater Rate Study Report. Montecito Sanitary District
 3585 Maple Street, Suite 250 Ventura, CA 93003 805-404-1467 Montecito Sanitary District Wastewater Rate Study Report March 2016 Montecito Sanitary District 1042 Monte Cristo Lane Santa Barbara CA 93108
Washington State Health Insurance Pool Treasurer s Report November 2014 Financial Review
 Washington State Health Insurance Pool Treasurer s Report November 2014 Financial Review 1. 2014 Interim III and 2013 Final True-up Assessment Required An assessment of $2.0 M is required in order to adequately
Comprehensive Monthly Financial Report July 2013
 Comprehensive Monthly Financial Report July 2013 MONTHLY FINANCIAL REPORT PERFORMANCE AT A GLANCE ALL FUNDS SUMMARY GENERAL FUND REV VS EXP PROPERTY TAXES SALES TAXES FRANCHISE FEES UTILITY FUND REV VS
CITY OF DETROIT, MICHIGAN_Sewage Disposal System Revenue
 CITY OF DETROIT, MICHIGAN_Sewage Disposal System Revenue MICHIGAN FINANCE AUTHORITY, Local Government Loan Program Revenue Bonds, Series 2014C 1 (Detroit Water and Sewerage Department Sewage Disposal System
Town Hall Meeting Community Utilities of Indiana, Inc. Wednesday, Wednesday 29, :00PM - 8:00PM at Seasons Lakehouse 1048 N.
 Town Hall Meeting Community Utilities of Indiana, Inc. Wednesday, Wednesday 29, 2018 7:00PM - 8:00PM at Seasons Lakehouse 1048 N. Lakeshore Drive, Crown Point, Indiana Community Utilities of Indiana, Inc.
City of Joliet 2014 Revenue Review. October 2013
 City of Joliet 2014 Revenue Review October 2013 General Fund 2014 Est. Revenues = $163.6 M Licenses, Permits, Fees Gaming Taxes 5% 12% Sales Taxes 27% Income Taxes 9% Charges for Services 14% Other Taxes
Operating Budget. Second Quarter Financial Report
 Second Quarter Financial Report INDEX A. Executive Summary... A-1 B. Revenue and Expense Analysis... B-1 C. Budget Variance Reports... C-1 D. Ridership and Performance Measures... D-1 Board Budget Committee
Official Budget. Fiscal Year 2011
 Official Budget Fiscal Year 2011 Adopted, December 10, 2010 Colorado Centree Metropolitan District 4770 Horizonview Drive, Colorado Springs, Colorado 80925 Telephone: 719-390-7000 ; Facsimile: 719-390-3709
$180 $160 $140 $120 $100 $80 $60 $40 $20 $ Single Fam -New Apts -New
 2012 REVENUE FORECAST Presented by Brian Henshaw September 26, 2011 1 Economic Conditions Housing starts Federal & State deficits Sovereign-debt crisis Bankruptcies Unemployment Stock Market volatility
Toronto Water Budget. Toronto Water Budget. Water. Recommended. Lou Di Gironimo General Managou Di Gironi. Budget Committee.
 2016 Toronto Water Budget Toronto Water Budget 2016 2016 Recommended Recommended Ope Opearting 2016 Recommned2016 Budget Operating 2016 2025 2016-2025 Budget Recommended rating Recommended Budget Capital
Capital Region Water. Water and Wastewater Rate Study Report. November 22, Capital Region Water Water and Wastewater Rate Study
 Capital Region Water Water and Wastewater Rate Study Report November 22, 2017 Capital Region Water Water and Wastewater Rate Study TABLE OF CONTENTS 1. INTRODUCTION...1 1.1 RATE STUDY SCOPE AND OBJECTIVES...1
2014 Fixed Income Investor Update
 2014 Fixed Income Investor Update Toronto April 23, 2014 Montreal April 24, 2014 Winnipeg April 28, 2014 Disclaimer Certain information included in this presentation or incorporated by reference herein
METRO. Fiscal Year Monthly Performance Report. Revenue Expense Ridership Performance. May 2018 (Second Quarter Fiscal Year-to Date)
") METRO Fiscal Year 2018 Monthly Performance Report Revenue Expense Ridership Performance (Second Quarter Fiscal Year-to Date) 6/12/2018 Table of Contents Section A Section B Section C Section D Section
METRO Fiscal Year 2018 Monthly Performance Report Revenue Expense Ridership Performance (Second Quarter Fiscal Year-to Date) 6/12/2018 Table of Contents Section A Section B Section C Section D Section
Operating Budget Stability
 Operating Budget Stability March Financial Update Report to Agenda Executive Summary March Performance Against FY16 Budget March Performance Against Same Period Last Year Appendix Financial Detail: March
FY 2013/14 Proposed Operating Budget
 FY 2013/14 Proposed Operating Budget Napa Sanitation District Board of Directors Meeting May 1, 2013 1 Presentation Outline Budget Directives Revenues Operating Expenses 10-Year Forecast 2 Presentation
From: Lex Warmath and Elaine Conti, Raftelis Financial Consultants, Inc.
 227 West Trade Street Phone 704 373 1199 www.raftelis.com Suite 1400 Fax 704 373 1113 Charlotte, NC 28202 Date: June 21, 2016 To: Mr. Bob Walker, Executive Director From: Lex Warmath and Elaine Conti,
SmallBizU WORKSHEET 1: REQUIRED START-UP FUNDS. Online elearning Classroom. Item Required Amount ($) Fixed Assets. 1 -Buildings $ 2 -Land $
 Fixed Assets. 1 -Buildings $ 2 -Land $") WORKSHEET 1: REQUIRED START-UP FUNDS Item Required Amount () Fixed Assets 1 -Buildings 2 -Land 3 -Initial Inventory 4 -Equipment 5 -Furniture and Fixtures 6 -Vehicles 7 Total Fixed Assets Working Capital
WORKSHEET 1: REQUIRED START-UP FUNDS Item Required Amount () Fixed Assets 1 -Buildings 2 -Land 3 -Initial Inventory 4 -Equipment 5 -Furniture and Fixtures 6 -Vehicles 7 Total Fixed Assets Working Capital