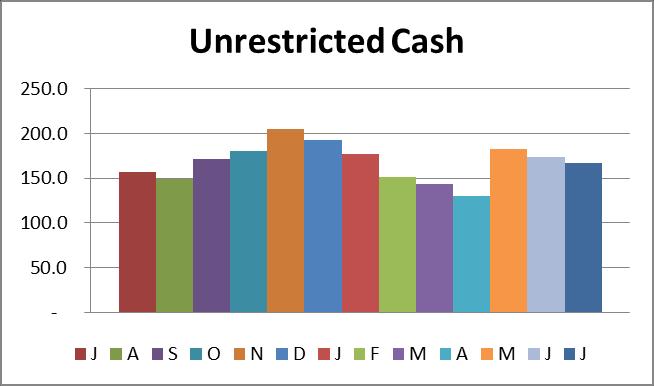
Cash & Liquidity The chart below highlights CTA s cash position at July 2016 compared to July 2015.
|
|
|
- Shanon Lane
- 6 years ago
- Views:
Transcription

1 To: Chicago Transit Authority Board From: Jeremy Fine, Chief Financial Officer Re: Financial Results for July 2016 Date: September 14, 2016 I. Summary CTA s financial results are $0.4 million favorable for July primarily due to lower than anticipated operating expenses. The year to date is $2.6 million favorable to budget primarily due to lower operating expenses. Ridership for the month was 40.9 million and was 2.9 million less than budget. Ridership was 3.9 million or 8.8% less than July 2015 due to better timing of the Fourth of July in 2015 and continued tourist activities after the holiday weekend for Grateful Dead farewell concerts. Also, low gas prices and downtown construction were contributing factors. There were also two fewer weekdays, one more Saturday and one more Sunday this year. The year to date is less than budget and prior year by 10.4 million and 8.6 million, respectively. II. Cash & Liquidity The chart below highlights CTA s cash position at July 2016 compared to July July July Increase (Decrease) Unrestricted Cash $ $ $ 10.3 Damage Reserve $ 4.0 Funds Owed by RTA $ 49.6 Trust Portfolio Assets $ (172.5) Total Cash and Receivables $ $ 1,019.7 $ (108.6) CTA s total cash/receivables balance was equal to $0.9 billion. Unrestricted cash was $10.3 million more than the prior year due to timing of cash receipts and invoice payments. The Damage Reserve is sufficiently funded and was $4.0 million higher than last year reflecting payouts for settled claims. Funds owed by the RTA were approximately $333.6 million which was $49.6 million more than the prior year. CTA continues to work closely with the RTA to monitor their receivable balance owed; Trust Portfolio Assets represents bond proceeds held in Trust for funding capital projects and making required debt service payments and therefore goes down when payments are made. 1
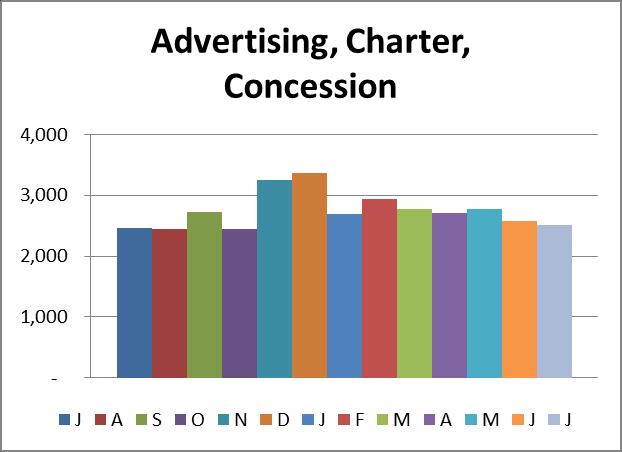
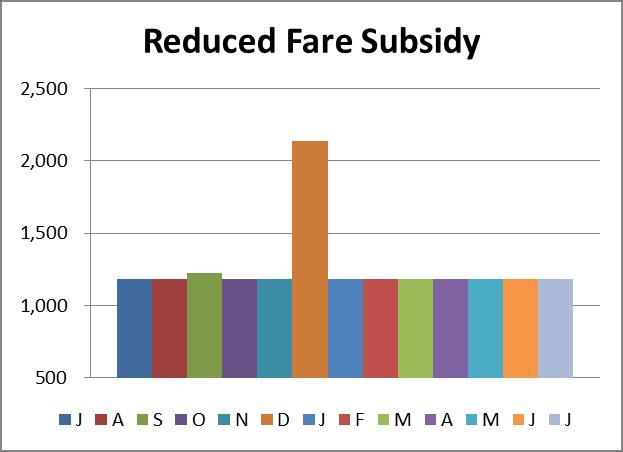
2 III. Revenue Fare & Pass Revenue $ 51,376 $ (2,091) $ (3,163) $ 335,488 $ (5,474) $ (3,186) Fare and pass revenue for July was $2.1 million unfavorable to budget and $3.2 million unfavorable to prior year. The unfavorable variance to budget and prior year was due to very strong pay-per-use ridership in the first-half of July 2015 that did not repeat in July 2015 had a better timing of Fourth of July, and continued tourist activities after the holiday weekend for Grateful Dead farewell concerts. The average fare for the month was $1.26 and was $0.04 higher than budget and $0.04 more than prior year. Year-to-date fare and pass revenue was $5.5 million lower than budget and $3.2 million lower compared to prior year. The unfavorable variance to budget is mainly due to lower than anticipated bus pay-per-use revenues in the second quarter of The negative variance to prior year is due to lower bus and rail pay-per-use ridership in July. The average fare for the year was $1.16 per ride and was $0.03 more than budget. Reduced Fare Subsidy $ 1,180 $ (1,180) $ - $ 8,261 $ (8,261) $ 1,000 Reduced Fare Subsidy was less than budget for the month and year-to-date by $1.2 million and $8.3 million based on expected reimbursements from the State. Advertising, Charter, Concession $ 2,516 $ 39 $ 55 $ 18,971 $ 621 $ 1,958 Advertising, Charter and Concessions Revenue was slightly higher than budget for the month due to higher concessions revenue and was $0.6 million more than budget year-todate due to higher vehicle and platform advertising. The increase over prior year-to-date was also mainly due to higher vehicle and platform advertising. 2
3 Investment income $ 166 $ 92 $ 68 $ 1,064 $ 549 $ 147 Investment income was higher than budget for the month primarily due to a higher yielding portfolio and a better investment strategy through security selection. The year-to-date was favorable to budget due to higher short-term market rates. Other Revenue $ 3,119 $ 708 $ 593 $ 20,574 $ 5,582 $ 954 Other Revenue was favorable to prior year and budget due to higher non-capital grant revenue. The year to date was favorable to budget and prior year primarily due to the sale of surplus property. Total System Generated Revenue $ 58,356 $ (2,432) $ (2,447) $ 384,357 $ (6,983) $ 874 Total System-Generated Revenue was $2.4 million less than budget and prior year for the month due to lower reduced fare subsidy and fare and pass revenue. The year-to-date is $7.0 million less than budget due to lower reduced fare subsidy. The year-to-date systemgenerated revenue is $0.9 million more than prior year due to higher advertising revenue and sale of surplus property. IV. Expenses Labor $ 81,953 $ (270) $ 2,586 $ 594,272 $ (960) $ (21,588) Labor expense was $0.3 million unfavorable to budget for the month due to higher than anticipated unscheduled work and overtime. Contractual wage increases that took effect in July 2015 and slightly higher fringe benefits in 2016 contributed to higher expenses compared to the prior 2015 year-to-date. 3
4 Material $ 6,528 $ 504 $ 961 $ 48,579 $ 881 $ 139 Material expense was favorable to budget for the month and prior year. The year to date is $0.9 million favorable to budget due to lower than planned vehicle maintenance. Fuel $ 2,505 $ 597 $ 1,779 $ 18,774 $ 2,737 $ 11,017 Fuel for Revenue Equipment expense was $0.6M favorable to budget in July and $2.7M favorable year-to-date, primarily due to lower consumption and prices that were locked in lower than budgeted. Fuel expense is $1.8 million and $11 million favorable compared to prior July and to 2015 year-to-date, respectively, mainly due to significant reduction in the price of diesel fuel, lower usage and an increase in fuel efficiency. Power $ 2,337 $ 311 $ (18) $ 17,072 $ 1,647 $ 104 The Electric Power for Revenue Equipment expense was $0.3 million favorable to budget due to lower prices and lower consumption. Year-to-date, expenses are $1.6 million under budget, primarily due to favorable prices. Purchase of Security Services $ 879 $ 346 $ 322 $ 8,116 $ 457 $ 214 Purchase of Security Services was favorable to budget for the month and year to date by $0.3 million and $0.5 million, respectively, due to timing of invoices. 4
5 Other Expenses $ 21,009 $ 1,312 $ (2,626) $ 156,005 $ 4,843 $ 928 Other Expenses were favorable to budget by $1.3 million due to the timing of contractual expenses. The unfavorable variance to prior year was mainly due to new debt service and timing of invoices. Of the total monthly other expenses, the pension obligation bond expense is $9 million; the remaining expenses are for utilities, maintenance contracts, services, and other expenses. Total Operating Expenses $ 115,210 $ 2,800 $ 3,004 $ 847,569 $ 9,607 $ (13,937) Operating Expenses were $2.8 million favorable to budget for the month due to favorability in material, fuel and other expense categories. The unfavorable variance to prior year-todate was due primarily to higher labor expense. V. Recovery Ratio Recovery Ratio 60.82% (1.03) 54.30% (0.21) VI. Recovery Ratio, which measures the percentage of operating expenses CTA funds from internally generated revenues, was 60.82% for the month. This was unfavorable to budget by 1.03 percentage points. For the year-to-date the recovery ratio is 54.30%. Ridership Bus 20,368 (1,743) (2,533) 151,558 (8,546) (8,579) Rail 16,814 (920) (1,164) 113,365 (1,552) (11) Rail to Rail Transfers 3,704 (207) (245) 25,233 (318) (3) Total 40,886 (2,871) (3,942) 290,156 (10,416) (8,593) 5
6 Ridership for the month of July was 40.9 million and was lower than budget and prior year by 2.9 million and 3.9 million, respectively. Calendar adjusted ridership was down 6.0% from prior year due to special events in 2015, low gas prices and downtown construction. There were also two fewer weekdays, one more Saturday and one more Sunday this year. Ridership for the year-to-date was million and was 10.4 million less than budget and was 8.6 million lower than the prior year-to-date. Calendar adjusted ridership was down 3.0% from the prior year-to-date. More details on ridership can be found in the July Ridership Report. 6


7 Cash 7

8 Cash Cont d Revenue 8

9 Revenue Cont d 9


10 Revenue Cont d 10


11 Expenses 11
12 Cash Category Jul-15 Aug-15 Sep-15 Oct-15 Nov-15 Dec-15 Jan-16 Feb-16 Mar-16 Apr-16 May-16 Jun-16 Jul-16 Unrestricted Cash Damage Reserve Funds Owed by RTA Trust Portfolio Assets Revenue Category Jul-15 Aug-15 Sep-15 Oct-15 Nov-15 Dec-15 Jan-16 Feb-16 Mar-16 Apr-16 May-16 Jun-16 Jul-16 Fare & Pass Revenue 54,539 51,825 51,736 52,286 47,247 45,339 44,877 43,918 49,680 45,982 48,827 50,829 51,376 Reduced Fare Subsidy 1,180 1,180 1,224 1,180 1,180 2,136 1,180 1,180 1,180 1,180 1,180 1,180 1,180 Advertising, Charter, Concession 2,461 2,440 2,726 2,445 3,251 3,366 2,698 2,935 2,775 2,701 2,768 2,578 2,516 Investment Income (222) Statutory Required Contribution 2,000 3,000 Other Revenue 2,526 2,545 2,534 2,514 2,867 6,255 1,926 3,497 2,604 4,975 2,287 2,165 3,119 Total System Generated Revenue 60,803 58,118 58,352 60,547 57,591 56,875 50,821 51,669 56,395 54,979 55,228 56,909 58,356 Total Public Funding 57,411 59,502 61,411 59,352 55,347 68,786 69,099 68,343 73,061 65,885 61,619 68,350 56,854 Expense Category Jul-15 Aug-15 Sep-15 Oct-15 Nov-15 Dec-15 Jan-16 Feb-16 Mar-16 Apr-16 May-16 Jun-16 Jul-16 Labor 84,539 83,886 83,913 88,024 81,340 87,639 83,998 84,197 89,550 84,268 83,416 86,891 81,953 Material 7,488 6,612 7,455 6,356 5,684 8,682 6,451 6,433 7,850 7,325 6,268 7,725 6,528 Fuel 4,284 4,084 4,134 4,116 3,619 4,086 2,625 2,766 3,046 2,435 2,303 3,094 2,505 Power 2,319 2,364 2,535 2,403 1,863 2,477 3,102 2,761 2,190 2,173 2,150 2,360 2,337 Provision Injuries & Damages 3,500 2,375 2,375 Purchase of Security Services 1,200 1,211 1,201 1,201 1,184 1,303 1,202 1,064 1,251 1,231 1,235 1, Other Expenses 18,383 19,463 20,526 17,798 19,249 17,974 22,541 22,792 23,195 23,432 21,475 21,561 21,009 Total Operating Expenses 118, , , , , , , , , , , , ,210
The year to date is less than budget and prior year by 15.4 million and 11.6 million, respectively.
 To: Chicago Transit Authority Board From: Jeremy Fine, Chief Financial Officer Re: Financial Results for September 2016 Date: November 16, 2016 I. Summary CTA s financial results are $0.3 million unfavorable
Cash & Liquidity The chart below highlights CTA s cash position at September 2017 compared to September 2016.
 To: Chicago Transit Authority Board From: Jeremy Fine, Chief Financial Officer Re: Financial Results for September 2017 Date: November 15, 2017 I. Summary CTA s financial results are $7.7 million favorable
Cash & Liquidity The chart below highlights CTA s cash position at December 2017 compared to December 2016.
 To: Chicago Transit Authority Board From: Jeremy Fine, Chief Financial Officer Re: Financial Results for December 2017 Date: February 14, 2018 I. Summary CTA s financial results are $4.7 million favorable
Cash & Liquidity The chart below highlights CTA s cash position at February 2017 compared to February 2016.
 To: Chicago Transit Authority Board From: Jeremy Fine, Chief Financial Officer Re: Financial Results for February 2017 Date: April 5, 2017 I. Summary CTA s financial results are $0.3 million favorable
Cash & Liquidity The chart below highlights CTA s cash position at March 2017 compared to March 2016.
 To: Chicago Transit Authority Board From: Jeremy Fine, Chief Financial Officer Re: Financial Results for March 2017 Date: May 10, 2017 I. Summary CTA s financial results are $0.6 million favorable to budget
Cash & Liquidity The chart below highlights CTA s cash position at March 2018 compared to March 2017.
 To: Chicago Transit Authority Board From: Jeremy Fine, Chief Financial Officer Re: Financial Results for March 2018 Date: May 9, 2018 I. Summary CTA s financial results are $0.9 million favorable to budget
Cash & Liquidity The chart below highlights CTA s cash position at June 2018 compared to June 2017.
 To: Chicago Transit Authority Board From: Jeremy Fine, Chief Financial Officer Re: Financial Results for June 2018 Date: August 15, 2018 I. Summary CTA s financial results are unfavorable to budget for
Cash & Liquidity The chart below highlights CTA s cash position at January 2018 compared to January 2017.
 To: Chicago Transit Authority Board From: Jeremy Fine, Chief Financial Officer Re: Financial Results for January 2018 Date: March 14, 2018 I. Summary CTA s financial results are $1.7 million unfavorable
Cash & Liquidity The chart below highlights CTA s cash position at August 2018 compared to August 2017.
 To: Chicago Transit Authority Board From: Jeremy Fine, Chief Financial Officer Re: Financial Results for August 2018 Date: October 10, 2018 I. Summary CTA s financial results are favorable to budget for
Cash & Liquidity The chart below highlights CTA s cash position at February 2016 compared to February 2015.
 To: Chicago Transit Authority Board From: Jeremy Fine, Chief Financial Officer Re: Financial Results for February 2016 Date: April 6, 2016 I. Summary CTA s financial results are $2.7 million favorable
Cash & Liquidity The chart below highlights CTA s cash position at January 2016 compared to January 2015.
 To: Chicago Transit Authority Board From: Tom McKone, Acting Chief Financial Officer Re: Financial Results for January 2016 Date: March 9, 2016 I. Summary CTA s financial results are $0.8 million unfavorable
Cash & Liquidity The chart below highlights CTA s cash position at February 2015 compared to February 2014.
 To: Chicago Transit Authority Board From: Ron DeNard, Chief Financial Officer Re: Financial Results for February 2015 Date: April 15, 2015 I. Summary CTA s financial results are favorable for the month
Ridership for the month is 39.4 million and is on par with budget. Ridership is 1.4 million or 3.6% higher than January 2014.
 To: Chicago Transit Authority Board From: Ron DeNard, Chief Financial Officer Re: Financial Results for January 2015 Date: March 6, 2015 I. Summary CTA s financial results are $2.0 million favorable for
CTA s financial results are unfavorable by $0.5 million and $1.2 million for the month and year.
 To: Chicago Transit Authority Board From: Ron DeNard, Chief Financial Officer Re: Financial Results for May 2015 Date: July 13, 2015 I. Summary CTA s financial results are unfavorable by $0.5 million and
Cash & Liquidity The chart below highlights CTA s cash position at July 2015 compared to July 2014.
 To: Chicago Transit Authority Board From: Tom McKone, Acting CFO Re: Financial Results for July 2015 Date: September 4, 2015 I. Summary CTA s financial results are favorable by $1.9 million for the month
Cash & Liquidity The chart below highlights CTA s cash position at November 2014 compared to November 2013.
 To: Chicago Transit Authority Board From: Ronald E. DeNard, Chief Financial Officer Re: Financial Results for November 2014 Date: January 12, 2015 I. Summary CTA s financial results are $1.9 million unfavorable
Cash & Liquidity The chart below highlights CTA s cash position at June 2014 compared to June 2013.
 To: Chicago Transit Authority Board From: Ron DeNard, Chief Financial Officer Re: Financial Results for June 2014 Date: August 13, 2014 I. Summary CTA s financial results are $4.0 million favorable for
Cash & Liquidity The chart below highlights CTA s cash position at May 2014 compared to May 2013.
 To: Chicago Transit Authority Board From: Ron DeNard, Chief Financial Officer Re: Financial Results for May 2014 Date: July 16, 2014 I. Summary CTA s financial results are $5.6 million favorable for May
Financial Report - FY 2017 Year to Date May 31, 2017
 Financial Report - FY 2017 Year to Date July 19, 2017 1 Major Highlights Revenue Sales tax remittances received through YTD April 2017 are 4.2% higher than YTD April 2016 Plaza Saltillo lease income budgeted
Operating Budget. Third Quarter Financial Report (July 2005 March 2006)
") Third Quarter Financial Report (July 2005 March 2006) INDEX A. Executive Summary...page 2 B. Revenue and Expense Analysis...page 3 C. Budget Variance Reports...page 14 D. Ridership and Performance Measures...page
Third Quarter Financial Report (July 2005 March 2006) INDEX A. Executive Summary...page 2 B. Revenue and Expense Analysis...page 3 C. Budget Variance Reports...page 14 D. Ridership and Performance Measures...page
FY2014 Operating Budget Performance Report
 Finance & Administration Committee Information Item IV-C September 11, 2014 FY2014 Operating Budget Performance Report Washington Metropolitan Area Transit Authority Board Action/Information Summary Action
BUDGETWATCH October 2018 Flash Report
 October 2018 Flash Report Overall Latest Condition (reporting on operations through September and subsidies through October): Passenger Revenues were slightly below the Forecast in September, marginally
METRO. Fiscal Year 2012 Monthly Board Report. December 2011 (First Quarter Fiscal Year-to-Date)
") METRO Fiscal Year 2012 Monthly Board Report Revenue Expense Ridership Performance (First Quarter Fiscal Year-to-Date) 1/27/2012 Table of Contents Section A Section B Section C Section D Section E Section
METRO Fiscal Year 2012 Monthly Board Report Revenue Expense Ridership Performance (First Quarter Fiscal Year-to-Date) 1/27/2012 Table of Contents Section A Section B Section C Section D Section E Section
Operating Budget Stability
 Operating Budget Stability March Financial Update Report to Agenda Executive Summary March Performance Against FY16 Budget March Performance Against Same Period Last Year Appendix Financial Detail: March
METRO MONTHLY BOARD REPORT
 METRO Revenue Expenses Service Performance Fiscal Year FY2011 Table of Contents Section A Section B Section C Section D Section E Section F Section G Section H Summary Sales Tax Revenue Fare Revenue Operating
METRO. Fiscal Year 2012 Monthly Board Report. September 2012 (Fourth Quarter Fiscal Year-to-Date)
") METRO Fiscal Year 2012 Monthly Board Report Revenue Expense Ridership Performance (Fourth Quarter Fiscal Year-to-Date) This report is based on a preliminary closing of the year-end financials for FY2012
METRO Fiscal Year 2012 Monthly Board Report Revenue Expense Ridership Performance (Fourth Quarter Fiscal Year-to-Date) This report is based on a preliminary closing of the year-end financials for FY2012
Budget Process Overview and Cost Allocation Methodology
 Budget Process Overview and Cost Allocation Methodology 1 Cost Allocation Agreement Guiding Principles Operate a consolidated regional public transportation system within and between the Participating
METRO. Monthly Board Report. June 2006
 METRO Monthly Board Report Operating Capital Service Performance June 26 7/17/26 June 26 MONTHLY BOARD REPORT INDEX Section A Section B Section C Section D Section E Section F Section G Operating Budget
BUDGETWATCH March 2019 Flash Report
 March 2019 Flash Report Overall Latest Condition (reporting on operations through February and subsidies through March): Overall, YTD preliminary net results were favorable mainly reflecting lower operating
METRO. Fiscal Year 2013 Monthly Board Report. December 2012 (First Quarter Fiscal Year-to-Date)
") METRO Fiscal Year 2013 Monthly Board Report Revenue Expense Ridership Performance (First Quarter Fiscal Year-to-Date) 1/14/2013 Table of Contents Section A Section B Section C Section D Section E Section
METRO Fiscal Year 2013 Monthly Board Report Revenue Expense Ridership Performance (First Quarter Fiscal Year-to-Date) 1/14/2013 Table of Contents Section A Section B Section C Section D Section E Section
BUDGETWATCH March 2016 Flash Report
 March 2016 Flash Report Summary of February Budgetwatch (reporting on operations through January and subsidies through February): Overall results through February were slightly favorable. Net operating
WESTWOOD LUTHERAN CHURCH Summary Financial Statement YEAR TO DATE - February 28, Over(Under) Budget WECC Fund Actual Budget
 Budget WECC Fund Actual Budget") WESTWOOD LUTHERAN CHURCH Summary Financial Statement YEAR TO DATE - February 28, 2018 General Fund Actual A B C D E F WECC Fund Actual Revenue Revenue - Faith Giving 1 $ 213 $ 234 $ (22) - Tuition $ 226
WESTWOOD LUTHERAN CHURCH Summary Financial Statement YEAR TO DATE - February 28, 2018 General Fund Actual A B C D E F WECC Fund Actual Revenue Revenue - Faith Giving 1 $ 213 $ 234 $ (22) - Tuition $ 226
BUDGETWATCH March 2018 Flash Report
 March 2018 Flash Report Overall Latest Condition (reporting on operations through February and subsidies through March): Passenger revenues were $6 million unfavorable in February, increasing the unfavorable
BUDGETWATCH April 2019 Flash Report
 April 2019 Flash Report Overall Latest Condition (reporting on operations through March and subsidies through April): Due to the early scheduling of the Finance Committee meeting, first-close preliminary
2019 Tax Budget Office of Management & Budget July 17, Greater Cleveland Regional Transit Authority
 Greater Cleveland Regional Transit Authority 2019 Tax Budget Office of Management & Budget July 17, 2018 Operating Budget Calendar o May o Jun o Jul Prepare 5 Yr. Financial Forecast Finalize 5 Yr Financial
XML Publisher Balance Sheet Vision Operations (USA) Feb-02
 Feb-02") Page:1 Apr-01 May-01 Jun-01 Jul-01 ASSETS Current Assets Cash and Short Term Investments 15,862,304 51,998,607 9,198,226 Accounts Receivable - Net of Allowance 2,560,786
Page:1 Apr-01 May-01 Jun-01 Jul-01 ASSETS Current Assets Cash and Short Term Investments 15,862,304 51,998,607 9,198,226 Accounts Receivable - Net of Allowance 2,560,786
METRO. Fiscal Year 2013 Monthly Board Report. November 2012
 METRO Fiscal Year 2013 Monthly Board Report Revenue Expense Ridership Performance 12/13/2012 Table of Contents Section A Section B Section C Section D Section E Section F Section G Section H Section I
BUDGETWATCH September 2018 Flash Report
 September 2018 Flash Report (Forecast figures in this report refer to the 2018 Forecast) Overall Latest Condition (reporting on operations through August and subsidies through September): For reporting
Operating Budget. Second Quarter Financial Report
 Second Quarter Financial Report INDEX A. Executive Summary... A-1 B. Revenue and Expense Analysis... B-1 C. Budget Variance Reports... C-1 D. Ridership and Performance Measures... D-1 Board Budget Committee
METRO. Fiscal Year 2015 Monthly Board Report. February 2015
 METRO Fiscal Year 2015 Monthly Board Report Revenue Expense Ridership Performance 4/2/2015 Table of Contents Section A Section B Section C Section D Section E Section F Section G Section H Section I Section
METRO. Fiscal Year 2014 Monthly Board Report. May 2014
 METRO Fiscal Year 2014 Monthly Board Report Revenue Expense Ridership Performance 7/11/2014 Table of Contents Section A Section B Section C Section D Section E Section F Section G Section H Section I Section
METRO. Fiscal Year 2013 Monthly Board Report. January 2013
 METRO Fiscal Year 2013 Monthly Board Report Revenue Expense Ridership Performance 2/14/2013 Table of Contents Section A Section B Section C Section D Section E Section F Section G Section H Section I Section
Big Walnut Local School District
 Big Walnut Local School District Monthly Financial Report for the month ended September 30, 2013 Prepared By: Felicia Drummey Treasurer BIG WALNUT LOCAL SCHOOL DISTRICT SUMMARY OF YEAR TO DATE FINANCIAL
Spheria Australian Smaller Companies Fund
 29-Jun-18 $ 2.7686 $ 2.7603 $ 2.7520 28-Jun-18 $ 2.7764 $ 2.7681 $ 2.7598 27-Jun-18 $ 2.7804 $ 2.7721 $ 2.7638 26-Jun-18 $ 2.7857 $ 2.7774 $ 2.7690 25-Jun-18 $ 2.7931 $ 2.7848 $ 2.7764 22-Jun-18 $ 2.7771
Big Walnut Local School District
 Big Walnut Local School District Monthly Financial Report for the month ended September 30, 2012 Prepared By: Felicia Drummey Treasurer BIG WALNUT LOCAL SCHOOL DISTRICT SUMMARY OF YEAR-TO-DATE FINANCIAL
Financial & Business Highlights For the Year Ended June 30, 2017
 Financial & Business Highlights For the Year Ended June, 17 17 16 15 14 13 12 Profit and Loss Account Operating Revenue 858 590 648 415 172 174 Investment gains net 5 162 909 825 322 516 Other 262 146
FUEL PRICE RISK MANAGEMENT POLICY REPORT "FUEL HEDGE"
 FUEL PRICE RISK MANAGEMENT POLICY REPORT "FUEL HEDGE" Sep-18 FUEL PRICE RISK MANAGEMENT POLICY REPORT Sep-18 (Office of Management and Budget 09/30/2018) The Fuel Price Risk Management Policy approved
FUEL PRICE RISK MANAGEMENT POLICY REPORT "FUEL HEDGE"
 FUEL PRICE RISK MANAGEMENT POLICY REPORT "FUEL HEDGE" December 2018 FUEL PRICE RISK MANAGEMENT POLICY REPORT December 2018 The Fuel Price Risk Management Policy approved by the Board on February 16, 2006
BUDGETWATCH May 2018 Flash Report
 May 2018 Flash Report Overall Latest Condition (reporting on operations through April and subsidies through May): Passenger revenues were $15.1 million unfavorable in April, increasing the unfavorable
TERMS OF REFERENCE FOR THE INVESTMENT COMMITTEE
 I. PURPOSE The purpose of the Investment Committee (the Committee ) is to recommend to the Board the investment policy, including the asset mix policy and the appropriate benchmark for both ICBC and any
CTA 2007 Contingency Plan
 CTA 2007 Contingency Plan JUST THE FACTS RTA Directive Unless the RTA Board makes a determination no later than July 1, 2007, that the funds identified as new transit funding are available for 2007 such
BUDGETWATCH May 2017 Flash Report
 May 2017 Flash Report Summary of April Budgetwatch (reporting on operations through March and subsidies through April): Overall, results were favorable for the month, and remained favorable YTD. Passenger
Jul Aug Sept Oct Nov Dec Jan Feb Mar Apr May Jun
 REVENUE AND RIDERSHIP 4th Quarter FY2014 REVENUE (in Millions) $90M $85M $80M $75M $70M $65M $60M $55M $50M 79 77 74 74 72 70 FY2013 Actual FY2014 Budget FY2014 Actual 79 85 78 78 77 67 66 70 59 67 65
Cost Estimation of a Manufacturing Company
 Cost Estimation of a Manufacturing Company Name: Business: Date: Economics of One Unit: Manufacturing Company (Only complete if you are making a product, such as a bracelet or beauty product) Economics
BUDGETWATCH April 2015 Flash Report
 BUDGETWATCH April 2015 Flash Report Summary of March Budgetwatch (reporting on operations through February and subsidies through March): Overall, results through March were favorable mainly as a result
Financial Management Report... 3
 November 13, 2013 Table of Contents Financial Management Report... 3 OPERATING FUNDS STATEMENT OF REVENUES & EXPENSES... 3 METROPOLITAN COUNCIL INVESTMENT PERFORMANCE SHORT-TERM PORTFOLIO... 4 METROPOLITAN
Power Accountants Association Annual Meeting Potential Impacts from Oct 2015 Rate Change
 Power Accountants Association Annual Meeting Potential Impacts from Oct 2015 Rate Change Material Provided by: Chris Mitchell Chris Mitchell Management Consultants (CMMC) mail@chrismitchellmc.com 5/14/2015
MONTHLY FINANCIAL STATUS JUNE 2018
 (Millions) MONTHLY FINANCIAL STATUS To: Dave Genova, General Manager and CEO ACTION DISCUSSION INFO From: Heather McKillop, CFO and AGM Administration x Date: July 10, VS. BUDGET YTD VS. BUDGET JUNE VS.
MONTHLY FINANCIAL STATUS JANUARY 2019
 (Millions) MONTHLY FINANCIAL STATUS To: Dave Genova, General Manager and CEO ACTION DISCUSSION INFO From: Heather McKillop, CFO and AGM Administration x Date: March 12, 2019 VS. BUDGET YTD 2019 VS. BUDGET
Review of Registered Charites Compliance Rates with Annual Reporting Requirements 2016
 Review of Registered Charites Compliance Rates with Annual Reporting Requirements 2016 October 2017 The Charities Regulator, in accordance with the provisions of section 14 of the Charities Act 2009, carried
February 2016 Financial Report
 2016 February 2016 Financial Report Capital Metropolitan Transportation Authority 4/13/2016 Table of Contents SUMMARY REPORT Budgetary Performance - Revenue 2 - Sales Tax Revenue 5 - Operating Expenses
BUDGETWATCH January 2015 Special 2014 Year-End Flash
 BUDGETWATCH January 2015 Special 2014 Year-End Flash Overall: January Budgetwatch is a flash look focusing on some very preliminary 2014 actual revenue results compared with the Final Estimate that was
MEMORANDUM TO: FROM: Kathy Fisher, Budget Manager ( ) SUBJECT: Budget Variance Report 1 st Quarter DATE: April 20, 2017
 SUBJECT: Budget Variance Report 1 st Quarter DATE: April 20, 2017") MEMORANDUM F&A 5/1/ Page 1 of 6 TO: Finance and Administration Committee FROM: Kathy Fisher, Budget Manager (612-726-8158) SUBJECT: Budget Variance Report 1 st Quarter DATE: April 20, The 1 st Quarter
MEMORANDUM F&A 5/1/ Page 1 of 6 TO: Finance and Administration Committee FROM: Kathy Fisher, Budget Manager (612-726-8158) SUBJECT: Budget Variance Report 1 st Quarter DATE: April 20, The 1 st Quarter
MONTHLY FINANCIAL STATUS AUGUST 2018
 (Millions) MONTHLY FINANCIAL STATUS To: Dave Genova, General Manager and CEO ACTION DISCUSSION INFO From: Heather McKillop, CFO and AGM Administration x Date: October 9, VS. BUDGET YTD VS. BUDGET AUGUST
BUDGETWATCH February 2016 Flash Report
 February 2016 Flash Report Overall Latest Condition (reporting on operations for January and subsidies through February): Overall, preliminary results were on target for the month and slightly favorable
QUARTERLY FINANCIAL REPORT December 31, 2017
 California Independent System Operator QUARTERLY FINANCIAL REPORT December 31, 2017 Preliminary and Unaudited 250 Outcropping Way Folsom, CA 95630 (916) 351-4000 CALIFORNIA INDEPENDENT SYSTEM OPERATOR
Executive Summary. July 17, 2015
 Executive Summary July 17, 2015 The Revenue Estimating Conference adopted interest rates for use in the state budgeting process. The adopted interest rates take into consideration current benchmark rates
Fiscal Year 2018 Project 1 Annual Budget
 Fiscal Year 2018 Project 1 Annual Budget Table of Contents Table Page Summary 3 Summary of Costs Table 1 4 Treasury Related Expenses Table 2 5 Summary of Full Time Equivalent Table 3 6 Positions Cost-to-Cash
VIIl. Agency Financial Plans and 12-Month Allocations
 VIIl. Agency Financial Plans and 12-Month Allocations New York City Transit MTA NEW YORK CITY TRANSIT FEBRUARY FINANCIAL PLAN FOR 2006-2009 2005 FINAL ESTIMATE AND ADOPTED BUDGET FOR 2006 In accordance
Economic Activity Index ( GDB-EAI ) For the month of May 2013 G O V E R N M E N T D E V E L O P M E N T B A N K F O R P U E R T O R I C O
 For the month of May 2013 G O V E R N M E N T D E V E L O P M E N T B A N K F O R P U E R T O R I C O") Economic Activity Index ( GDB-EAI ) For the month of May 2013 General Commentary May 2013 GDB-EAI for the month of May registered a 3.4% year-over-year ( YOY ) reduction May 2013 EAI was 126.7, a 3.4%
Economic Activity Index ( GDB-EAI ) For the month of May 2013 General Commentary May 2013 GDB-EAI for the month of May registered a 3.4% year-over-year ( YOY ) reduction May 2013 EAI was 126.7, a 3.4%
Quarterly Financial Review
 Second Quarter 2013 Quarterly Financial Review Norfolk Southern Corporation Finance Department Three Commercial Place Norfolk, Virginia 23510.2191 7/20/2012 DRAFTB Norfolk Southern Railway System Contents
MONTHLY FINANCIAL STATUS OCTOBER 2018
 (Millions) MONTHLY FINANCIAL STATUS To: Dave Genova, General Manager and CEO ACTION DISCUSSION INFO From: Heather McKillop, CFO and AGM Administration x Date: December 11, VS. BUDGET YTD VS. BUDGET OCTOBER
MIAMI PARKING AUTHORITY
 Revenue & Expenses Summary For the Five Months Ending February 28, 2019 Page 1 Adopted FY 2018 Actual Actual Actual Budget Actual Versus FY 2018 Versus 2019 Budget Year-To-Date $ $ $ $ % $ % Operating
QUESTION 2. QUESTION 3 Which one of the following is most indicative of a flexible short-term financial policy?
 QUESTION 1 Compute the cash cycle based on the following information: Average Collection Period = 47 Accounts Payable Period = 40 Average Age of Inventory = 55 QUESTION 2 Jan 41,700 July 39,182 Feb 18,921
HIPIOWA - IOWA COMPREHENSIVE HEALTH ASSOCIATION Unaudited Balance Sheet As of July 31
 Unaudited Balance Sheet As of July 31 Total Enrollment: 407 Assets: Cash $ 9,541,661 $ 1,237,950 Invested Cash 781,689 8,630,624 Premiums Receivable 16,445 299,134 Prepaid 32,930 34,403 Assessments Receivable
Monthly Trading Report Trading Date: May Monthly Trading Report May 2018
 Trading Date: May 8 Monthly Trading Report May 8 Trading Date: May 8 Figure : May 8 (% change over previous month) % Major Market Indicators 9 8 Figure : Summary of Trading Data USEP () Daily Average Daily
HIPIOWA - IOWA COMPREHENSIVE HEALTH ASSOCIATION Unaudited Balance Sheet As of January 31
 Unaudited Balance Sheet As of January 31 Total Enrollment: 371 Assets: Cash $ 1,408,868 $ 1,375,117 Invested Cash 4,664,286 4,136,167 Premiums Receivable 94,152 91,261 Prepaid 32,270 33,421 Assessments
Review of Membership Developments
 RIPE Network Coordination Centre Review of Membership Developments 7 October 2009/ GM / Lisbon http://www.ripe.net 1 Applications development RIPE Network Coordination Centre 140 120 100 80 60 2007 2008
GENERAL FUND AT A GLANCE Category Budget YTD Actual % % Year Passed Resources 8.33% Uses 8.33% $0 $1,330,750
 City of Edmond Monthly Financial Report FY 2008/2009 Through the Month Ended Unaudited - Intended for Management Purposes Only The following is a summary of the City's financial results for operating funds.
PRESS RELEASE. Securities issued by Hungarian residents and breakdown by holding sectors. October 2018
 PRESS RELEASE 10 December 2018 Securities issued by Hungarian residents and breakdown by holding sectors October 2018 According to securities statistics, the amount outstanding of equity securities and
JANUARY FY Monthly Financial and Operational Report. Rhode Island Public Transit Authority
 JANUARY FY 2019 Monthly Financial and Operational Report Rhode Island Public Transit Authority Financial Summary As of December FY 2019 Budget Actual Variance % Variance Revenues $ 64,896,602 $ 58,000,401
QUARTERLY FINANCIAL REPORT June 30, 2017
 California Independent System Operator QUARTERLY FINANCIAL REPORT June 30, 2017 250 Outcropping Way Folsom, CA 95630 (916) 351-4000 CALIFORNIA INDEPENDENT SYSTEM OPERATOR CORPORATION QUARTERLY FINANCIAL
Washington State Health Insurance Pool Treasurer s Report April 2018 Financial Review
 Washington State Health Insurance Pool Treasurer s Report April 2018 Financial Review 1. 2018 Interim I Assessment Required An assessment of $7.0 M is required to adequately fund the pool until the next
Washington State Health Insurance Pool Treasurer s Report March 2018 Financial Review
 Washington State Health Insurance Pool Treasurer s Report March 2018 Financial Review 1. 2017 Interim III Assessment Required An assessment of $8.5 M was required to adequately fund the pool until the
Washington State Health Insurance Pool Treasurer s Report January 2018 Financial Review
 Washington State Health Insurance Pool Treasurer s Report January 2018 Financial Review 1. 2017 Interim III Assessment Required An assessment of $8.5 M was required to adequately fund the pool until the
Budget Manager Meeting. February 20, 2018
 Budget Manager Meeting February 20, 2018 Meeting Agenda DISCUSSION DRAFT NOT FOR DISTRIBUTION Budget Office Current Year Forecast Process Endowment Payout Control Charts FY19 Target Meetings Delphi Project
Washington State Health Insurance Pool Treasurer s Report November 2014 Financial Review
 Washington State Health Insurance Pool Treasurer s Report November 2014 Financial Review 1. 2014 Interim III and 2013 Final True-up Assessment Required An assessment of $2.0 M is required in order to adequately
Business & Financial Services December 2017
 Business & Financial Services December 217 Completed Procurement Transactions by Month 2 4 175 15 125 1 75 5 2 1 Business Days to Complete 25 Jan Feb Mar Apr May Jun Jul Aug Sep Oct Nov Dec 217 Procurement
General Fund Revenue
 Millions Percent of Kathy Steinert, Director of Fiscal Services Phone: 541.923.8927 145 SE Salmon Ave Redmond, OR 97756 kathy.steinert@redmond.k12.or.us Date: May 23, 2014 To: Redmond School District Board
METRO. Fiscal Year Monthly Performance Report. Revenue Expense Ridership Performance. November 2018 (Third Quarter Fiscal Year-to Date)
") METRO Fiscal Year 2019 Monthly Performance Report Revenue Expense Ridership Performance (Third Quarter Fiscal Year-to Date) 12/12/2018 Table of Contents Section A Section B Section C Section D Section
METRO Fiscal Year 2019 Monthly Performance Report Revenue Expense Ridership Performance (Third Quarter Fiscal Year-to Date) 12/12/2018 Table of Contents Section A Section B Section C Section D Section
METRO. Fiscal Year 2017 Monthly Performance Report. Revenue Expense Ridership Performance. October 2016
 METRO Fiscal Year 2017 Monthly Performance Report Revenue Expense Ridership Performance 11/18/2016 Table of Contents Section A Section B Section C Section D Section E Section F Section G Section H Section
Washington State Health Insurance Pool Treasurer s Report August 2017 Financial Review
 Washington State Health Insurance Pool Treasurer s Report August 2017 Financial Review 1. 2017 Interim I Assessment Required An assessment of $9.5 M was required to adequately fund the pool until the next
Quarterly Financial Review
 First Quarter 2014 Quarterly Financial Review Norfolk Southern Corporation Finance Department Three Commercial Place Norfolk, Virginia 23510.2191 Norfolk Southern Railway System Contents Consolidated Statements
BUDGETWATCH September 2014 Flash Report
 BUDGETWATCH September 2014 Flash Report (Forecast figures in this report, except the Summary of June Budgetwatch, refer to the 2014 Forecast) Summary of June Budgetwatch (reporting on operations through
Management Reports. June for PREPARED BY POWERED BY
 Management Reports for June 217 PREPARED BY POWERED BY Contents 1. Management Reports Cashflow Forecast Actual vs Budget P&L Forecast Where Did Our Money Go? Net Worth 2. Understanding your Reports 3.
Determination (9 /2010) of a Customer Complaint Submitted by a Customer Against Muscat Electricity Distribution Company SAOC
 of a Customer Complaint Submitted by a Customer Against Muscat Electricity Distribution Company SAOC") Determination (9 /2010) of a Customer Complaint Submitted by a Customer Against Muscat Electricity Distribution Company SAOC 1. Introduction 1.1 The Authority for Electricity Regulation, Oman (the Authority)
Determination (9 /2010) of a Customer Complaint Submitted by a Customer Against Muscat Electricity Distribution Company SAOC 1. Introduction 1.1 The Authority for Electricity Regulation, Oman (the Authority)
Washington State Health Insurance Pool Treasurer s Report December 2017 Financial Review
 Washington State Health Insurance Pool Treasurer s Report December 2017 Financial Review 1. 2017 Interim III Assessment Required An assessment of $8.5 M is required to adequately fund the pool until the
Regional overview Gisborne
 Regional overview Purchasing intentions - additional income-related rent subsidy (IRRS) places Area District 1 2 3 4+ TOTAL 3 35 5 7 total 3 35 5 7 7 8 9 1 11 Purchasing intentions - change within the
MONTHLY FINANCIAL REPORT June 2009
 California Independent System Operator MONTHLY FINANCIAL REPORT June 2009 151 Blue Ravine Road Folsom, CA 95630 (916) 351-4000 CALIFORNIA INDEPENDENT SYSTEM OPERATOR CORPORATION MONTHLY FINANCIAL REPORT
Economic and Revenue Update
 Economic and Revenue Update A Briefing for the Money Committees Aubrey L. Layne, Jr. Secretary of Finance Commonwealth of Virginia www.finance.virginia.gov January 2018 Topics for Discussion National and