Cash & Liquidity The chart below highlights CTA s cash position at January 2016 compared to January 2015.
|
|
|
- Rolf McCarthy
- 6 years ago
- Views:
Transcription

1 To: Chicago Transit Authority Board From: Tom McKone, Acting Chief Financial Officer Re: Financial Results for January 2016 Date: March 9, 2016 I. Summary CTA s financial results are $0.8 million unfavorable for January primarily due to the uncertainty regarding the free and reduced fare subsidy from the State. Ridership for the month is 38.9 million and is 0.4 million less than budget. Ridership is 0.5 million or 1.2% lower than January 2015 due to one less workday in January II. Cash & Liquidity The chart below highlights CTA s cash position at January 2016 compared to January Jan Jan Increase (Decrease) Unrestricted Cash $ $ $ 49.2 Damage Reserve $ (5.5) Funds Owed by RTA $ 26.3 Trust Portfolio Assets $ (267.1) Total Cash and Receivables $ $ 1,165.1 $ (197.1) CTA s total cash/receivables balance is equal to $968.0 million. Unrestricted cash was $49.2 million more than the prior year due to receipt of $23 million in proceeds from the debt reserve substitution in August, recent insurance settlements, and $15 million in ICE grant funds from the RTA in March The Damage Reserve is sufficiently funded and was $5.5 million lower than last year reflecting payouts for settled claims. Funds owed by the RTA were approximately $294.3 million which was $26.3 million more than the prior year. CTA continues to work closely with the RTA to monitor their receivable balance owed; Trust Portfolio Assets represents bond proceeds held in Trust for funding capital projects and making required debt service payments. 1
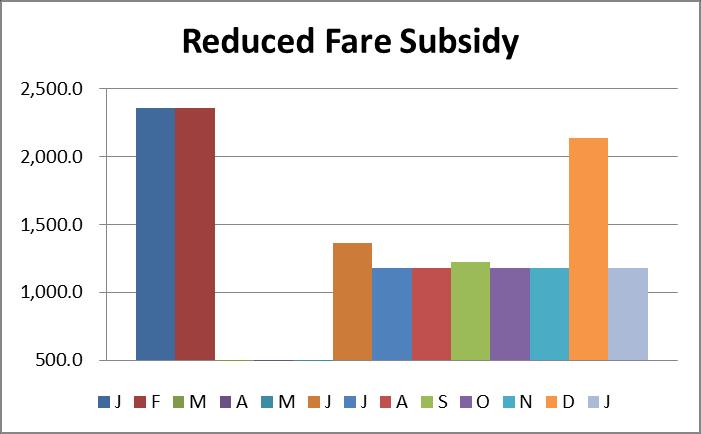
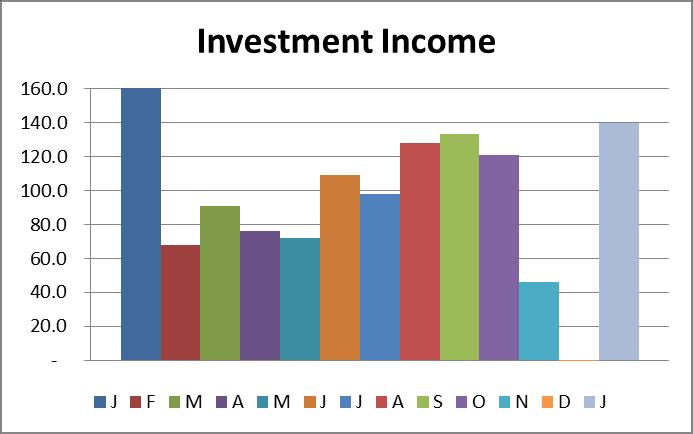
2 III. Revenue Fare & Pass Revenue $ 44,877 $ 233 $ 395 $ 44,877 $ 233 $ 395 Fare and pass revenue for January was $0.2 million favorable to budget and $0.4 million favorable to prior year. The average fare for the month was $1.15 and was $0.01 more than budget and $0.02 higher than last year due to increased rail ridership. Reduced Fare Subsidy $ 1,180 $ (1,180) $ (1,180) $ 1,180 $ (1,180) $ (1,180) Reduced Fare Subsidy is $1.2 million less than budget due to the uncertainty regarding the State budget and funding for the free and reduced fare mandates. Advertising, Charter, Concession $ 2,698 $ 45 $ 408 $ 2,698 $ 45 $ 408 Advertising, Charter and Concessions Revenue is slightly favorable to budget for the month. The increase over prior year is due to higher vehicle and platform advertising than anticipated and the annual increase in advertising contracts. Investment income $ 140 $ 67 $ (264) $ 140 $ 67 $ (264) Investment income was higher than budget for the month primarily due to a higher yield portfolio and better security selection. The decrease over prior year is due to required year end market value adjustments. 2
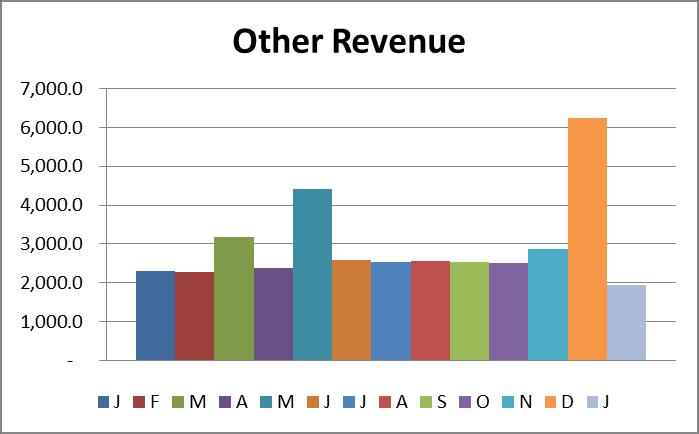
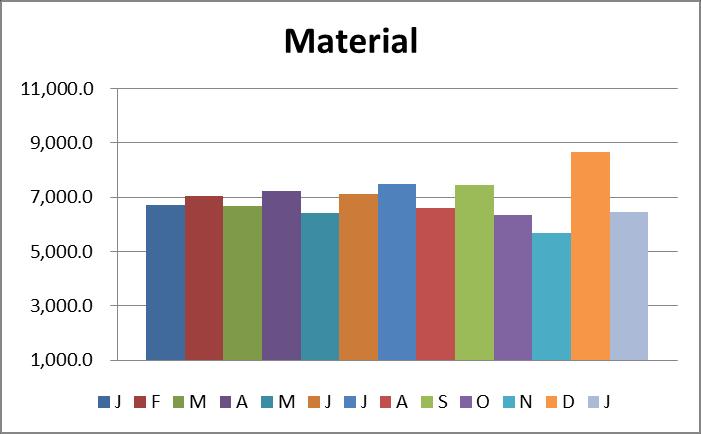
3 Other Revenue $ 1,926 $ (82) $ (363) $ 1,926 $ (82) $ (363) Other Revenue was slightly unfavorable to budget for the month due to lower non-capital grant revenue offset by increased parking lot revenue. The decrease over the prior year is due to lower rentals, movie revenue and non-capital grant revenue. Total System Generated Revenue $ 50,821 $ (917) $ (1,003) $ 50,821 $ (917) $ (1,003) Total System-Generated Revenue was $0.9 million less than budget for the month and $1 million less than prior year primarily due to the potential reduction in the State s free and reduced fare subsidy. IV. Expenses Labor $ 83,998 $ (1,359) $ (1,430) $ 83,998 $ (1,359) $ (1,430) Labor expense was $1.4 million unfavorable to budget for the month due to higher overtime than anticipated. Labor expense is $1.4 million more than 2015 due to contractual wage increases that took effect in July 2015 and slightly higher fringe benefits in Material $ 6,451 $ 592 $ 251 $ 6,451 $ 592 $ 251 Material expense was $0.6 million favorable to budget for the month and $0.3 million lower than prior year due primarily to milder weather in 2016 and additional winter prep occurring at the end of
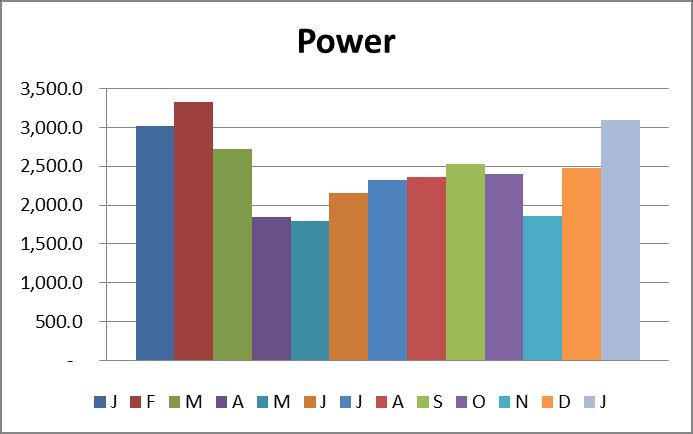
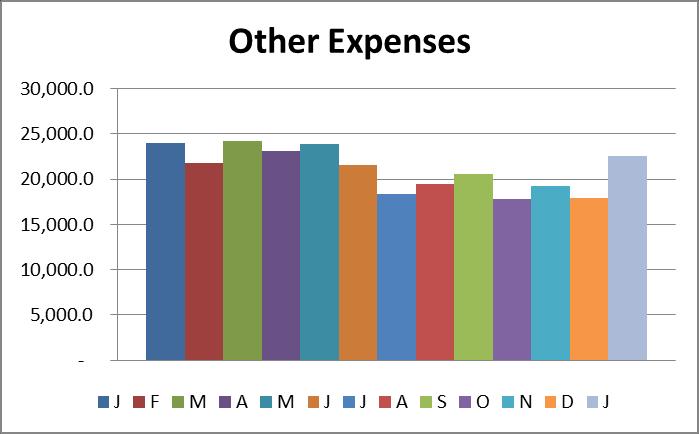
4 Fuel $ 2,625 $ 417 $ 1,901 $ 2,625 $ 417 $ 1,901 Fuel for Revenue Equipment expense was $0.4 million favorable to budget for the month. Fuel expense is $1.9 million favorable to prior year primarily due to the significant reduction in the price of diesel fuel and lower usage. Power $ 3,102 $ 69 $ (89) $ 3,102 $ 69 $ (89) The Electric Power for Revenue Equipment expense was on par with budget and the prior year. An increase in ComEd regulatory fees led to a higher price in Purchase of Security Services $ 1,202 $ 22 $ (56) $ 1,202 $ 22 $ (56) Purchase of Security Services was on par with budget for the month. Security expense was slightly unfavorable to prior year due to contract escalation. Other Expenses $ 22,541 $ 359 $ 1,447 $ 22,541 $ 359 $ 1,447 Other Expenses were favorable to budget and prior year by $0.4 million and $1.4 million, respectively. The decrease over prior year is due to the timing of contractual expenses. Of the total monthly other expenses, the pension obligation bond expense is $10 million; the remaining expenses are for utilities, maintenance contracts, services, and other expenses. 4
5 Total Operating Expenses $ 119,920 $ 100 $ 2,024 $ 119,920 $ 100 $ 2,024 Operating Expenses were on par with budget for the month. The $2.0 million favorable variance to prior year is due primarily to favorable fuel, materials and other expense. V. Recovery Ratio Recovery Ratio 50.91% (0.73) 50.91% (0.73) VI. Recovery Ratio, which measures the percentage of operating expenses CTA funds from internally generated revenues, was 50.91% for the month. This was unfavorable to budget by 0.73 percentage points. Ridership Bus 20,751 (525) (653) 20,751 (525) (653) Rail 14, , Rail to Rail Transfers 3, , Total 38,916 (358) (481) 38,916 (358) (481) Ridership for the month of January was 38.9 million and was on 0.4 million lower than budget and was 0.5 million less than prior year. Calendar adjusted ridership was up 1.2% from prior year due to the fact that January 2016 had 20 workdays compared with 21 in January More details on ridership can be found in the January Ridership Report. 5

6 Cash & Liquidity 6


7 Cash & Liquidity (cont d) Revenue 7
")
8 Revenue (cont d) 8
")

9 Revenue (cont d) Expenses 9
")
10 Expenses (cont d) 10
")
11 Expenses (cont d) 11
12 12
Cash & Liquidity The chart below highlights CTA s cash position at February 2016 compared to February 2015.
 To: Chicago Transit Authority Board From: Jeremy Fine, Chief Financial Officer Re: Financial Results for February 2016 Date: April 6, 2016 I. Summary CTA s financial results are $2.7 million favorable
Cash & Liquidity The chart below highlights CTA s cash position at December 2017 compared to December 2016.
 To: Chicago Transit Authority Board From: Jeremy Fine, Chief Financial Officer Re: Financial Results for December 2017 Date: February 14, 2018 I. Summary CTA s financial results are $4.7 million favorable
Ridership for the month is 39.4 million and is on par with budget. Ridership is 1.4 million or 3.6% higher than January 2014.
 To: Chicago Transit Authority Board From: Ron DeNard, Chief Financial Officer Re: Financial Results for January 2015 Date: March 6, 2015 I. Summary CTA s financial results are $2.0 million favorable for
Cash & Liquidity The chart below highlights CTA s cash position at September 2017 compared to September 2016.
 To: Chicago Transit Authority Board From: Jeremy Fine, Chief Financial Officer Re: Financial Results for September 2017 Date: November 15, 2017 I. Summary CTA s financial results are $7.7 million favorable
Cash & Liquidity The chart below highlights CTA s cash position at March 2017 compared to March 2016.
 To: Chicago Transit Authority Board From: Jeremy Fine, Chief Financial Officer Re: Financial Results for March 2017 Date: May 10, 2017 I. Summary CTA s financial results are $0.6 million favorable to budget
Cash & Liquidity The chart below highlights CTA s cash position at July 2015 compared to July 2014.
 To: Chicago Transit Authority Board From: Tom McKone, Acting CFO Re: Financial Results for July 2015 Date: September 4, 2015 I. Summary CTA s financial results are favorable by $1.9 million for the month
Cash & Liquidity The chart below highlights CTA s cash position at February 2015 compared to February 2014.
 To: Chicago Transit Authority Board From: Ron DeNard, Chief Financial Officer Re: Financial Results for February 2015 Date: April 15, 2015 I. Summary CTA s financial results are favorable for the month
Cash & Liquidity The chart below highlights CTA s cash position at February 2017 compared to February 2016.
 To: Chicago Transit Authority Board From: Jeremy Fine, Chief Financial Officer Re: Financial Results for February 2017 Date: April 5, 2017 I. Summary CTA s financial results are $0.3 million favorable
CTA s financial results are unfavorable by $0.5 million and $1.2 million for the month and year.
 To: Chicago Transit Authority Board From: Ron DeNard, Chief Financial Officer Re: Financial Results for May 2015 Date: July 13, 2015 I. Summary CTA s financial results are unfavorable by $0.5 million and
Cash & Liquidity The chart below highlights CTA s cash position at November 2014 compared to November 2013.
 To: Chicago Transit Authority Board From: Ronald E. DeNard, Chief Financial Officer Re: Financial Results for November 2014 Date: January 12, 2015 I. Summary CTA s financial results are $1.9 million unfavorable
The year to date is less than budget and prior year by 15.4 million and 11.6 million, respectively.
 To: Chicago Transit Authority Board From: Jeremy Fine, Chief Financial Officer Re: Financial Results for September 2016 Date: November 16, 2016 I. Summary CTA s financial results are $0.3 million unfavorable
Cash & Liquidity The chart below highlights CTA s cash position at July 2016 compared to July 2015.
 To: Chicago Transit Authority Board From: Jeremy Fine, Chief Financial Officer Re: Financial Results for July 2016 Date: September 14, 2016 I. Summary CTA s financial results are $0.4 million favorable
Cash & Liquidity The chart below highlights CTA s cash position at January 2018 compared to January 2017.
 To: Chicago Transit Authority Board From: Jeremy Fine, Chief Financial Officer Re: Financial Results for January 2018 Date: March 14, 2018 I. Summary CTA s financial results are $1.7 million unfavorable
Cash & Liquidity The chart below highlights CTA s cash position at June 2014 compared to June 2013.
 To: Chicago Transit Authority Board From: Ron DeNard, Chief Financial Officer Re: Financial Results for June 2014 Date: August 13, 2014 I. Summary CTA s financial results are $4.0 million favorable for
Cash & Liquidity The chart below highlights CTA s cash position at June 2018 compared to June 2017.
 To: Chicago Transit Authority Board From: Jeremy Fine, Chief Financial Officer Re: Financial Results for June 2018 Date: August 15, 2018 I. Summary CTA s financial results are unfavorable to budget for
Cash & Liquidity The chart below highlights CTA s cash position at March 2018 compared to March 2017.
 To: Chicago Transit Authority Board From: Jeremy Fine, Chief Financial Officer Re: Financial Results for March 2018 Date: May 9, 2018 I. Summary CTA s financial results are $0.9 million favorable to budget
Cash & Liquidity The chart below highlights CTA s cash position at August 2018 compared to August 2017.
 To: Chicago Transit Authority Board From: Jeremy Fine, Chief Financial Officer Re: Financial Results for August 2018 Date: October 10, 2018 I. Summary CTA s financial results are favorable to budget for
Cash & Liquidity The chart below highlights CTA s cash position at May 2014 compared to May 2013.
 To: Chicago Transit Authority Board From: Ron DeNard, Chief Financial Officer Re: Financial Results for May 2014 Date: July 16, 2014 I. Summary CTA s financial results are $5.6 million favorable for May
1 ST QUARTER 2017 QUARTERLY FINANCIAL AND PERFORMANCE REPORT
 1 ST QUARTER 2017 QUARTERLY FINANCIAL AND PERFORMANCE REPORT May 2017 0 1 st Quarter 2017 Financial and Performance Report Table of Contents Executive Summary... 2 Environmental Factors... 4 Ridership...
FY2014 Operating Budget Performance Report
 Finance & Administration Committee Information Item IV-C September 11, 2014 FY2014 Operating Budget Performance Report Washington Metropolitan Area Transit Authority Board Action/Information Summary Action
Operating Budget Stability
 Operating Budget Stability March Financial Update Report to Agenda Executive Summary March Performance Against FY16 Budget March Performance Against Same Period Last Year Appendix Financial Detail: March
Operating Budget. Third Quarter Financial Report (July 2005 March 2006)
") Third Quarter Financial Report (July 2005 March 2006) INDEX A. Executive Summary...page 2 B. Revenue and Expense Analysis...page 3 C. Budget Variance Reports...page 14 D. Ridership and Performance Measures...page
Third Quarter Financial Report (July 2005 March 2006) INDEX A. Executive Summary...page 2 B. Revenue and Expense Analysis...page 3 C. Budget Variance Reports...page 14 D. Ridership and Performance Measures...page
Operating Budget. Second Quarter Financial Report
 Second Quarter Financial Report INDEX A. Executive Summary... A-1 B. Revenue and Expense Analysis... B-1 C. Budget Variance Reports... C-1 D. Ridership and Performance Measures... D-1 Board Budget Committee
FY2018 Third Quarter Financial Update
 Finance and Committee Information Item IV-A May 10, 2018 Third Quarter Financial Update Page 30 of 53 Washington Metropolitan Area Transit Authority Board Action/Information Summary Action Information
CHICAGO TRANSIT AUTHORITY. FINANCIAL STATEMENTS AND SUPPLEMENTARY INFORMATION December 31, 2011 and 2010 (With Independent Auditors Report Thereon)
") FINANCIAL STATEMENTS AND SUPPLEMENTARY INFORMATION (With Independent Auditors Report Thereon) Chicago, Illinois FINANCIAL STATEMENTS CONTENTS Independent Auditors Report... 1 Management s Discussion and
FINANCIAL STATEMENTS AND SUPPLEMENTARY INFORMATION (With Independent Auditors Report Thereon) Chicago, Illinois FINANCIAL STATEMENTS CONTENTS Independent Auditors Report... 1 Management s Discussion and
4 TH QUARTER 2017 QUARTERLY FINANCIAL AND PERFORMANCE REPORT
 4 TH QUARTER 2017 QUARTERLY FINANCIAL AND PERFORMANCE REPORT February 2018 0 4 th Quarter 2017 Financial and Performance Report Table of Contents Executive Summary... 2 Environmental Factors... 4 Ridership...
Suburban Service and Regional ADA Budget Results January 2019
 and Regional Results January 2019 Department of Internal Services Issued March 2019 Performance At-A-Glance January 2019 (Millions) $25 $20 $17 $15 $10 $5 $0 ($5) Generated Public Expenses Net Results
Chicago Transit Authority Financial Statements for the Years Ended December 31, 1999 and 1998 and Supplementary Information and Independent Auditors'
 Chicago Transit Authority Financial Statements for the Years Ended December 31, 1999 and 1998 and Supplementary Information and Independent Auditors' Report TABLE OF CONTENTS Page INDEPENDENT AUDITORS'
METRO. Fiscal Year 2012 Monthly Board Report. September 2012 (Fourth Quarter Fiscal Year-to-Date)
") METRO Fiscal Year 2012 Monthly Board Report Revenue Expense Ridership Performance (Fourth Quarter Fiscal Year-to-Date) This report is based on a preliminary closing of the year-end financials for FY2012
METRO Fiscal Year 2012 Monthly Board Report Revenue Expense Ridership Performance (Fourth Quarter Fiscal Year-to-Date) This report is based on a preliminary closing of the year-end financials for FY2012
3 RD QUARTER 2016 QUARTERLY FINANCIAL AND PERFORMANCE REPORT
 3 RD QUARTER 2016 QUARTERLY FINANCIAL AND PERFORMANCE REPORT November 2016 0 3 rd Quarter 2016 Financial and Performance Report Table of Contents Executive Summary... 1 Environmental Factors... 3 Ridership...
Operating Budget Stability Q1 FY17 Financial Update
 Operating Budget Stability Q1 FY17 Financial Update Report to Fiscal and Management Control Board Without action, operating deficit was on track to reach $427M by FY20 STATUS QUO FY17 PRO FORMA 8.1.2015
3 RD QUARTER 2017 QUARTERLY FINANCIAL AND PERFORMANCE REPORT
 3 RD QUARTER 2017 QUARTERLY FINANCIAL AND PERFORMANCE REPORT November 2017 0 3 rd Quarter 2017 Financial and Performance Report Table of Contents Executive Summary... 2 Environmental Factors... 4 Ridership...
2 ND QUARTER 2017 QUARTERLY FINANCIAL AND PERFORMANCE REPORT
 2 ND QUARTER 2017 QUARTERLY FINANCIAL AND PERFORMANCE REPORT August 2017 0 2 nd Quarter 2017 Financial and Performance Report Table of Contents Executive Summary... 2 Environmental Factors... 4 Ridership...
CHICAGO TRANSIT AUTHORITY. FINANCIAL STATEMENTS AND SUPPLEMENTARY INFORMATION December 31, 2010 and 2009 (With Independent Auditors Report Thereon)
") FINANCIAL STATEMENTS AND SUPPLEMENTARY INFORMATION (With Independent Auditors Report Thereon) Chicago, Illinois FINANCIAL STATEMENTS CONTENTS Independent Auditors Report... 1 Management s Discussion and
FINANCIAL STATEMENTS AND SUPPLEMENTARY INFORMATION (With Independent Auditors Report Thereon) Chicago, Illinois FINANCIAL STATEMENTS CONTENTS Independent Auditors Report... 1 Management s Discussion and
4TH QUARTER 2016 QUARTERLY FINANCIAL AND PERFORMANCE REPORT
 4TH QUARTER 2016 QUARTERLY FINANCIAL AND PERFORMANCE REPORT February 2017 0 Quarterly Financial and Performance Report 4th Quarter 2016 4th Quarter 2016 Financial and Performance Report Table of Contents
Operating Budget Report
 Operating Budget Report MTD Operating Budget ($ in Millions) Sept-FY2012 Sept-FY2013 Variance FY13 Actual Actual Budget $ Percent $140M Operating Expenditures ($ in Millions) Revenue $ 67 $ 68 $ 71 $ (3)
Chicago Transit Authority Financial Statements for the Years Ended December 31, 2000 and 1999 and Supplementary Information and Independent Auditors'
 Chicago Transit Authority Financial Statements for the Years Ended December 31, 2000 and 1999 and Supplementary Information and Independent Auditors' Report TABLE OF CONTENTS Page INDEPENDENT AUDITORS'
Operating Budget Report
 Operating Budget Report MTD Operating Budget ($ in Millions) Oct-FY2012 Oct-FY2013 Variance FY13 Actual Actual Budget $ Percent $140M Operating Expenditures ($ in Millions) Revenue $ 67 $ 70 $ 79 $ (8)
Washington Metropolitan Area Transit Authority Metro Budget Overview
 Washington Metropolitan Area Transit Authority Metro Budget Overview February 2011 Metro 10,877 Employees (10,974 budgeted) 1,491 Buses 588 Escalators and 237 Elevators 106 Miles of Track 92 Traction Power
1ST QUARTER May 2018
 1ST QUARTER 2018 May 2018 0 1 st Quarter 2018 Financial and Performance Report Table of Contents Executive Summary... 2 Environmental Factors... 4 Ridership... 6 Peer Ridership Comparison... 7 Operating
BUDGETWATCH March 2019 Flash Report
 March 2019 Flash Report Overall Latest Condition (reporting on operations through February and subsidies through March): Overall, YTD preliminary net results were favorable mainly reflecting lower operating
METRO MONTHLY BOARD REPORT
 METRO Revenue Expenses Service Performance Fiscal Year FY2011 Table of Contents Section A Section B Section C Section D Section E Section F Section G Section H Summary Sales Tax Revenue Fare Revenue Operating
3RD QUARTER November 2018
 3RD QUARTER 2018 November 2018 0 Quarterly Financial and Performance Report 3rd Quarter 2018 3rd Quarter 2018 Financial and Performance Report Table of Contents Executive Summary... 2 Environmental Factors...
Financial Report - FY 2017 Year to Date May 31, 2017
 Financial Report - FY 2017 Year to Date July 19, 2017 1 Major Highlights Revenue Sales tax remittances received through YTD April 2017 are 4.2% higher than YTD April 2016 Plaza Saltillo lease income budgeted
BUDGETWATCH March 2016 Flash Report
 March 2016 Flash Report Summary of February Budgetwatch (reporting on operations through January and subsidies through February): Overall results through February were slightly favorable. Net operating
METRO. Fiscal Year 2012 Monthly Board Report. December 2011 (First Quarter Fiscal Year-to-Date)
") METRO Fiscal Year 2012 Monthly Board Report Revenue Expense Ridership Performance (First Quarter Fiscal Year-to-Date) 1/27/2012 Table of Contents Section A Section B Section C Section D Section E Section
METRO Fiscal Year 2012 Monthly Board Report Revenue Expense Ridership Performance (First Quarter Fiscal Year-to-Date) 1/27/2012 Table of Contents Section A Section B Section C Section D Section E Section
OPERATING BUDGET REPORT
 OPERATING BUDGET REPORT OPERATING BUDGET ($ in Millions) MTD Nov-FY2012 Nov-FY2013 Actual Actual Budget $ Percent Revenue $ 63.0 $ 65.7 $ 68.3 $ (2.7) -3.9% Expense $ 107.6 $ 124.8 $ 129.8 $ 5.0 3.8% Subsidy
- II OPERATING BUDGET REPORT ^ H FY2013 ^^ H. ««-ms. I ~?j i... \6.3 j^^^^^^ YTD OVERTIME BUDGET VS ACTUAL ($ in Millions) 1
 1") OPERATING BUDGET REPORT ^ H FY2013 ^^ H OPERATING BUDGET($ in Millions) MTD Revenue Expense Subsidy Cost Recovery YTD Revenue Expense Subsidy Cost Recovery Jan-FY2012 Jan-FY2013 Variance FY13 Actual Actual
OPERATING BUDGET REPORT ^ H FY2013 ^^ H OPERATING BUDGET($ in Millions) MTD Revenue Expense Subsidy Cost Recovery YTD Revenue Expense Subsidy Cost Recovery Jan-FY2012 Jan-FY2013 Variance FY13 Actual Actual
BUDGETWATCH April 2015 Flash Report
 BUDGETWATCH April 2015 Flash Report Summary of March Budgetwatch (reporting on operations through February and subsidies through March): Overall, results through March were favorable mainly as a result
REGIONAL TRANSPORTATION DISTRICT, COLORADO AS OF DECEMBER 31, 2015
 AS OF DECEMBER 31, RTD Active Fleet of the District Fixed Route Bus Fleet: Number RTD Owned- Fixed Route Buses 40' Transit Coaches 620 Articulated Buses 110 Intercity Coaches 175 Mall Shuttles 37 30' Transit
CHICAGO TRANSIT AUTHORITY CHICAGO, ILLINOIS
 CHICAGO, ILLINOIS FINANCIAL STATEMENTS AND SUPPLEMENTARY INFORMATION Years Ended (With Independent Auditor s Report Thereon) Chicago, Illinois FINANCIAL STATEMENTS Years Ended TABLE OF CONTENTS Independent
METRO. Fiscal Year 2013 Monthly Board Report. December 2012 (First Quarter Fiscal Year-to-Date)
") METRO Fiscal Year 2013 Monthly Board Report Revenue Expense Ridership Performance (First Quarter Fiscal Year-to-Date) 1/14/2013 Table of Contents Section A Section B Section C Section D Section E Section
METRO Fiscal Year 2013 Monthly Board Report Revenue Expense Ridership Performance (First Quarter Fiscal Year-to-Date) 1/14/2013 Table of Contents Section A Section B Section C Section D Section E Section
CHICAGO TRANSIT AUTHORITY PRESIDENT S FY2017 BUDGET RECOMMENDATIONS. Analysis and Recommendations
 CHICAGO TRANSIT AUTHORITY PRESIDENT S FY2017 BUDGET RECOMMENDATIONS Analysis and Recommendations November 14, 2016 TABLE OF CONTENTS EXECUTIVE SUMMARY... 1 CIVIC FEDERATION POSITION... 3 ISSUES THE CIVIC
Proposed Budget Fiscal Year 2010 July 1, 2009 June 30, 2010
 Proposed Budget Fiscal Year 2010 July 1, 2009 June 30, 2010 Presented to the Board of Directors: Finance, Administration, and Oversight Committee January 8, 2009 1 General Manager s Overview And Summary
BUDGETWATCH September 2018 Flash Report
 September 2018 Flash Report (Forecast figures in this report refer to the 2018 Forecast) Overall Latest Condition (reporting on operations through August and subsidies through September): For reporting
METRO. Fiscal Year 2014 Monthly Board Report. May 2014
 METRO Fiscal Year 2014 Monthly Board Report Revenue Expense Ridership Performance 7/11/2014 Table of Contents Section A Section B Section C Section D Section E Section F Section G Section H Section I Section
($ in millions) Mid-Year
 Mid-Year") Table 1 Actual Variance Percent Actual Variance Percent Actual Variance Percent Revenue Farebox Revenue $379.0 $381.0 $2.0 0.5 $0.0 $0.0 $0.0 - $379.0 $381.0 $2.0 0.5 Vehicle Toll Revenue 122.6 125.2 2.5
Table 1 Actual Variance Percent Actual Variance Percent Actual Variance Percent Revenue Farebox Revenue $379.0 $381.0 $2.0 0.5 $0.0 $0.0 $0.0 - $379.0 $381.0 $2.0 0.5 Vehicle Toll Revenue 122.6 125.2 2.5
Operating Budget Report
 Operating Report Operating ($ in Millions) Operating Expenditures ($ in Millions) Jun-11 Jun-12 $ Percent Revenue $ 212,640 $ 217,643 $ 214,671 $ 2,973 1% Expense $ 359,102 $ 361,882 $ 366,332 $ 4,450
FY2018 Second Quarter Financial Update
 Finance and Committee Information Item III-A February 8, 2018 Second Quarter Financial Update 4 of 52 Washington Metropolitan Area Transit Authority Board Action/Information Summary Action Information
Operating Budget Report
 Operating Budget Report Operating Budget ($ in Millions) Operating Expenditures ($ in Millions) MTD May-FY2011 May - FY2012 Variance FY12 Actual Actual Budget $ Percent $140M Revenue $ 68,140 $ 70,480
BUDGETWATCH October 2018 Flash Report
 October 2018 Flash Report Overall Latest Condition (reporting on operations through September and subsidies through October): Passenger Revenues were slightly below the Forecast in September, marginally
Jul Aug Sept Oct Nov Dec Jan Feb Mar Apr May Jun
 REVENUE AND RIDERSHIP 4th Quarter FY2014 REVENUE (in Millions) $90M $85M $80M $75M $70M $65M $60M $55M $50M 79 77 74 74 72 70 FY2013 Actual FY2014 Budget FY2014 Actual 79 85 78 78 77 67 66 70 59 67 65
BUDGETWATCH March 2018 Flash Report
 March 2018 Flash Report Overall Latest Condition (reporting on operations through February and subsidies through March): Passenger revenues were $6 million unfavorable in February, increasing the unfavorable
FY2017 Year-End Financial Update
 Finance Committee Information Item III-A September 14, 2017 FY2017 Year-End Financial Update Washington Metropolitan Area Transit Authority Board Action/Information Summary Action Information MEAD Number:
REGIONAL TRANSPORTATION DISTRICT, COLORADO
 REGIONAL TRANSPORTATION DISTRICT, COLORADO Series 2004 Lease RTD Active Fleet of the District Fiscal Year Ended December 31, 2013 Fixed Route Bus Fleet Number RTD Owned Fixed Route Buses 40' Transit Coaches
Section I Year-to-date revenues collected and projected revenues and expenditures for the current fiscal year
 Report to Secretary of Administration and Finance and House and Senate Committees on Ways and Means regarding Revenue Projections and Changes to Fare and Fee Structure of the Massachusetts Bay Transportation
BUDGETWATCH September 2014 Flash Report
 BUDGETWATCH September 2014 Flash Report (Forecast figures in this report, except the Summary of June Budgetwatch, refer to the 2014 Forecast) Summary of June Budgetwatch (reporting on operations through
Budget Process Overview and Cost Allocation Methodology
 Budget Process Overview and Cost Allocation Methodology 1 Cost Allocation Agreement Guiding Principles Operate a consolidated regional public transportation system within and between the Participating
METRO. Fiscal Year 2015 Monthly Board Report. February 2015
 METRO Fiscal Year 2015 Monthly Board Report Revenue Expense Ridership Performance 4/2/2015 Table of Contents Section A Section B Section C Section D Section E Section F Section G Section H Section I Section
BUDGETWATCH May 2017 Flash Report
 May 2017 Flash Report Summary of April Budgetwatch (reporting on operations through March and subsidies through April): Overall, results were favorable for the month, and remained favorable YTD. Passenger
SOUTHEASTERN PENNSYLVANIA TRANSPORTATION AUTHORITY. Financial Statements June 30, 2018 and (With Independent Auditors Report Thereon)
") SOUTHEASTERN PENNSYLVANIA TRANSPORTATION AUTHORITY Financial Statements June 30, 2018 and 2017 (With Independent Auditors Report Thereon) SOUTHEASTERN PENNSYLVANIA TRANSPORTATION AUTHORITY YEARS ENDED
SOUTHEASTERN PENNSYLVANIA TRANSPORTATION AUTHORITY Financial Statements June 30, 2018 and 2017 (With Independent Auditors Report Thereon) SOUTHEASTERN PENNSYLVANIA TRANSPORTATION AUTHORITY YEARS ENDED
General Manager Remarks FMCB 10/6/2016
 General Manager Remarks FMCB 10/6/2016 Christopher T. Flynn 2 Education and performance awards MBA from the University of Massachusetts Bachelors of Arts in Economics from Merrimack College ACEC QBS AWARD
METRO. Fiscal Year 2013 Monthly Board Report. January 2013
 METRO Fiscal Year 2013 Monthly Board Report Revenue Expense Ridership Performance 2/14/2013 Table of Contents Section A Section B Section C Section D Section E Section F Section G Section H Section I Section
COMMUTER RAIL DIVISION OF THE REGIONAL TRANSPORTATION AUTHORITY AND THE NORTHEAST ILLINOIS REGIONAL COMMUTER RAILROAD CORPORATION
 Financial Statements and Supplementary Information (With Independent Auditors Report Thereon) Table of Contents Page(s) Independent Auditors Report 1 2 Management s Discussion and Analysis (Unaudited)
METRO. Fiscal Year 2013 Monthly Board Report. November 2012
 METRO Fiscal Year 2013 Monthly Board Report Revenue Expense Ridership Performance 12/13/2012 Table of Contents Section A Section B Section C Section D Section E Section F Section G Section H Section I
New York City Transit
 New York City Transit MTA New York City Transit 2008 Preliminary Budget July Financial Plan 2008 2011 MISSION STATEMENT The mission of MTA New York City Transit is to provide customers with safe, reliable
BUDGETWATCH May 2018 Flash Report
 May 2018 Flash Report Overall Latest Condition (reporting on operations through April and subsidies through May): Passenger revenues were $15.1 million unfavorable in April, increasing the unfavorable
Financial Management Report... 3
 November 13, 2013 Table of Contents Financial Management Report... 3 OPERATING FUNDS STATEMENT OF REVENUES & EXPENSES... 3 METROPOLITAN COUNCIL INVESTMENT PERFORMANCE SHORT-TERM PORTFOLIO... 4 METROPOLITAN
2019 Tax Budget Office of Management & Budget July 17, Greater Cleveland Regional Transit Authority
 Greater Cleveland Regional Transit Authority 2019 Tax Budget Office of Management & Budget July 17, 2018 Operating Budget Calendar o May o Jun o Jul Prepare 5 Yr. Financial Forecast Finalize 5 Yr Financial
COMMUTER RAIL DIVISION OF THE REGIONAL TRANSPORTATION AUTHORITY AND THE NORTHEAST ILLINOIS REGIONAL COMMUTER RAILROAD CORPORATION
 Financial Statements and Supplementary Information (With Independent Auditors Report Thereon) Table of Contents Page(s) Independent Auditors Report 1 2 Management s Discussion and Analysis (Unaudited)
Audit Presentation. May 25, Donna M. Gonser, CPA Christa L. Kopacz, CPA
 Audit Presentation May 25, 2012 Donna M. Gonser, CPA Christa L. Kopacz, CPA 403 Main St., Suite 430 Buffalo, NY 14203 716-856-3300 www.lumsdencpa.com 0 Engagement Scope Audit Scope and Reports Financial
METRO. Fiscal Year Monthly Performance Report. Revenue Expense Ridership Performance. November 2018 (Third Quarter Fiscal Year-to Date)
") METRO Fiscal Year 2019 Monthly Performance Report Revenue Expense Ridership Performance (Third Quarter Fiscal Year-to Date) 12/12/2018 Table of Contents Section A Section B Section C Section D Section
METRO Fiscal Year 2019 Monthly Performance Report Revenue Expense Ridership Performance (Third Quarter Fiscal Year-to Date) 12/12/2018 Table of Contents Section A Section B Section C Section D Section
METRO. Fiscal Year Monthly Performance Report. Revenue Expense Ridership Performance. February 2018 (First Quarter Fiscal Year-to Date)
") METRO Fiscal Year 2018 Monthly Performance Report Revenue Expense Ridership Performance (First Quarter Fiscal Year-to Date) 3/12/2018 Table of Contents Section A Section B Section C Section D Section E
METRO Fiscal Year 2018 Monthly Performance Report Revenue Expense Ridership Performance (First Quarter Fiscal Year-to Date) 3/12/2018 Table of Contents Section A Section B Section C Section D Section E
The Board of Directors announces the unaudited results for the Third Quarter and 9 Months ended 30 September 2013.
 SBS TRANSIT LTD Company Registration No: 199206653M Third Quarter 2013 Financial Statements The Board of Directors announces the unaudited results for the Third Quarter and 9 Months ended 30 September
Tipp City Exempted Village School District FIVE YEAR FORECAST July 1, 2014 June 30, 2019
 Tipp City Exempted Village School District FIVE YEAR FORECAST July 1, 2014 June 30, 2019 1 Assumptions Updated to include 2014 actual figures Tax revenue estimate for 2015 reflects Miami County Auditor
Quarterly Budget Report
 City of Chicago Quarterly Budget Report 1st & 2nd Quarters 2016 Mayor Rahm Emanuel Content and Purpose This report presents an overview of the City s operating revenues and expenditures for the first and
MBTA Advisory Board FY19 Massachusetts Bay Transportation Authority Operating Budget Oversight Report
 MBTA Advisory Board FY19 Massachusetts Bay Transportation Authority Operating Budget Oversight Report REPORT Offered by the Finance Committee March 29, 2018 FINANCE COMMITTEE MEMBERS John Buckley, Sr.
BOARD OF DIRECTORS REPORT
 BOARD OF DIRECTORS REPORT To: David A. Genova, General Manager Date: October 9, 2018 From: Heather McKillop, Chief Financial Officer GM Date: October 9, 2018 Board Meeting Date: October 16, 2018 Subject:
MIAMI PARKING AUTHORITY
 Revenue & Expenses Summary For the Five Months Ending February 28, 2019 Page 1 Adopted FY 2018 Actual Actual Actual Budget Actual Versus FY 2018 Versus 2019 Budget Year-To-Date $ $ $ $ % $ % Operating
CTA 2007 Contingency Plan
 CTA 2007 Contingency Plan JUST THE FACTS RTA Directive Unless the RTA Board makes a determination no later than July 1, 2007, that the funds identified as new transit funding are available for 2007 such
BUDGETWATCH April 2019 Flash Report
 April 2019 Flash Report Overall Latest Condition (reporting on operations through March and subsidies through April): Due to the early scheduling of the Finance Committee meeting, first-close preliminary
ADOPTED 2017 OPERATING BUDGET AND CAPITAL PROGRAM
 2017 Budget December 2016 ADOPTED 2017 OPERATING BUDGET AND CAPITAL PROGRAM Summary Briefing of the Adopted Operating Budgets, Two-Year Financial Plans, and Five-Year Capital Programs of the RTA, CTA,
BUDGETWATCH February 2016 Flash Report
 February 2016 Flash Report Overall Latest Condition (reporting on operations for January and subsidies through February): Overall, preliminary results were on target for the month and slightly favorable
FY2011 Budget Forum. District of Columbia. October 19, 2009
 FY2011 Budget Forum District of Columbia October 19, 2009 0 Meeting agenda What is Metro and what is the value of Metro service? What are the Fiscal Year 2011 budget challenges? What are the potential
October 2017 Monthly Financial Report
 GENERAL FUND OVERVIEW BTD Projection BTD Actuals BTD BTD % $ 450,269,075 $ 173,891,518 $ 181,528,672 $ 7,637,154 4.4% Expenditures $ 472,660,334 $ 180,624,776 $ 174,595,293 $ 6,029,483 3.3% Revenue Over
OPERATING BUDGET FY Actual Results (Unaudited) October 20, 2009 SAN FRANCISCO, CALIFORNIA
 October 20, 2009 SAN FRANCISCO, CALIFORNIA") OPERATING BUDGET FY (Unaudited) October 2, 29 SAN FRANCISCO, CALIFORNIA FY Results - Unaudited Revenues (millions) Revenue Categories (a) 27-28 Actual Results (b) Board Approved (c) Revised (d) Actual
OPERATING BUDGET FY (Unaudited) October 2, 29 SAN FRANCISCO, CALIFORNIA FY Results - Unaudited Revenues (millions) Revenue Categories (a) 27-28 Actual Results (b) Board Approved (c) Revised (d) Actual
Getting Metro Back on Track
 NVTC Presents: Getting Metro Back on Track A discussion with Virginia members of the WMATA Board @NovaTransit This forum is sponsored by the Northern Virginia Transportation Commission. Learn more about
Financial Update for the Period Ended April 7, 2018
 For Information Financial Update for the Period Ended April 7, 2018 Date: June 12, 2018 To: TTC Board From: Chief Financial Officer Summary The purpose of this report is to provide the Board with the operating
METRO. Fiscal Year 2017 Monthly Performance Report. Revenue Expense Ridership Performance. October 2016
 METRO Fiscal Year 2017 Monthly Performance Report Revenue Expense Ridership Performance 11/18/2016 Table of Contents Section A Section B Section C Section D Section E Section F Section G Section H Section
CHICAGO TRANSIT AUTHORITY PRESIDENT S FY2016 BUDGET RECOMMENDATIONS. Analysis and Recommendations
 CHICAGO TRANSIT AUTHORITY PRESIDENT S FY2016 BUDGET RECOMMENDATIONS Analysis and Recommendations November 13, 2015 TABLE OF CONTENTS EXECUTIVE SUMMARY... 1 CIVIC FEDERATION POSITION... 4 ISSUES THE CIVIC