Cash & Liquidity The chart below highlights CTA s cash position at February 2016 compared to February 2015.
|
|
|
- Hilary Stevenson
- 5 years ago
- Views:
Transcription

1 To: Chicago Transit Authority Board From: Jeremy Fine, Chief Financial Officer Re: Financial Results for February 2016 Date: April 6, 2016 I. Summary CTA s financial results are $2.7 million favorable for February due to favorable variances for all operating expense categories as well as the sale of surplus property that was not anticipated in the budget. Ridership for the month was 40.0 million and was 0.2 million less than budget. Ridership was 1.9 million or 4.9% higher than February 2015 due to milder weather and one additional weekday in February II. Cash & Liquidity The chart below highlights CTA s cash position at February 2016 compared to February Feb Feb Increase (Decrease) Unrestricted Cash $ $ $ 16.4 Damage Reserve $ (6.0) Funds Owed by RTA $ 39.0 Trust Portfolio Assets $ (255.7) Total Cash and Receivables $ $ 1,186.7 $ (206.3) CTA s total cash/receivables balance was equal to $980.4 million. Unrestricted cash was $16.4 million more than the prior year due to various receipts from the debt reserve substitution in August 2015, recent insurance settlements and other proceeds from land sales. The Damage Reserve is sufficiently funded and was $6.0 million lower than last year reflecting payouts for settled claims. Funds owed by the RTA were approximately $323.4 million which was $39.0 million more than the prior year. CTA continues to work closely with the RTA to monitor their receivable balance owed; Trust Portfolio Assets represents bond proceeds held in Trust for funding capital projects and making required debt service payments and therefore goes down when payments are made. 1
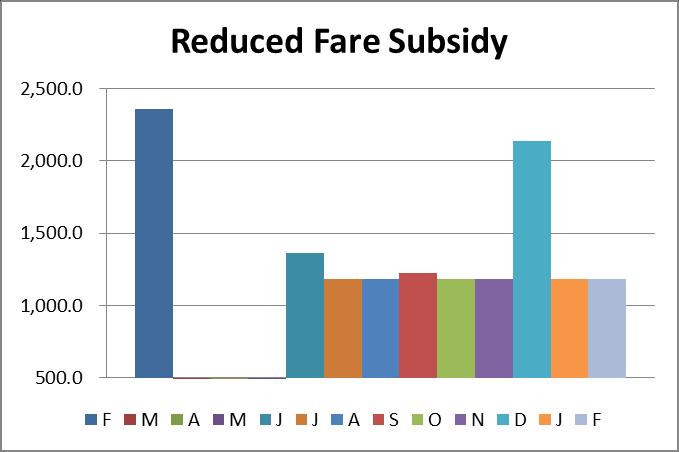
2 III. Revenue Fare & Pass Revenue $ 43,918 $ (367) $ 2,194 $ 88,795 $ (134) $ 2,589 Fare and pass revenue for February was $0.4 million unfavorable to budget and $2.2 million favorable to prior year. The favorable variance to prior year is due to a combination of milder weather and one additional weekday. The average fare for the month was $1.10 and was on par with budget and prior year. Year-to-date fare and pass revenue was $0.1 million less than budget but was $2.6 million more than prior year. Chicago experienced severe winter weather conditions in 2015, with the month of February tying the record for the coldest February ever in Chicago and was the third-snowiest February on record. The average fare for the year was $1.13 per ride and was $0.01 more than budget. Reduced Fare Subsidy $ 1,180 $ (1,180) $ (1,180) $ 2,360 $ (2,360) $ (2,360) Reduced Fare Subsidy was less than budget for the month and year-to-date by $1.2 million and $2.4 million, respectively, due to the uncertainty regarding the State budget and funding for the free and reduced fare mandates. Advertising, Charter, Concession $ 2,935 $ 300 $ 425 $ 5,633 $ 345 $ 833 Advertising, Charter and Concessions Revenue was $0.3 million more than budget for the month and year-to-date due to higher vehicle and platform advertising. The increase over prior year-to-date was also due to higher vehicle and platform advertising. 2
3 Investment income $ 139 $ 66 $ 71 $ 279 $ 133 $ (192) Investment income was higher than budget for the month primarily due to a higher yield portfolio and a better investment strategy through security selection. The decrease over prior year is due to year-end market value adjustments. Other Revenue $ 3,497 $ 1,444 $ 1,230 $ 5,423 $ 1,362 $ 868 Other Revenue was favorable to budget and prior year primarily due to the sale of surplus property. Total System Generated Revenue $ 51,669 $ 263 $ 2,740 $ 102,490 $ (655) $ 1,737 Total System-Generated Revenue was $0.3 million more than budget for the month and $2.7 million more than February 2015 primarily due to the sale of surplus property. The year-to-date is $0.7 million less than budget due to the uncertainty regarding the State budget and funding for the free and reduced fare mandates. The year-to-date systemgenerated revenue is $1.7 million more than prior year due higher farebox revenue, advertising revenue and sale of surplus property. IV. Expenses Labor $ 84,197 $ 273 $ (6,650) $ 168,195 $ (1,086) $ (8,080) Labor expense was $0.3 million favorable to budget for the month due to vacant positions. An additional work day in February 2016 versus prior year contributed to the unfavorable variance. Contractual wage increases that took effect in July 2015 and slightly higher fringe benefits in 2016 contributed to higher expenses compared to the prior February and to 2015 year-to-date. 3
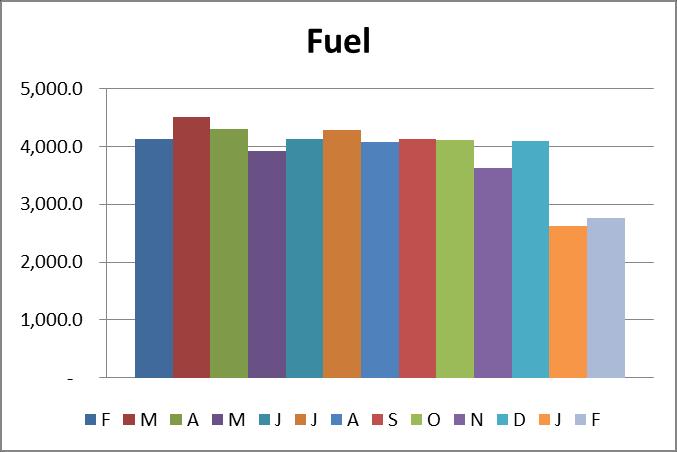
4 Material $ 6,433 $ 654 $ 622 $ 12,884 $ 1,245 $ 873 Material expense was $0.7 million favorable to budget for the month and $0.6 million lower than prior year due primarily to milder weather in 2016 and additional winter prep occurring at the end of Fuel $ 2,766 $ 250 $ 1,361 $ 5,392 $ 667 $ 3,262 Fuel for Revenue Equipment expense was $0.3 million favorable to budget for the month. As price is fixed, volume accounted for all of the variance to budget. Fuel expense is $3.3 million favorable to the prior year-to-date primarily due to the significant reduction in the price of diesel fuel, slightly lower usage and a small increase in fuel efficiency. Power $ 2,761 $ 358 $ 565 $ 5,863 $ 427 $ 476 The Electric Power for Revenue Equipment expense was $0.4 million and $0.6 million favorable to budget and prior year, respectively. $0.2 million was due to lower consumption than assumed in the budget and $0.2 was due to favorable prices. February was the second warmest February in the last ten years, contributing to lower consumption and price. Mild weather as well as two fewer billing days in February 2016 contributed to the positive variance versus the prior year. Purchase of Security Services $ 1,064 $ 161 $ 79 $ 2,267 $ 183 $ 23 Purchase of Security Services was $0.2 million favorable to budget for the month and year. 4
5 Other Expenses $ 22,792 $ 723 $ (1,008) $ 45,333 $ 1,083 $ 438 Other Expenses were favorable to budget by $0.7 million but were unfavorable to prior year by $1.0 million. The variance to budget and prior year was due to the timing of contractual expenses. Higher non-capital grant expenses of $0.5 million contributed to the negative variance in February versus the prior year. This is offset by a corresponding increase in revenue. Of the total monthly other expenses, the pension obligation bond expense is $10 million; the remaining expenses are for utilities, maintenance contracts, services, and other expenses. Total Operating Expenses $ 120,012 $ 2,418 $ (5,033) $ 239,932 $ 2,518 $ (3,008) Operating Expenses were $2.4 million favorable to budget for the month due to favorability in all expense categories. The unfavorable variance to prior year was due primarily to higher labor expense. V. Recovery Ratio Recovery Ratio 51.48% % 0.39 VI. Recovery Ratio, which measures the percentage of operating expenses CTA funds from internally generated revenues, was 51.48% for the month. This was favorable to budget by 1.49 percentage points. For the year-to-date the recovery ratio is 51.20%. Ridership Bus 21,467 (530) ,218 (1,056) (160) Rail 15, ,115 30, ,253 Rail to Rail Transfers 3, , Total 40,028 (191) 1,853 78,944 (549) 1,372 5
6 Ridership for the month of February was 40.0 million and was on 0.2 million lower than budget and was 1.9 million more than prior year. Calendar adjusted ridership was up 0.7% from prior year due to milder weather, an extra day due to leap year, an additional weekday compared to 2015, and two additional CPS school days this year. Ridership for the year-to-date was 78.9 million and was 0.5 million less than budget but was 1.4 million more than the prior year-to-date. Calendar adjusted ridership was up 0.9% from the prior year-to-date. More details on ridership can be found in the February Ridership Report. 6

7 Cash & Liquidity 7


8 Cash & Liquidity (cont d) Revenue 8
")

9 Revenue (cont d) 9
")


10 Revenue (cont d) 10

11 Expenses 11
")

12 Expenses (cont d) 12
")

13 Expenses (cont d) 13
Cash & Liquidity The chart below highlights CTA s cash position at January 2016 compared to January 2015.
 To: Chicago Transit Authority Board From: Tom McKone, Acting Chief Financial Officer Re: Financial Results for January 2016 Date: March 9, 2016 I. Summary CTA s financial results are $0.8 million unfavorable
Cash & Liquidity The chart below highlights CTA s cash position at February 2015 compared to February 2014.
 To: Chicago Transit Authority Board From: Ron DeNard, Chief Financial Officer Re: Financial Results for February 2015 Date: April 15, 2015 I. Summary CTA s financial results are favorable for the month
Cash & Liquidity The chart below highlights CTA s cash position at July 2016 compared to July 2015.
 To: Chicago Transit Authority Board From: Jeremy Fine, Chief Financial Officer Re: Financial Results for July 2016 Date: September 14, 2016 I. Summary CTA s financial results are $0.4 million favorable
Cash & Liquidity The chart below highlights CTA s cash position at February 2017 compared to February 2016.
 To: Chicago Transit Authority Board From: Jeremy Fine, Chief Financial Officer Re: Financial Results for February 2017 Date: April 5, 2017 I. Summary CTA s financial results are $0.3 million favorable
Cash & Liquidity The chart below highlights CTA s cash position at March 2017 compared to March 2016.
 To: Chicago Transit Authority Board From: Jeremy Fine, Chief Financial Officer Re: Financial Results for March 2017 Date: May 10, 2017 I. Summary CTA s financial results are $0.6 million favorable to budget
Cash & Liquidity The chart below highlights CTA s cash position at September 2017 compared to September 2016.
 To: Chicago Transit Authority Board From: Jeremy Fine, Chief Financial Officer Re: Financial Results for September 2017 Date: November 15, 2017 I. Summary CTA s financial results are $7.7 million favorable
CTA s financial results are unfavorable by $0.5 million and $1.2 million for the month and year.
 To: Chicago Transit Authority Board From: Ron DeNard, Chief Financial Officer Re: Financial Results for May 2015 Date: July 13, 2015 I. Summary CTA s financial results are unfavorable by $0.5 million and
Cash & Liquidity The chart below highlights CTA s cash position at December 2017 compared to December 2016.
 To: Chicago Transit Authority Board From: Jeremy Fine, Chief Financial Officer Re: Financial Results for December 2017 Date: February 14, 2018 I. Summary CTA s financial results are $4.7 million favorable
Cash & Liquidity The chart below highlights CTA s cash position at July 2015 compared to July 2014.
 To: Chicago Transit Authority Board From: Tom McKone, Acting CFO Re: Financial Results for July 2015 Date: September 4, 2015 I. Summary CTA s financial results are favorable by $1.9 million for the month
The year to date is less than budget and prior year by 15.4 million and 11.6 million, respectively.
 To: Chicago Transit Authority Board From: Jeremy Fine, Chief Financial Officer Re: Financial Results for September 2016 Date: November 16, 2016 I. Summary CTA s financial results are $0.3 million unfavorable
Cash & Liquidity The chart below highlights CTA s cash position at March 2018 compared to March 2017.
 To: Chicago Transit Authority Board From: Jeremy Fine, Chief Financial Officer Re: Financial Results for March 2018 Date: May 9, 2018 I. Summary CTA s financial results are $0.9 million favorable to budget
Cash & Liquidity The chart below highlights CTA s cash position at January 2018 compared to January 2017.
 To: Chicago Transit Authority Board From: Jeremy Fine, Chief Financial Officer Re: Financial Results for January 2018 Date: March 14, 2018 I. Summary CTA s financial results are $1.7 million unfavorable
Cash & Liquidity The chart below highlights CTA s cash position at June 2018 compared to June 2017.
 To: Chicago Transit Authority Board From: Jeremy Fine, Chief Financial Officer Re: Financial Results for June 2018 Date: August 15, 2018 I. Summary CTA s financial results are unfavorable to budget for
Cash & Liquidity The chart below highlights CTA s cash position at August 2018 compared to August 2017.
 To: Chicago Transit Authority Board From: Jeremy Fine, Chief Financial Officer Re: Financial Results for August 2018 Date: October 10, 2018 I. Summary CTA s financial results are favorable to budget for
Ridership for the month is 39.4 million and is on par with budget. Ridership is 1.4 million or 3.6% higher than January 2014.
 To: Chicago Transit Authority Board From: Ron DeNard, Chief Financial Officer Re: Financial Results for January 2015 Date: March 6, 2015 I. Summary CTA s financial results are $2.0 million favorable for
Cash & Liquidity The chart below highlights CTA s cash position at June 2014 compared to June 2013.
 To: Chicago Transit Authority Board From: Ron DeNard, Chief Financial Officer Re: Financial Results for June 2014 Date: August 13, 2014 I. Summary CTA s financial results are $4.0 million favorable for
Cash & Liquidity The chart below highlights CTA s cash position at November 2014 compared to November 2013.
 To: Chicago Transit Authority Board From: Ronald E. DeNard, Chief Financial Officer Re: Financial Results for November 2014 Date: January 12, 2015 I. Summary CTA s financial results are $1.9 million unfavorable
Cash & Liquidity The chart below highlights CTA s cash position at May 2014 compared to May 2013.
 To: Chicago Transit Authority Board From: Ron DeNard, Chief Financial Officer Re: Financial Results for May 2014 Date: July 16, 2014 I. Summary CTA s financial results are $5.6 million favorable for May
1 ST QUARTER 2017 QUARTERLY FINANCIAL AND PERFORMANCE REPORT
 1 ST QUARTER 2017 QUARTERLY FINANCIAL AND PERFORMANCE REPORT May 2017 0 1 st Quarter 2017 Financial and Performance Report Table of Contents Executive Summary... 2 Environmental Factors... 4 Ridership...
Suburban Service and Regional ADA Budget Results January 2019
 and Regional Results January 2019 Department of Internal Services Issued March 2019 Performance At-A-Glance January 2019 (Millions) $25 $20 $17 $15 $10 $5 $0 ($5) Generated Public Expenses Net Results
BUDGETWATCH March 2019 Flash Report
 March 2019 Flash Report Overall Latest Condition (reporting on operations through February and subsidies through March): Overall, YTD preliminary net results were favorable mainly reflecting lower operating
FY2014 Operating Budget Performance Report
 Finance & Administration Committee Information Item IV-C September 11, 2014 FY2014 Operating Budget Performance Report Washington Metropolitan Area Transit Authority Board Action/Information Summary Action
CHICAGO TRANSIT AUTHORITY. FINANCIAL STATEMENTS AND SUPPLEMENTARY INFORMATION December 31, 2010 and 2009 (With Independent Auditors Report Thereon)
") FINANCIAL STATEMENTS AND SUPPLEMENTARY INFORMATION (With Independent Auditors Report Thereon) Chicago, Illinois FINANCIAL STATEMENTS CONTENTS Independent Auditors Report... 1 Management s Discussion and
FINANCIAL STATEMENTS AND SUPPLEMENTARY INFORMATION (With Independent Auditors Report Thereon) Chicago, Illinois FINANCIAL STATEMENTS CONTENTS Independent Auditors Report... 1 Management s Discussion and
CHICAGO TRANSIT AUTHORITY PRESIDENT S FY2017 BUDGET RECOMMENDATIONS. Analysis and Recommendations
 CHICAGO TRANSIT AUTHORITY PRESIDENT S FY2017 BUDGET RECOMMENDATIONS Analysis and Recommendations November 14, 2016 TABLE OF CONTENTS EXECUTIVE SUMMARY... 1 CIVIC FEDERATION POSITION... 3 ISSUES THE CIVIC
CHICAGO TRANSIT AUTHORITY. FINANCIAL STATEMENTS AND SUPPLEMENTARY INFORMATION December 31, 2011 and 2010 (With Independent Auditors Report Thereon)
") FINANCIAL STATEMENTS AND SUPPLEMENTARY INFORMATION (With Independent Auditors Report Thereon) Chicago, Illinois FINANCIAL STATEMENTS CONTENTS Independent Auditors Report... 1 Management s Discussion and
FINANCIAL STATEMENTS AND SUPPLEMENTARY INFORMATION (With Independent Auditors Report Thereon) Chicago, Illinois FINANCIAL STATEMENTS CONTENTS Independent Auditors Report... 1 Management s Discussion and
1ST QUARTER May 2018
 1ST QUARTER 2018 May 2018 0 1 st Quarter 2018 Financial and Performance Report Table of Contents Executive Summary... 2 Environmental Factors... 4 Ridership... 6 Peer Ridership Comparison... 7 Operating
Operating Budget. Third Quarter Financial Report (July 2005 March 2006)
") Third Quarter Financial Report (July 2005 March 2006) INDEX A. Executive Summary...page 2 B. Revenue and Expense Analysis...page 3 C. Budget Variance Reports...page 14 D. Ridership and Performance Measures...page
Third Quarter Financial Report (July 2005 March 2006) INDEX A. Executive Summary...page 2 B. Revenue and Expense Analysis...page 3 C. Budget Variance Reports...page 14 D. Ridership and Performance Measures...page
4 TH QUARTER 2017 QUARTERLY FINANCIAL AND PERFORMANCE REPORT
 4 TH QUARTER 2017 QUARTERLY FINANCIAL AND PERFORMANCE REPORT February 2018 0 4 th Quarter 2017 Financial and Performance Report Table of Contents Executive Summary... 2 Environmental Factors... 4 Ridership...
3RD QUARTER November 2018
 3RD QUARTER 2018 November 2018 0 Quarterly Financial and Performance Report 3rd Quarter 2018 3rd Quarter 2018 Financial and Performance Report Table of Contents Executive Summary... 2 Environmental Factors...
3 RD QUARTER 2017 QUARTERLY FINANCIAL AND PERFORMANCE REPORT
 3 RD QUARTER 2017 QUARTERLY FINANCIAL AND PERFORMANCE REPORT November 2017 0 3 rd Quarter 2017 Financial and Performance Report Table of Contents Executive Summary... 2 Environmental Factors... 4 Ridership...
2 ND QUARTER 2017 QUARTERLY FINANCIAL AND PERFORMANCE REPORT
 2 ND QUARTER 2017 QUARTERLY FINANCIAL AND PERFORMANCE REPORT August 2017 0 2 nd Quarter 2017 Financial and Performance Report Table of Contents Executive Summary... 2 Environmental Factors... 4 Ridership...
4TH QUARTER 2016 QUARTERLY FINANCIAL AND PERFORMANCE REPORT
 4TH QUARTER 2016 QUARTERLY FINANCIAL AND PERFORMANCE REPORT February 2017 0 Quarterly Financial and Performance Report 4th Quarter 2016 4th Quarter 2016 Financial and Performance Report Table of Contents
Operating Budget Stability
 Operating Budget Stability March Financial Update Report to Agenda Executive Summary March Performance Against FY16 Budget March Performance Against Same Period Last Year Appendix Financial Detail: March
3 RD QUARTER 2016 QUARTERLY FINANCIAL AND PERFORMANCE REPORT
 3 RD QUARTER 2016 QUARTERLY FINANCIAL AND PERFORMANCE REPORT November 2016 0 3 rd Quarter 2016 Financial and Performance Report Table of Contents Executive Summary... 1 Environmental Factors... 3 Ridership...
REGIONAL TRANSPORTATION DISTRICT, COLORADO AS OF DECEMBER 31, 2015
 AS OF DECEMBER 31, RTD Active Fleet of the District Fixed Route Bus Fleet: Number RTD Owned- Fixed Route Buses 40' Transit Coaches 620 Articulated Buses 110 Intercity Coaches 175 Mall Shuttles 37 30' Transit
Operating Budget. Second Quarter Financial Report
 Second Quarter Financial Report INDEX A. Executive Summary... A-1 B. Revenue and Expense Analysis... B-1 C. Budget Variance Reports... C-1 D. Ridership and Performance Measures... D-1 Board Budget Committee
FY2018 Third Quarter Financial Update
 Finance and Committee Information Item IV-A May 10, 2018 Third Quarter Financial Update Page 30 of 53 Washington Metropolitan Area Transit Authority Board Action/Information Summary Action Information
BUDGETWATCH March 2016 Flash Report
 March 2016 Flash Report Summary of February Budgetwatch (reporting on operations through January and subsidies through February): Overall results through February were slightly favorable. Net operating
CHICAGO TRANSIT AUTHORITY CHICAGO, ILLINOIS
 CHICAGO, ILLINOIS FINANCIAL STATEMENTS AND SUPPLEMENTARY INFORMATION Years Ended (With Independent Auditor s Report Thereon) Chicago, Illinois FINANCIAL STATEMENTS Years Ended TABLE OF CONTENTS Independent
Financial Practices and Reporting Review Committee. Committee Meeting July 15, 2011
 Financial Practices and Reporting Review Committee Committee Meeting July 15, 2011 Finance Presentation Metra Financial Practices & Reporting Review Committee July 15, 2011 Presented by Jim Mickus Budget
REGIONAL TRANSPORTATION DISTRICT, COLORADO
 REGIONAL TRANSPORTATION DISTRICT, COLORADO Series 2004 Lease RTD Active Fleet of the District Fiscal Year Ended December 31, 2013 Fixed Route Bus Fleet Number RTD Owned Fixed Route Buses 40' Transit Coaches
Budget Process Overview and Cost Allocation Methodology
 Budget Process Overview and Cost Allocation Methodology 1 Cost Allocation Agreement Guiding Principles Operate a consolidated regional public transportation system within and between the Participating
Financial Report - FY 2017 Year to Date May 31, 2017
 Financial Report - FY 2017 Year to Date July 19, 2017 1 Major Highlights Revenue Sales tax remittances received through YTD April 2017 are 4.2% higher than YTD April 2016 Plaza Saltillo lease income budgeted
Chicago Transit Authority Financial Statements for the Years Ended December 31, 1999 and 1998 and Supplementary Information and Independent Auditors'
 Chicago Transit Authority Financial Statements for the Years Ended December 31, 1999 and 1998 and Supplementary Information and Independent Auditors' Report TABLE OF CONTENTS Page INDEPENDENT AUDITORS'
($ in millions) Mid-Year
 Mid-Year") Table 1 Actual Variance Percent Actual Variance Percent Actual Variance Percent Revenue Farebox Revenue $379.0 $381.0 $2.0 0.5 $0.0 $0.0 $0.0 - $379.0 $381.0 $2.0 0.5 Vehicle Toll Revenue 122.6 125.2 2.5
Table 1 Actual Variance Percent Actual Variance Percent Actual Variance Percent Revenue Farebox Revenue $379.0 $381.0 $2.0 0.5 $0.0 $0.0 $0.0 - $379.0 $381.0 $2.0 0.5 Vehicle Toll Revenue 122.6 125.2 2.5
BUDGETWATCH October 2018 Flash Report
 October 2018 Flash Report Overall Latest Condition (reporting on operations through September and subsidies through October): Passenger Revenues were slightly below the Forecast in September, marginally
CTA 2007 Contingency Plan
 CTA 2007 Contingency Plan JUST THE FACTS RTA Directive Unless the RTA Board makes a determination no later than July 1, 2007, that the funds identified as new transit funding are available for 2007 such
Section I Year-to-date revenues collected and projected revenues and expenditures for the current fiscal year
 Report to Secretary of Administration and Finance and House and Senate Committees on Ways and Means regarding Revenue Projections and Changes to Fare and Fee Structure of the Massachusetts Bay Transportation
METRO. Fiscal Year 2012 Monthly Board Report. December 2011 (First Quarter Fiscal Year-to-Date)
") METRO Fiscal Year 2012 Monthly Board Report Revenue Expense Ridership Performance (First Quarter Fiscal Year-to-Date) 1/27/2012 Table of Contents Section A Section B Section C Section D Section E Section
METRO Fiscal Year 2012 Monthly Board Report Revenue Expense Ridership Performance (First Quarter Fiscal Year-to-Date) 1/27/2012 Table of Contents Section A Section B Section C Section D Section E Section
Chicago Transit Authority Financial Statements for the Years Ended December 31, 2000 and 1999 and Supplementary Information and Independent Auditors'
 Chicago Transit Authority Financial Statements for the Years Ended December 31, 2000 and 1999 and Supplementary Information and Independent Auditors' Report TABLE OF CONTENTS Page INDEPENDENT AUDITORS'
COMMUTER RAIL DIVISION OF THE REGIONAL TRANSPORTATION AUTHORITY AND THE NORTHEAST ILLINOIS REGIONAL COMMUTER RAILROAD CORPORATION
 Financial Statements and Supplementary Information (With Independent Auditors Report Thereon) Table of Contents Page(s) Independent Auditors Report 1 2 Management s Discussion and Analysis (Unaudited)
Operating Budget Stability Q1 FY17 Financial Update
 Operating Budget Stability Q1 FY17 Financial Update Report to Fiscal and Management Control Board Without action, operating deficit was on track to reach $427M by FY20 STATUS QUO FY17 PRO FORMA 8.1.2015
BUDGETWATCH March 2018 Flash Report
 March 2018 Flash Report Overall Latest Condition (reporting on operations through February and subsidies through March): Passenger revenues were $6 million unfavorable in February, increasing the unfavorable
METRO. Fiscal Year 2012 Monthly Board Report. September 2012 (Fourth Quarter Fiscal Year-to-Date)
") METRO Fiscal Year 2012 Monthly Board Report Revenue Expense Ridership Performance (Fourth Quarter Fiscal Year-to-Date) This report is based on a preliminary closing of the year-end financials for FY2012
METRO Fiscal Year 2012 Monthly Board Report Revenue Expense Ridership Performance (Fourth Quarter Fiscal Year-to-Date) This report is based on a preliminary closing of the year-end financials for FY2012
Fare Policy. Discussion Document November 23, 2015
 Fare Policy Discussion Document November 23, 2015 Key legislation regarding fare levels 2013 Session Law Chapter 46 SECTION 6A. Set goal of an increase in the farebox recovery ratio of at least 10 per
FY2017 Year-End Financial Update
 Finance Committee Information Item III-A September 14, 2017 FY2017 Year-End Financial Update Washington Metropolitan Area Transit Authority Board Action/Information Summary Action Information MEAD Number:
OPERATING BUDGET REPORT
 OPERATING BUDGET REPORT OPERATING BUDGET ($ in Millions) MTD Nov-FY2012 Nov-FY2013 Actual Actual Budget $ Percent Revenue $ 63.0 $ 65.7 $ 68.3 $ (2.7) -3.9% Expense $ 107.6 $ 124.8 $ 129.8 $ 5.0 3.8% Subsidy
BUDGETWATCH April 2019 Flash Report
 April 2019 Flash Report Overall Latest Condition (reporting on operations through March and subsidies through April): Due to the early scheduling of the Finance Committee meeting, first-close preliminary
COMMUTER RAIL DIVISION OF THE REGIONAL TRANSPORTATION AUTHORITY AND THE NORTHEAST ILLINOIS REGIONAL COMMUTER RAILROAD CORPORATION
 Financial Statements and Supplementary Information (With Independent Auditors Report Thereon) Table of Contents Page(s) Independent Auditors Report 1 2 Management s Discussion and Analysis (Unaudited)
BUDGETWATCH May 2018 Flash Report
 May 2018 Flash Report Overall Latest Condition (reporting on operations through April and subsidies through May): Passenger revenues were $15.1 million unfavorable in April, increasing the unfavorable
METRO. Fiscal Year 2013 Monthly Board Report. December 2012 (First Quarter Fiscal Year-to-Date)
") METRO Fiscal Year 2013 Monthly Board Report Revenue Expense Ridership Performance (First Quarter Fiscal Year-to-Date) 1/14/2013 Table of Contents Section A Section B Section C Section D Section E Section
METRO Fiscal Year 2013 Monthly Board Report Revenue Expense Ridership Performance (First Quarter Fiscal Year-to-Date) 1/14/2013 Table of Contents Section A Section B Section C Section D Section E Section
BUDGETWATCH April 2015 Flash Report
 BUDGETWATCH April 2015 Flash Report Summary of March Budgetwatch (reporting on operations through February and subsidies through March): Overall, results through March were favorable mainly as a result
JANUARY FY Monthly Financial and Operational Report. Rhode Island Public Transit Authority
 JANUARY FY 2019 Monthly Financial and Operational Report Rhode Island Public Transit Authority Financial Summary As of December FY 2019 Budget Actual Variance % Variance Revenues $ 64,896,602 $ 58,000,401
New York City Transit
 New York City Transit MTA New York City Transit 2008 Preliminary Budget July Financial Plan 2008 2011 MISSION STATEMENT The mission of MTA New York City Transit is to provide customers with safe, reliable
MTA Long Island Rail Road
 MTA Long Island Rail Road Budget July Financial Plan -2008 MISSION STATEMENT The mission of the MTA Long Island Rail Road is to provide a safe, accessible, clean, cost-effective, customer-focused rail
Operating Budget Report
 Operating Budget Report MTD Operating Budget ($ in Millions) Sept-FY2012 Sept-FY2013 Variance FY13 Actual Actual Budget $ Percent $140M Operating Expenditures ($ in Millions) Revenue $ 67 $ 68 $ 71 $ (3)
BUDGETWATCH May 2017 Flash Report
 May 2017 Flash Report Summary of April Budgetwatch (reporting on operations through March and subsidies through April): Overall, results were favorable for the month, and remained favorable YTD. Passenger
SOUTHEASTERN PENNSYLVANIA TRANSPORTATION AUTHORITY. Financial Statements June 30, 2018 and (With Independent Auditors Report Thereon)
") SOUTHEASTERN PENNSYLVANIA TRANSPORTATION AUTHORITY Financial Statements June 30, 2018 and 2017 (With Independent Auditors Report Thereon) SOUTHEASTERN PENNSYLVANIA TRANSPORTATION AUTHORITY YEARS ENDED
SOUTHEASTERN PENNSYLVANIA TRANSPORTATION AUTHORITY Financial Statements June 30, 2018 and 2017 (With Independent Auditors Report Thereon) SOUTHEASTERN PENNSYLVANIA TRANSPORTATION AUTHORITY YEARS ENDED
BUDGETWATCH January 2019 Flash Report Special 2018 Year-End Flash Report
 January 2019 Flash Report Special 2018 Year-End Flash Report Overall The January Budgetwatch is a flash look, focusing on some very preliminary 2018 actual revenue results, along with debt service, compared
METRO. Fiscal Year 2014 Monthly Board Report. May 2014
 METRO Fiscal Year 2014 Monthly Board Report Revenue Expense Ridership Performance 7/11/2014 Table of Contents Section A Section B Section C Section D Section E Section F Section G Section H Section I Section
1. approve the 2001 TTC Operating Budget (summarized in Appendix A) as described in this report and the following accompanying reports:
 as described in this report and the following accompanying reports:") MEETING DATE: February 16, 2001 SUBJECT: 2001 TTC Operating Budget RECOMMENDATION It is recommended that the Commission: 1. approve the 2001 TTC Operating Budget (summarized in Appendix A) as described
MEETING DATE: February 16, 2001 SUBJECT: 2001 TTC Operating Budget RECOMMENDATION It is recommended that the Commission: 1. approve the 2001 TTC Operating Budget (summarized in Appendix A) as described
Operating Budget Report
 Operating Budget Report MTD Operating Budget ($ in Millions) Oct-FY2012 Oct-FY2013 Variance FY13 Actual Actual Budget $ Percent $140M Operating Expenditures ($ in Millions) Revenue $ 67 $ 70 $ 79 $ (8)
ADOPTED 2017 OPERATING BUDGET AND CAPITAL PROGRAM
 2017 Budget December 2016 ADOPTED 2017 OPERATING BUDGET AND CAPITAL PROGRAM Summary Briefing of the Adopted Operating Budgets, Two-Year Financial Plans, and Five-Year Capital Programs of the RTA, CTA,
Operating Budget Report
 Operating Report Operating ($ in Millions) Operating Expenditures ($ in Millions) Jun-11 Jun-12 $ Percent Revenue $ 212,640 $ 217,643 $ 214,671 $ 2,973 1% Expense $ 359,102 $ 361,882 $ 366,332 $ 4,450
MONTHLY FINANCIAL STATUS JUNE 2018
 (Millions) MONTHLY FINANCIAL STATUS To: Dave Genova, General Manager and CEO ACTION DISCUSSION INFO From: Heather McKillop, CFO and AGM Administration x Date: July 10, VS. BUDGET YTD VS. BUDGET JUNE VS.
February 2016 Financial Report
 2016 February 2016 Financial Report Capital Metropolitan Transportation Authority 4/13/2016 Table of Contents SUMMARY REPORT Budgetary Performance - Revenue 2 - Sales Tax Revenue 5 - Operating Expenses
- II OPERATING BUDGET REPORT ^ H FY2013 ^^ H. ««-ms. I ~?j i... \6.3 j^^^^^^ YTD OVERTIME BUDGET VS ACTUAL ($ in Millions) 1
 1") OPERATING BUDGET REPORT ^ H FY2013 ^^ H OPERATING BUDGET($ in Millions) MTD Revenue Expense Subsidy Cost Recovery YTD Revenue Expense Subsidy Cost Recovery Jan-FY2012 Jan-FY2013 Variance FY13 Actual Actual
OPERATING BUDGET REPORT ^ H FY2013 ^^ H OPERATING BUDGET($ in Millions) MTD Revenue Expense Subsidy Cost Recovery YTD Revenue Expense Subsidy Cost Recovery Jan-FY2012 Jan-FY2013 Variance FY13 Actual Actual
FY2018 Second Quarter Financial Update
 Finance and Committee Information Item III-A February 8, 2018 Second Quarter Financial Update 4 of 52 Washington Metropolitan Area Transit Authority Board Action/Information Summary Action Information
METRO. Fiscal Year 2015 Monthly Board Report. February 2015
 METRO Fiscal Year 2015 Monthly Board Report Revenue Expense Ridership Performance 4/2/2015 Table of Contents Section A Section B Section C Section D Section E Section F Section G Section H Section I Section
MONTHLY FINANCIAL STATUS AUGUST 2018
 (Millions) MONTHLY FINANCIAL STATUS To: Dave Genova, General Manager and CEO ACTION DISCUSSION INFO From: Heather McKillop, CFO and AGM Administration x Date: October 9, VS. BUDGET YTD VS. BUDGET AUGUST
BUDGETWATCH September 2014 Flash Report
 BUDGETWATCH September 2014 Flash Report (Forecast figures in this report, except the Summary of June Budgetwatch, refer to the 2014 Forecast) Summary of June Budgetwatch (reporting on operations through
2019 Tax Budget Office of Management & Budget July 17, Greater Cleveland Regional Transit Authority
 Greater Cleveland Regional Transit Authority 2019 Tax Budget Office of Management & Budget July 17, 2018 Operating Budget Calendar o May o Jun o Jul Prepare 5 Yr. Financial Forecast Finalize 5 Yr Financial
Adopted 2018 OPERATING BUDGET Two-Year Financial Plan and Five-Year CAPITAL PROGRAM
 2018 Adopted 2018 OPERATING BUDGET Two-Year Financial Plan and Five-Year CAPITAL PROGRAM MOVING YOU Northeastern Illinois December 2017 RTA Board of Directors Kirk Dillard Chairman Anthony K. Anderson
METRO MONTHLY BOARD REPORT
 METRO Revenue Expenses Service Performance Fiscal Year FY2011 Table of Contents Section A Section B Section C Section D Section E Section F Section G Section H Summary Sales Tax Revenue Fare Revenue Operating
Capital Metropolitan Transportation Authority
 Capital Metropolitan Transportation Authority Monthly Performance Report (Covering Performance Data Through March and April 2010) Capital Metropolitan Transportation Authority 1 Performance Report Contents
Capital Metropolitan Transportation Authority Monthly Performance & Financial Report For Period Ending October 31, 2012 Soft Close
 Capital Metropolitan Transportation Authority Monthly Performance & Financial Report For Period Ending October 31, 2012 Soft Close Table of Contents SUMMARY REPORT Financial Performance -Sales Tax 3 -Other
MTA 2018 Adopted Budget
 BUD17013_Budget2018_Cover_Budget cover 1/16/18 10:00 AM Page 1 MTA 2018 Adopted Budget February Financial Plan 2018 2021 February 2018 TABLE OF CONTENTS I. Overview... I-1 II. MTA Consolidated Financial
New Jersey Turnpike Authority Financial Summary For the Three Months Ended March 31, 2018
 New Jersey Turnpike Authority Financial Summary ACTUAL REVENUE - January - March $ 418,436,000 ESTIMATED REVENUE - April - December 1,369,339,000 Budgeted Annual $ 1,787,775,000 BUDGETED ANNUAL OPERATING
PROPOSED FISCAL YEAR 2011 BUDGET. Testimony of. Richard Sarles, General Manager. Washington Metropolitan Area Transit Authority.
 PROPOSED FISCAL YEAR 2011 BUDGET Testimony of Richard Sarles, General Manager Washington Metropolitan Area Transit Authority Before the Council of the District of Columbia Committee on Public Works and
Financial Update for the Period Ended April 7, 2018
 For Information Financial Update for the Period Ended April 7, 2018 Date: June 12, 2018 To: TTC Board From: Chief Financial Officer Summary The purpose of this report is to provide the Board with the operating
SIX MONTHS ENDED MARCH
 SIX MONTHS ENDED MARCH 2011 Orlando Utilities Commission Table of Contents Management s Discussion and Analysis 1 Statements of Revenues, Expenses and Changes in Net Assets based on Budget - Unaudited
METRO. Fiscal Year 2013 Monthly Board Report. November 2012
 METRO Fiscal Year 2013 Monthly Board Report Revenue Expense Ridership Performance 12/13/2012 Table of Contents Section A Section B Section C Section D Section E Section F Section G Section H Section I
Washington Metropolitan Area Transit Authority Metro Budget Overview
 Washington Metropolitan Area Transit Authority Metro Budget Overview February 2011 Metro 10,877 Employees (10,974 budgeted) 1,491 Buses 588 Escalators and 237 Elevators 106 Miles of Track 92 Traction Power
III. Major Assumptions Projections
 III. Major Assumptions 2004-2008 Projections Utilization (Revenue, Ridership, Vehicle Traffic) UTILIZATION Baseline Before Gap-Closing Actions 2004 Ridership and Revenue In 2004, ridership on the various
OCTOBER FY Monthly Financial and Operational Report. Rhode Island Public Transit Authority
 OCTOBER FY 2019 Monthly Financial and Operational Report Rhode Island Public Transit Authority Financial Summary As of September FY 2019 Year to Date Budget Actual Variance % Variance $ 32,562,540 $ 28,304,800
Financial Report Fiscal Year 2018
 Financial Report Fiscal Year 2018 Year to Date March 31, 2018 Presented on May 21, 2018 1 Major Highlights Revenue FY2018 sales tax revenue budgeted at 2.5% growth over FY2017 Sales tax remittances received
BUDGETWATCH September 2018 Flash Report
 September 2018 Flash Report (Forecast figures in this report refer to the 2018 Forecast) Overall Latest Condition (reporting on operations through August and subsidies through September): For reporting
Jefferson County Public Transportation Benefit Area (Jefferson Transit Authority)
") Financial Statements Audit Report Jefferson County Public Transportation Benefit Area (Jefferson Transit Authority) For the period January 1, 2016 through December 31, 2016 Published August 3, 2017 Report
Financial Statements Audit Report Jefferson County Public Transportation Benefit Area (Jefferson Transit Authority) For the period January 1, 2016 through December 31, 2016 Published August 3, 2017 Report
Annual Performance Report Proposal MassDOT SFY Prepared by OPM&I November, 2015
 Annual Performance Report Proposal MassDOT SF 2015 Prepared by OPM&I ovember, 2015 Legislative Mandate Acts of 2009 Established the Office of Performance Management & Innovation Charged with working with
Jul Aug Sept Oct Nov Dec Jan Feb Mar Apr May Jun
 REVENUE AND RIDERSHIP 4th Quarter FY2014 REVENUE (in Millions) $90M $85M $80M $75M $70M $65M $60M $55M $50M 79 77 74 74 72 70 FY2013 Actual FY2014 Budget FY2014 Actual 79 85 78 78 77 67 66 70 59 67 65