Cash & Liquidity The chart below highlights CTA s cash position at March 2017 compared to March 2016.
|
|
|
- Candice Bryan
- 6 years ago
- Views:
Transcription

1 To: Chicago Transit Authority Board From: Jeremy Fine, Chief Financial Officer Re: Financial Results for March 2017 Date: May 10, 2017 I. Summary CTA s financial results are $0.6 million favorable to budget for March primarily due to lower operating expenses. Results are $0.3 million unfavorable to budget for year-to-date due to lower fare, pass, and reduced fare revenue. Ridership for the month was 41.7 million and was 2.0 million less than budget. Ridership was 2.0 million or 4.5% less than March Low gas prices and competition from rideshare services such as Uber and Lyft contributed to the loss. II. Cash & Liquidity The chart below highlights CTA s cash position at March 2017 compared to March March March Increase (Decrease) Unrestricted Cash $ $ $ 75.7 Damage Reserve $ 4.9 Funds Owed by RTA $ (30.2) Trust Portfolio Assets $ Total Cash and Receivables $ 1,274.7 $ 1,006.7 $ CTA s total cash/receivables balance was equal to $1.3 billion. Unrestricted cash was $75.7 million higher than the prior year due to timing of cash receipts and invoice payments. The Damage Reserve is sufficiently funded and was $4.9 million higher than last year due to a transfer based on budgeted levels. Funds owed by the RTA were approximately $322.5 million which was $30.2 million less than the prior year. CTA continues to work closely with the RTA to monitor their receivable balance owed; Trust Portfolio Assets represents bond proceeds held in Trust for funding capital projects and making required debt service payments and therefore increases when new debt is issued and decreases when payments are made. 1
2 III. Revenue Fare & Pass Revenue $ 47,650 $ (1,191) $ (2,030) $ 132,102 $ (5,104) $ (6,373) Fare and pass revenue for March was $1.2 million unfavorable to budget due to lower-thananticipated rail full fare and pass revenue. It was unfavorable to prior year by $2.0 million due to timing of revenue last year and lower bus and rail full fare revenue. The average fare for the month was $1.14 and was $0.03 higher than budget and $0.01 higher than the prior year. Year-to-date fare and pass revenue was $5.1 million unfavorable to budget and $6.4 million lower compared to prior year due to lower ridership. The average fare for the year was $1.14 per ride and was $0.01 less than budget. Reduced Fare Subsidy $ 1,180 $ (1,180) $ - $ 3,540 $ (3,540) $ - Reduced Fare Subsidy was unfavorable to budget for the month and year-to-date by $1.2 million and $3.5 million, respectively, based on expected reimbursements from the State. Advertising, Charter, Concession $ 2,803 $ (5) $ 27 $ 8,425 $ 12 $ 17 Advertising, Charter and Concessions Revenue was at budget and slightly higher than prior year mainly due to higher vehicle and platform advertising revenue. Year-to-date revenue was at budgeted and prior year levels. 2
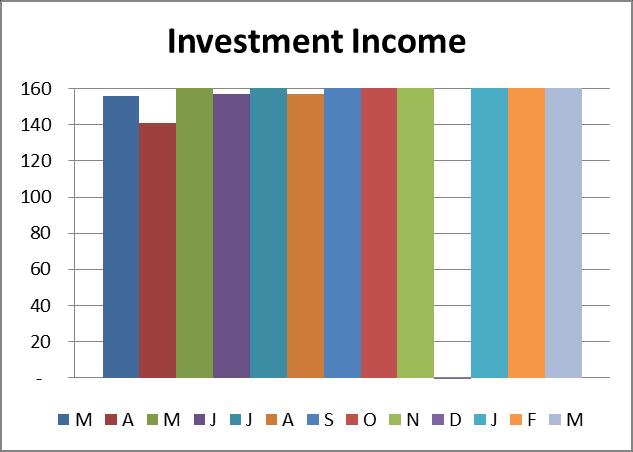
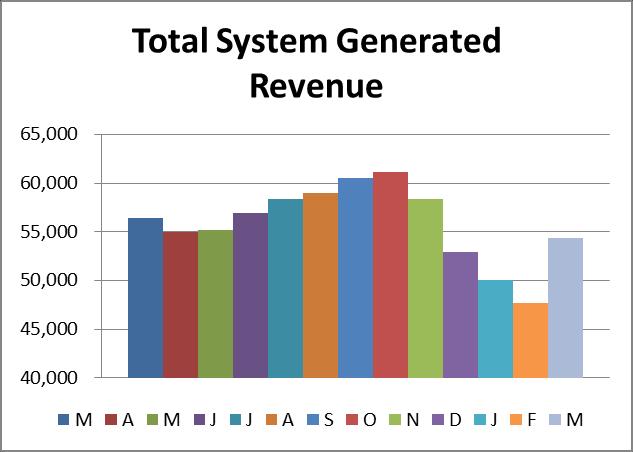
3 Investment income $ 233 $ 139 $ 77 $ 634 $ 353 $ 199 Investment income was $0.1 million higher than budget for the month and $0.4 million favorable to budget year-to-date due to higher short-term market rates. Other Revenue $ 2,499 $ 140 $ (105) $ 7,365 $ 506 $ (662) Other Revenue was favorable to budget by $0.1 million due to higher scrap material sales and rental revenue. It was unfavorable to prior year by $0.1 million due to lower non-capital grant revenue. The year-to-date was favorable to budget by $0.5 million due to higher park & ride and rental revenues. Other revenue was $0.7 million unfavorable compared to prior year-to-date primarily due to the sale of surplus property in the prior year. Total System Generated Revenue $ 54,365 $ (2,097) $ (2,031) $ 152,066 $ (7,774) $ (6,819) Total System-Generated Revenue was less than budget for the month and year-to-date by $2.1 million and $7.8 million, respectively, due to lower reduced fare subsidy and fare and pass revenue. It was less than March 2016 and prior year-to-date by $2.0 million and $6.8 million, respectively, due to lower fare and pass revenue and the sale of surplus property in IV. Expenses Labor $ 94,055 $ 405 $ (4,505) $ 264,782 $ 462 $ (7,037) Labor expense was $0.4 million favorable to budget for the month due to managing vacant positions. Slightly higher fringe benefits in 2017 contributed to higher expenses compared to 2016 year-to-date. 3
4 Material $ 8,173 $ (642) $ (324) $ 22,573 $ 83 $ (1,839) Material expense was $0.6 million unfavorable to budget for the month. The year-to-date was $0.1 million favorable to budget due in part to better than expected weather in 2017 and lower spending on vehicle parts. Fuel $ 2,548 $ 568 $ 498 $ 7,511 $ 1,576 $ 927 Fuel for Revenue Equipment expense was $0.6 million favorable to budget in March primarily due to lower consumption and favorable pricing. Fuel expense was $0.5 million and $0.9 million favorable compared to prior March and 2016 year-to-date, respectively, due to a reduction in the price of diesel fuel, lower usage and an increase in fuel efficiency. Power $ 1,881 $ 551 $ 309 $ 7,166 $ 661 $ 886 The Electric Power for Revenue Equipment expense was $0.6 million favorable to budget for the month due to lower prices. Year-to-date, expenses were $0.7 million under budget, primarily due to favorable prices. Provision for Injuries & Damages $ 792 $ - $ 1,583 $ 2,375 $ - $ - The Provision for Injuries & Damages expense was $1.6 million favorable to March 2016 and on par with 2016 year-to-date due to a change in the budget spread from quarterly to monthly. 4
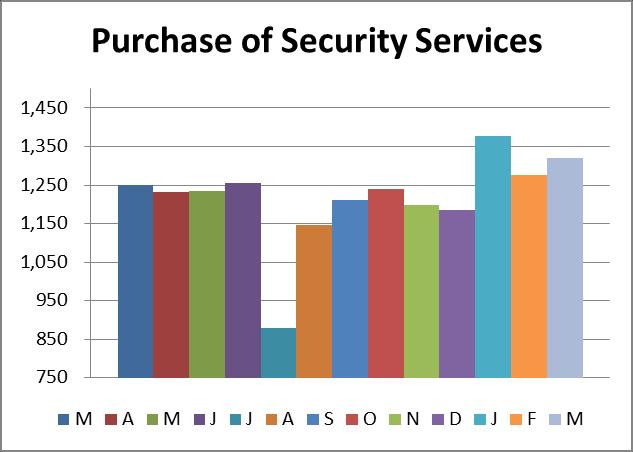
5 Purchase of Security Services $ 1,321 $ 82 $ (70) $ 3,973 $ 236 $ (456) Purchase of Security Services was $0.1 million favorable to budget for the month and favorable year-to-date by $0.2 million due to the timing of invoices. Other Expenses $ 24,283 $ 1,765 $ (1,089) $ 72,782 $ 4,481 $ (4,254) Other Expenses were favorable to budget by $1.8 million for the month due to the timing of contractual expenses. The unfavorable variance to prior year to-date was mainly due to new debt service. Of the total monthly other expenses, the pension obligation bond expense is $9 million; the remaining expenses are for utilities, maintenance contracts, services, and other expenses. Total Operating Expenses $ 133,054 $ 2,730 $ (3,597) $ 381,162 $ 7,500 $ (11,773) Operating Expenses were $2.7 million favorable to budget for the month due to the timing of contractual expenses. The unfavorable variance to prior year-to-date was due primarily to higher labor and other expenses. V. Recovery Ratio Recovery Ratio 49.21% (0.82) 48.42% (1.65) Recovery Ratio, which measures the percentage of operating expenses CTA funds from internally generated revenues, was 49.21% for the month. This was unfavorable to budget by 0.82 percentage points. 5
6 VI. Ridership Bus 22,122 (502) (1,218) 61,594 (261) (3,965) Rail 16,073 (1,323) (605) 44,842 (2,748) (1,884) Rail to Rail Transfers 3,553 (223) (137) 9,942 (488) (426) Total 41,749 (2,048) (1,960) 116,378 (3,496) (6,275) Ridership for the month of March was 41.7 million and was lower than budget and prior year by 2.0 million and 2.0 million, respectively. Calendar adjusted ridership was down 4.6% from prior year due to low gas prices and competition from rideshare services such as Uber and Lyft. Ridership for the year-to-date was million and was 3.5 million less than budget and was 6.3 million lower than the prior year-to-date. Calendar adjusted ridership was down 4.4% from the prior year-to-date. More details on ridership can be found in the March Ridership Report. 6
7 Cash & Liquidity 250 Unrestricted Cash M A M J J A S O N D J F M Damage Reserve M A M J J A S O N D J F M 400 Funds Owed by RTA M A M J J A S O N D J F M 7

8 Cash & Liquidity 800 Trust Portfolio Assets M A M J J A S O N D J F M Revenue 1,500 Reduced Fare Subsidy 1, M A M J J A S O N D J F M 8

9 Revenue Cont d 9

10 Revenue Cont d 10
11 Expenses 11

12 Expenses Cont d 12

13 Expenses Cont d 13
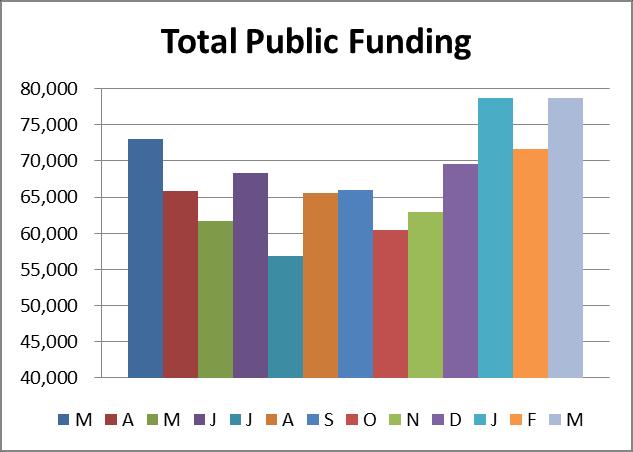
14 Cash Mar-16 Apr-16 May-16 Jun-16 Jul-16 Aug-16 Sep-16 Oct-16 Nov-16 Dec-16 Jan-17 Feb-17 Mar-17 Unrestricted Cash Damage Reserve Funds Owed by RTA Trust Portfolio Assets Revenue Mar-16 Apr-16 May-16 Jun-16 Jul-16 Aug-16 Sep-16 Oct-16 Nov-16 Dec-16 Jan-17 Feb-17 Mar-17 Fare & Pass Revenue 49,680 45,982 48,827 50,829 51,376 51,278 49,431 50,764 47,357 42,688 43,174 41,278 47,650 Reduced Fare Subsidy 1,180 1,180 1,180 1,180 1,180 1,180 1,404 1,180 1,180 1,180 1,180 1,180 1,180 Advertising, Charter, Concession 2,775 2,701 2,768 2,578 2,516 2,541 2,686 2,690 2,637 5,493 2,816 2,807 2,803 Investment Income (155) Statutory Required Contribution ,000 3, Other Revenue 2,604 4,975 2,287 2,165 3,119 3,861 6,873 4,266 4,046 3,743 2,618 2,248 2,499 Total System Generated Revenue 56,395 54,979 55,228 56,909 58,356 59,017 60,559 61,103 58,394 52,950 49,999 47,703 54,365 Total Public Funding 73,061 65,885 61,619 68,350 56,854 65,541 65,967 60,422 62,881 69,551 78,707 71,699 78,690 Expenses Mar-16 Apr-16 May-16 Jun-16 Jul-16 Aug-16 Sep-16 Oct-16 Nov-16 Dec-16 Jan-17 Feb-17 Mar-17 Labor 89,550 84,268 83,416 86,891 81,953 89,715 85,558 86,924 85,560 85,016 87,882 82,845 94,055 Material 7,850 7,325 6,268 7,725 6,528 6,957 7,248 6,826 5,828 7,482 7,415 6,985 8,173 Fuel 3,046 2,435 2,303 3,094 2,505 2,980 2,726 2,584 2,433 3,242 2,627 2,335 2,548 Power 2,190 2,173 2,150 2,360 2,337 2,495 2,347 2,048 2,465 2,856 2,601 2,684 1,881 Provision Injuries & Damages 2, , , , Purchase of Security Services 1,251 1,231 1,235 1, ,145 1,211 1,239 1,199 1,185 1,376 1,276 1,321 Other Expenses 23,195 23,432 21,475 21,561 21,009 21,266 24,060 21,905 23,790 20,346 26,014 22,484 24,283 Total Operating Expenses 129, , , , , , , , , , , , ,054
Cash & Liquidity The chart below highlights CTA s cash position at February 2017 compared to February 2016.
 To: Chicago Transit Authority Board From: Jeremy Fine, Chief Financial Officer Re: Financial Results for February 2017 Date: April 5, 2017 I. Summary CTA s financial results are $0.3 million favorable
Cash & Liquidity The chart below highlights CTA s cash position at September 2017 compared to September 2016.
 To: Chicago Transit Authority Board From: Jeremy Fine, Chief Financial Officer Re: Financial Results for September 2017 Date: November 15, 2017 I. Summary CTA s financial results are $7.7 million favorable
Cash & Liquidity The chart below highlights CTA s cash position at December 2017 compared to December 2016.
 To: Chicago Transit Authority Board From: Jeremy Fine, Chief Financial Officer Re: Financial Results for December 2017 Date: February 14, 2018 I. Summary CTA s financial results are $4.7 million favorable
The year to date is less than budget and prior year by 15.4 million and 11.6 million, respectively.
 To: Chicago Transit Authority Board From: Jeremy Fine, Chief Financial Officer Re: Financial Results for September 2016 Date: November 16, 2016 I. Summary CTA s financial results are $0.3 million unfavorable
Cash & Liquidity The chart below highlights CTA s cash position at June 2018 compared to June 2017.
 To: Chicago Transit Authority Board From: Jeremy Fine, Chief Financial Officer Re: Financial Results for June 2018 Date: August 15, 2018 I. Summary CTA s financial results are unfavorable to budget for
Cash & Liquidity The chart below highlights CTA s cash position at January 2018 compared to January 2017.
 To: Chicago Transit Authority Board From: Jeremy Fine, Chief Financial Officer Re: Financial Results for January 2018 Date: March 14, 2018 I. Summary CTA s financial results are $1.7 million unfavorable
Cash & Liquidity The chart below highlights CTA s cash position at August 2018 compared to August 2017.
 To: Chicago Transit Authority Board From: Jeremy Fine, Chief Financial Officer Re: Financial Results for August 2018 Date: October 10, 2018 I. Summary CTA s financial results are favorable to budget for
Cash & Liquidity The chart below highlights CTA s cash position at March 2018 compared to March 2017.
 To: Chicago Transit Authority Board From: Jeremy Fine, Chief Financial Officer Re: Financial Results for March 2018 Date: May 9, 2018 I. Summary CTA s financial results are $0.9 million favorable to budget
Cash & Liquidity The chart below highlights CTA s cash position at July 2016 compared to July 2015.
 To: Chicago Transit Authority Board From: Jeremy Fine, Chief Financial Officer Re: Financial Results for July 2016 Date: September 14, 2016 I. Summary CTA s financial results are $0.4 million favorable
Cash & Liquidity The chart below highlights CTA s cash position at February 2016 compared to February 2015.
 To: Chicago Transit Authority Board From: Jeremy Fine, Chief Financial Officer Re: Financial Results for February 2016 Date: April 6, 2016 I. Summary CTA s financial results are $2.7 million favorable
Cash & Liquidity The chart below highlights CTA s cash position at January 2016 compared to January 2015.
 To: Chicago Transit Authority Board From: Tom McKone, Acting Chief Financial Officer Re: Financial Results for January 2016 Date: March 9, 2016 I. Summary CTA s financial results are $0.8 million unfavorable
Cash & Liquidity The chart below highlights CTA s cash position at February 2015 compared to February 2014.
 To: Chicago Transit Authority Board From: Ron DeNard, Chief Financial Officer Re: Financial Results for February 2015 Date: April 15, 2015 I. Summary CTA s financial results are favorable for the month
CTA s financial results are unfavorable by $0.5 million and $1.2 million for the month and year.
 To: Chicago Transit Authority Board From: Ron DeNard, Chief Financial Officer Re: Financial Results for May 2015 Date: July 13, 2015 I. Summary CTA s financial results are unfavorable by $0.5 million and
Ridership for the month is 39.4 million and is on par with budget. Ridership is 1.4 million or 3.6% higher than January 2014.
 To: Chicago Transit Authority Board From: Ron DeNard, Chief Financial Officer Re: Financial Results for January 2015 Date: March 6, 2015 I. Summary CTA s financial results are $2.0 million favorable for
Cash & Liquidity The chart below highlights CTA s cash position at July 2015 compared to July 2014.
 To: Chicago Transit Authority Board From: Tom McKone, Acting CFO Re: Financial Results for July 2015 Date: September 4, 2015 I. Summary CTA s financial results are favorable by $1.9 million for the month
Cash & Liquidity The chart below highlights CTA s cash position at November 2014 compared to November 2013.
 To: Chicago Transit Authority Board From: Ronald E. DeNard, Chief Financial Officer Re: Financial Results for November 2014 Date: January 12, 2015 I. Summary CTA s financial results are $1.9 million unfavorable
Cash & Liquidity The chart below highlights CTA s cash position at June 2014 compared to June 2013.
 To: Chicago Transit Authority Board From: Ron DeNard, Chief Financial Officer Re: Financial Results for June 2014 Date: August 13, 2014 I. Summary CTA s financial results are $4.0 million favorable for
Cash & Liquidity The chart below highlights CTA s cash position at May 2014 compared to May 2013.
 To: Chicago Transit Authority Board From: Ron DeNard, Chief Financial Officer Re: Financial Results for May 2014 Date: July 16, 2014 I. Summary CTA s financial results are $5.6 million favorable for May
Financial Report - FY 2017 Year to Date May 31, 2017
 Financial Report - FY 2017 Year to Date July 19, 2017 1 Major Highlights Revenue Sales tax remittances received through YTD April 2017 are 4.2% higher than YTD April 2016 Plaza Saltillo lease income budgeted
Operating Budget Stability
 Operating Budget Stability March Financial Update Report to Agenda Executive Summary March Performance Against FY16 Budget March Performance Against Same Period Last Year Appendix Financial Detail: March
METRO. Monthly Board Report. June 2006
 METRO Monthly Board Report Operating Capital Service Performance June 26 7/17/26 June 26 MONTHLY BOARD REPORT INDEX Section A Section B Section C Section D Section E Section F Section G Operating Budget
METRO. Fiscal Year 2012 Monthly Board Report. September 2012 (Fourth Quarter Fiscal Year-to-Date)
") METRO Fiscal Year 2012 Monthly Board Report Revenue Expense Ridership Performance (Fourth Quarter Fiscal Year-to-Date) This report is based on a preliminary closing of the year-end financials for FY2012
METRO Fiscal Year 2012 Monthly Board Report Revenue Expense Ridership Performance (Fourth Quarter Fiscal Year-to-Date) This report is based on a preliminary closing of the year-end financials for FY2012
FY2014 Operating Budget Performance Report
 Finance & Administration Committee Information Item IV-C September 11, 2014 FY2014 Operating Budget Performance Report Washington Metropolitan Area Transit Authority Board Action/Information Summary Action
METRO. Fiscal Year 2012 Monthly Board Report. December 2011 (First Quarter Fiscal Year-to-Date)
") METRO Fiscal Year 2012 Monthly Board Report Revenue Expense Ridership Performance (First Quarter Fiscal Year-to-Date) 1/27/2012 Table of Contents Section A Section B Section C Section D Section E Section
METRO Fiscal Year 2012 Monthly Board Report Revenue Expense Ridership Performance (First Quarter Fiscal Year-to-Date) 1/27/2012 Table of Contents Section A Section B Section C Section D Section E Section
METRO MONTHLY BOARD REPORT
 METRO Revenue Expenses Service Performance Fiscal Year FY2011 Table of Contents Section A Section B Section C Section D Section E Section F Section G Section H Summary Sales Tax Revenue Fare Revenue Operating
METRO. Fiscal Year 2013 Monthly Board Report. December 2012 (First Quarter Fiscal Year-to-Date)
") METRO Fiscal Year 2013 Monthly Board Report Revenue Expense Ridership Performance (First Quarter Fiscal Year-to-Date) 1/14/2013 Table of Contents Section A Section B Section C Section D Section E Section
METRO Fiscal Year 2013 Monthly Board Report Revenue Expense Ridership Performance (First Quarter Fiscal Year-to-Date) 1/14/2013 Table of Contents Section A Section B Section C Section D Section E Section
Operating Budget. Third Quarter Financial Report (July 2005 March 2006)
") Third Quarter Financial Report (July 2005 March 2006) INDEX A. Executive Summary...page 2 B. Revenue and Expense Analysis...page 3 C. Budget Variance Reports...page 14 D. Ridership and Performance Measures...page
Third Quarter Financial Report (July 2005 March 2006) INDEX A. Executive Summary...page 2 B. Revenue and Expense Analysis...page 3 C. Budget Variance Reports...page 14 D. Ridership and Performance Measures...page
WESTWOOD LUTHERAN CHURCH Summary Financial Statement YEAR TO DATE - February 28, Over(Under) Budget WECC Fund Actual Budget
 Budget WECC Fund Actual Budget") WESTWOOD LUTHERAN CHURCH Summary Financial Statement YEAR TO DATE - February 28, 2018 General Fund Actual A B C D E F WECC Fund Actual Revenue Revenue - Faith Giving 1 $ 213 $ 234 $ (22) - Tuition $ 226
WESTWOOD LUTHERAN CHURCH Summary Financial Statement YEAR TO DATE - February 28, 2018 General Fund Actual A B C D E F WECC Fund Actual Revenue Revenue - Faith Giving 1 $ 213 $ 234 $ (22) - Tuition $ 226
METRO. Fiscal Year 2014 Monthly Board Report. May 2014
 METRO Fiscal Year 2014 Monthly Board Report Revenue Expense Ridership Performance 7/11/2014 Table of Contents Section A Section B Section C Section D Section E Section F Section G Section H Section I Section
METRO. Fiscal Year 2013 Monthly Board Report. November 2012
 METRO Fiscal Year 2013 Monthly Board Report Revenue Expense Ridership Performance 12/13/2012 Table of Contents Section A Section B Section C Section D Section E Section F Section G Section H Section I
Budget Process Overview and Cost Allocation Methodology
 Budget Process Overview and Cost Allocation Methodology 1 Cost Allocation Agreement Guiding Principles Operate a consolidated regional public transportation system within and between the Participating
2019 Tax Budget Office of Management & Budget July 17, Greater Cleveland Regional Transit Authority
 Greater Cleveland Regional Transit Authority 2019 Tax Budget Office of Management & Budget July 17, 2018 Operating Budget Calendar o May o Jun o Jul Prepare 5 Yr. Financial Forecast Finalize 5 Yr Financial
XML Publisher Balance Sheet Vision Operations (USA) Feb-02
 Feb-02") Page:1 Apr-01 May-01 Jun-01 Jul-01 ASSETS Current Assets Cash and Short Term Investments 15,862,304 51,998,607 9,198,226 Accounts Receivable - Net of Allowance 2,560,786
Page:1 Apr-01 May-01 Jun-01 Jul-01 ASSETS Current Assets Cash and Short Term Investments 15,862,304 51,998,607 9,198,226 Accounts Receivable - Net of Allowance 2,560,786
BUDGETWATCH October 2018 Flash Report
 October 2018 Flash Report Overall Latest Condition (reporting on operations through September and subsidies through October): Passenger Revenues were slightly below the Forecast in September, marginally
METRO. Fiscal Year 2015 Monthly Board Report. February 2015
 METRO Fiscal Year 2015 Monthly Board Report Revenue Expense Ridership Performance 4/2/2015 Table of Contents Section A Section B Section C Section D Section E Section F Section G Section H Section I Section
BUDGETWATCH September 2018 Flash Report
 September 2018 Flash Report (Forecast figures in this report refer to the 2018 Forecast) Overall Latest Condition (reporting on operations through August and subsidies through September): For reporting
Big Walnut Local School District
 Big Walnut Local School District Monthly Financial Report for the month ended September 30, 2013 Prepared By: Felicia Drummey Treasurer BIG WALNUT LOCAL SCHOOL DISTRICT SUMMARY OF YEAR TO DATE FINANCIAL
Spheria Australian Smaller Companies Fund
 29-Jun-18 $ 2.7686 $ 2.7603 $ 2.7520 28-Jun-18 $ 2.7764 $ 2.7681 $ 2.7598 27-Jun-18 $ 2.7804 $ 2.7721 $ 2.7638 26-Jun-18 $ 2.7857 $ 2.7774 $ 2.7690 25-Jun-18 $ 2.7931 $ 2.7848 $ 2.7764 22-Jun-18 $ 2.7771
Big Walnut Local School District
 Big Walnut Local School District Monthly Financial Report for the month ended September 30, 2012 Prepared By: Felicia Drummey Treasurer BIG WALNUT LOCAL SCHOOL DISTRICT SUMMARY OF YEAR-TO-DATE FINANCIAL
Executive Summary. July 17, 2015
 Executive Summary July 17, 2015 The Revenue Estimating Conference adopted interest rates for use in the state budgeting process. The adopted interest rates take into consideration current benchmark rates
METRO. Fiscal Year 2013 Monthly Board Report. January 2013
 METRO Fiscal Year 2013 Monthly Board Report Revenue Expense Ridership Performance 2/14/2013 Table of Contents Section A Section B Section C Section D Section E Section F Section G Section H Section I Section
Operating Budget. Second Quarter Financial Report
 Second Quarter Financial Report INDEX A. Executive Summary... A-1 B. Revenue and Expense Analysis... B-1 C. Budget Variance Reports... C-1 D. Ridership and Performance Measures... D-1 Board Budget Committee
BUDGETWATCH May 2018 Flash Report
 May 2018 Flash Report Overall Latest Condition (reporting on operations through April and subsidies through May): Passenger revenues were $15.1 million unfavorable in April, increasing the unfavorable
BUDGETWATCH April 2015 Flash Report
 BUDGETWATCH April 2015 Flash Report Summary of March Budgetwatch (reporting on operations through February and subsidies through March): Overall, results through March were favorable mainly as a result
BUDGETWATCH March 2018 Flash Report
 March 2018 Flash Report Overall Latest Condition (reporting on operations through February and subsidies through March): Passenger revenues were $6 million unfavorable in February, increasing the unfavorable
MIAMI PARKING AUTHORITY
 Revenue & Expenses Summary For the Five Months Ending February 28, 2019 Page 1 Adopted FY 2018 Actual Actual Actual Budget Actual Versus FY 2018 Versus 2019 Budget Year-To-Date $ $ $ $ % $ % Operating
February 2016 Financial Report
 2016 February 2016 Financial Report Capital Metropolitan Transportation Authority 4/13/2016 Table of Contents SUMMARY REPORT Budgetary Performance - Revenue 2 - Sales Tax Revenue 5 - Operating Expenses
METRO. Fiscal Year 2017 Monthly Performance Report. Revenue Expense Ridership Performance. October 2016
 METRO Fiscal Year 2017 Monthly Performance Report Revenue Expense Ridership Performance 11/18/2016 Table of Contents Section A Section B Section C Section D Section E Section F Section G Section H Section
Cost Estimation of a Manufacturing Company
 Cost Estimation of a Manufacturing Company Name: Business: Date: Economics of One Unit: Manufacturing Company (Only complete if you are making a product, such as a bracelet or beauty product) Economics
BUDGETWATCH March 2016 Flash Report
 March 2016 Flash Report Summary of February Budgetwatch (reporting on operations through January and subsidies through February): Overall results through February were slightly favorable. Net operating
Financial Management Report... 3
 November 13, 2013 Table of Contents Financial Management Report... 3 OPERATING FUNDS STATEMENT OF REVENUES & EXPENSES... 3 METROPOLITAN COUNCIL INVESTMENT PERFORMANCE SHORT-TERM PORTFOLIO... 4 METROPOLITAN
MONTHLY FINANCIAL STATUS JUNE 2018
 (Millions) MONTHLY FINANCIAL STATUS To: Dave Genova, General Manager and CEO ACTION DISCUSSION INFO From: Heather McKillop, CFO and AGM Administration x Date: July 10, VS. BUDGET YTD VS. BUDGET JUNE VS.
MONTHLY FINANCIAL STATUS JANUARY 2019
 (Millions) MONTHLY FINANCIAL STATUS To: Dave Genova, General Manager and CEO ACTION DISCUSSION INFO From: Heather McKillop, CFO and AGM Administration x Date: March 12, 2019 VS. BUDGET YTD 2019 VS. BUDGET
Review of Registered Charites Compliance Rates with Annual Reporting Requirements 2016
 Review of Registered Charites Compliance Rates with Annual Reporting Requirements 2016 October 2017 The Charities Regulator, in accordance with the provisions of section 14 of the Charities Act 2009, carried
MONTHLY FINANCIAL STATUS AUGUST 2018
 (Millions) MONTHLY FINANCIAL STATUS To: Dave Genova, General Manager and CEO ACTION DISCUSSION INFO From: Heather McKillop, CFO and AGM Administration x Date: October 9, VS. BUDGET YTD VS. BUDGET AUGUST
FUEL PRICE RISK MANAGEMENT POLICY REPORT "FUEL HEDGE"
 FUEL PRICE RISK MANAGEMENT POLICY REPORT "FUEL HEDGE" Sep-18 FUEL PRICE RISK MANAGEMENT POLICY REPORT Sep-18 (Office of Management and Budget 09/30/2018) The Fuel Price Risk Management Policy approved
FUEL PRICE RISK MANAGEMENT POLICY REPORT "FUEL HEDGE"
 FUEL PRICE RISK MANAGEMENT POLICY REPORT "FUEL HEDGE" December 2018 FUEL PRICE RISK MANAGEMENT POLICY REPORT December 2018 The Fuel Price Risk Management Policy approved by the Board on February 16, 2006
BUDGETWATCH March 2019 Flash Report
 March 2019 Flash Report Overall Latest Condition (reporting on operations through February and subsidies through March): Overall, YTD preliminary net results were favorable mainly reflecting lower operating
Capital Metropolitan Transportation Authority Monthly Performance & Financial Report For Period Ending October 31, 2012 Soft Close
 Capital Metropolitan Transportation Authority Monthly Performance & Financial Report For Period Ending October 31, 2012 Soft Close Table of Contents SUMMARY REPORT Financial Performance -Sales Tax 3 -Other
MONTHLY FINANCIAL STATUS OCTOBER 2018
 (Millions) MONTHLY FINANCIAL STATUS To: Dave Genova, General Manager and CEO ACTION DISCUSSION INFO From: Heather McKillop, CFO and AGM Administration x Date: December 11, VS. BUDGET YTD VS. BUDGET OCTOBER
METRO. Fiscal Year Monthly Performance Report. Revenue Expense Ridership Performance. November 2018 (Third Quarter Fiscal Year-to Date)
") METRO Fiscal Year 2019 Monthly Performance Report Revenue Expense Ridership Performance (Third Quarter Fiscal Year-to Date) 12/12/2018 Table of Contents Section A Section B Section C Section D Section
METRO Fiscal Year 2019 Monthly Performance Report Revenue Expense Ridership Performance (Third Quarter Fiscal Year-to Date) 12/12/2018 Table of Contents Section A Section B Section C Section D Section
Fiscal Year 2018 Project 1 Annual Budget
 Fiscal Year 2018 Project 1 Annual Budget Table of Contents Table Page Summary 3 Summary of Costs Table 1 4 Treasury Related Expenses Table 2 5 Summary of Full Time Equivalent Table 3 6 Positions Cost-to-Cash
BUDGETWATCH May 2017 Flash Report
 May 2017 Flash Report Summary of April Budgetwatch (reporting on operations through March and subsidies through April): Overall, results were favorable for the month, and remained favorable YTD. Passenger
HIPIOWA - IOWA COMPREHENSIVE HEALTH ASSOCIATION Unaudited Balance Sheet As of July 31
 Unaudited Balance Sheet As of July 31 Total Enrollment: 407 Assets: Cash $ 9,541,661 $ 1,237,950 Invested Cash 781,689 8,630,624 Premiums Receivable 16,445 299,134 Prepaid 32,930 34,403 Assessments Receivable
Quarterly Financial Review
 Second Quarter 2013 Quarterly Financial Review Norfolk Southern Corporation Finance Department Three Commercial Place Norfolk, Virginia 23510.2191 7/20/2012 DRAFTB Norfolk Southern Railway System Contents
HIPIOWA - IOWA COMPREHENSIVE HEALTH ASSOCIATION Unaudited Balance Sheet As of January 31
 Unaudited Balance Sheet As of January 31 Total Enrollment: 371 Assets: Cash $ 1,408,868 $ 1,375,117 Invested Cash 4,664,286 4,136,167 Premiums Receivable 94,152 91,261 Prepaid 32,270 33,421 Assessments
Financial & Business Highlights For the Year Ended June 30, 2017
 Financial & Business Highlights For the Year Ended June, 17 17 16 15 14 13 12 Profit and Loss Account Operating Revenue 858 590 648 415 172 174 Investment gains net 5 162 909 825 322 516 Other 262 146
BUDGETWATCH September 2014 Flash Report
 BUDGETWATCH September 2014 Flash Report (Forecast figures in this report, except the Summary of June Budgetwatch, refer to the 2014 Forecast) Summary of June Budgetwatch (reporting on operations through
Capital Metropolitan Transportation Authority Monthly Financial Report For Period Ending November 30, 2013
 Capital Metropolitan Transportation Authority Monthly Financial Report For Period Ending November 30, 2013 Table of Contents SUMMARY REPORT Financial Performance -Sales Tax Revenue 3 -Other Revenue 4 -Operating
PRESS RELEASE. Securities issued by Hungarian residents and breakdown by holding sectors. October 2018
 PRESS RELEASE 10 December 2018 Securities issued by Hungarian residents and breakdown by holding sectors October 2018 According to securities statistics, the amount outstanding of equity securities and
Accountant s Compilation Report
 Tel: 817-738-2400 Fax: 817-738-1995 www.bdo.com 6050 Southwest Blvd, Suite 300 Fort Worth, TX 76109 Accountant s Compilation Report Joseph Portugal Town Administrator Town of Westover Hills, Texas Management
Business & Financial Services December 2017
 Business & Financial Services December 217 Completed Procurement Transactions by Month 2 4 175 15 125 1 75 5 2 1 Business Days to Complete 25 Jan Feb Mar Apr May Jun Jul Aug Sep Oct Nov Dec 217 Procurement
Financial Report for the Month of SEPTEMBER
 WILLOUGHBY, OH Financial Report for the Month of SEPTEMBER Month Ended SEPTEMBER 30, 2013 BOARD OF EDUCATION Mrs. Margaret Warner, President SUPERINTENDENT Mr. Steve Thompson Mrs. Sharon Scott, Vice President
MEMORANDUM TO: FROM: Kathy Fisher, Budget Manager ( ) SUBJECT: Budget Variance Report 1 st Quarter DATE: April 20, 2017
 SUBJECT: Budget Variance Report 1 st Quarter DATE: April 20, 2017") MEMORANDUM F&A 5/1/ Page 1 of 6 TO: Finance and Administration Committee FROM: Kathy Fisher, Budget Manager (612-726-8158) SUBJECT: Budget Variance Report 1 st Quarter DATE: April 20, The 1 st Quarter
MEMORANDUM F&A 5/1/ Page 1 of 6 TO: Finance and Administration Committee FROM: Kathy Fisher, Budget Manager (612-726-8158) SUBJECT: Budget Variance Report 1 st Quarter DATE: April 20, The 1 st Quarter
General Fund Revenue
 Millions Percent of Kathy Steinert, Director of Fiscal Services Phone: 541.923.8927 145 SE Salmon Ave Redmond, OR 97756 kathy.steinert@redmond.k12.or.us Date: May 23, 2014 To: Redmond School District Board
BUDGETWATCH January 2015 Special 2014 Year-End Flash
 BUDGETWATCH January 2015 Special 2014 Year-End Flash Overall: January Budgetwatch is a flash look focusing on some very preliminary 2014 actual revenue results compared with the Final Estimate that was
GENERAL FUND AT A GLANCE Category Budget YTD Actual % % Year Passed Resources 8.33% Uses 8.33% $0 $1,330,750
 City of Edmond Monthly Financial Report FY 2008/2009 Through the Month Ended Unaudited - Intended for Management Purposes Only The following is a summary of the City's financial results for operating funds.
TERMS OF REFERENCE FOR THE INVESTMENT COMMITTEE
 I. PURPOSE The purpose of the Investment Committee (the Committee ) is to recommend to the Board the investment policy, including the asset mix policy and the appropriate benchmark for both ICBC and any
Management Reports. June for PREPARED BY POWERED BY
 Management Reports for June 217 PREPARED BY POWERED BY Contents 1. Management Reports Cashflow Forecast Actual vs Budget P&L Forecast Where Did Our Money Go? Net Worth 2. Understanding your Reports 3.
Quarterly Financial Review
 First Quarter 2014 Quarterly Financial Review Norfolk Southern Corporation Finance Department Three Commercial Place Norfolk, Virginia 23510.2191 Norfolk Southern Railway System Contents Consolidated Statements
Jul Aug Sept Oct Nov Dec Jan Feb Mar Apr May Jun
 REVENUE AND RIDERSHIP 4th Quarter FY2014 REVENUE (in Millions) $90M $85M $80M $75M $70M $65M $60M $55M $50M 79 77 74 74 72 70 FY2013 Actual FY2014 Budget FY2014 Actual 79 85 78 78 77 67 66 70 59 67 65
METRO. Fiscal Year Monthly Performance Report. Revenue Expense Ridership Performance. February 2018 (First Quarter Fiscal Year-to Date)
") METRO Fiscal Year 2018 Monthly Performance Report Revenue Expense Ridership Performance (First Quarter Fiscal Year-to Date) 3/12/2018 Table of Contents Section A Section B Section C Section D Section E
METRO Fiscal Year 2018 Monthly Performance Report Revenue Expense Ridership Performance (First Quarter Fiscal Year-to Date) 3/12/2018 Table of Contents Section A Section B Section C Section D Section E
Regional overview Gisborne
 Regional overview Purchasing intentions - additional income-related rent subsidy (IRRS) places Area District 1 2 3 4+ TOTAL 3 35 5 7 total 3 35 5 7 7 8 9 1 11 Purchasing intentions - change within the
CTA 2007 Contingency Plan
 CTA 2007 Contingency Plan JUST THE FACTS RTA Directive Unless the RTA Board makes a determination no later than July 1, 2007, that the funds identified as new transit funding are available for 2007 such
HART Financial Snapshot. HART Finance and Audit Committee January 23, 2017
 HART Financial Snapshot HART Finance and Audit Committee January 23, 2017 1 Requested January 3, 2017 Cash flow management overview Fund balance update including year end fund balance reported in the past
PRESS RELEASE. Securities issued by Hungarian residents and breakdown by holding sectors. January 2019
 7 March 2019 PRESS RELEASE Securities issued by Hungarian residents and breakdown by holding sectors January 2019 According to securities statistics, the amount outstanding of equity securities and debt
Board of Directors October 2018 and YTD Financial Report
 Board of Directors October 2018 and YTD Financial Report Consolidated Financial Results Operating Margin October ($30,262) $129,301 ($159,563) Year-to-date $292,283 $931,358 ($639,076) Excess of Revenue
BUDGETWATCH April 2019 Flash Report
 April 2019 Flash Report Overall Latest Condition (reporting on operations through March and subsidies through April): Due to the early scheduling of the Finance Committee meeting, first-close preliminary
MONTHLY FINANCIAL STATUS MAY 2018
 (Millions) MONTHLY FINANCIAL STATUS To: Dave Genova, General Manager and CEO ACTION DISCUSSION INFO From: Heather McKillop, CFO and AGM Administration x Date: July 10, VS. BUDGET YTD VS. BUDGET MAY VS.
MONTHLY FINANCIAL STATUS APRIL 2018
 (Millions) MONTHLY FINANCIAL STATUS To: Dave Genova, General Manager and CEO ACTION DISCUSSION INFO From: Heather McKillop, CFO and AGM Administration x Date: June 19, VS. BUDGET YTD VS. BUDGET APRIL VS.
Pre-Existing Condition Insurance Plan Washington State (PCIP-WA) June 2011 Financial Review
 June 2011 Financial Review") Pre-Existing Condition Insurance Plan Washington State (PCIP-WA) June 2011 Financial Review 1. Financial Statements June 2011 UBalance Sheet Due to the timing of the HHS reimbursement receipts, there is
Pre-Existing Condition Insurance Plan Washington State (PCIP-WA) June 2011 Financial Review 1. Financial Statements June 2011 UBalance Sheet Due to the timing of the HHS reimbursement receipts, there is
LOAN MARKET DATA AND ANALYTICS BY THOMSON REUTERS LPC
 LOAN MARKET DATA AND ANALYTICS BY THOMSON REUTERS LPC GLOBAL LOAN MARKET DATA AND ANALYTICS BY THOMSON REUTERS LPC Secondary Market Bid Levels: Europe Slide 2 European CLO New Issue Volume Monthly Slide
Regional overview Hawke's Bay
 Regional overview Purchasing intentions - additional income-related rent subsidy (IRRS) places Area Hastings Central 1 2 3 4+ TOTAL 5 5 25 125 3 3 1 7 total 8 8 35 195 7 8 9 1 11 Purchasing intentions
PRESS RELEASE. Securities issued by Hungarian residents and breakdown by holding sectors. April 2016
 10 June 2016 PRESS RELEASE Securities issued by Hungarian residents and breakdown by holding sectors April 2016 According to securities statistics data, the amount outstanding of equity securities and
Home and Community Based Services (HCBS) Waiver Monthly Surplus-Deficit Report for Waiver Program Expenditures. June 20, 2016
 Waiver Monthly Surplus-Deficit Report for Waiver Program Expenditures. June 20, 2016") Home and Community Based Services (HCBS) Waiver Monthly Surplus-Deficit Report for Waiver Program Expenditures June 20, 2016 Appropriations and Expenditure Information The Fiscal Year 2015-16 General Appropriations
Home and Community Based Services (HCBS) Waiver Monthly Surplus-Deficit Report for Waiver Program Expenditures June 20, 2016 Appropriations and Expenditure Information The Fiscal Year 2015-16 General Appropriations
April 30, 2016 Financial Report
 2016 April 30, 2016 Financial Report Capital Metropolitan Transportation Authority 6/15/2016 Table of Contents SUMMARY REPORT Budgetary Performance - Revenue 2 - Sales Tax Revenue 6 - Operating Expenses
BUDGETWATCH February 2016 Flash Report
 February 2016 Flash Report Overall Latest Condition (reporting on operations for January and subsidies through February): Overall, preliminary results were on target for the month and slightly favorable
Durham Orange Joint Staff Working Group Meeting Agenda October 10, :30 pm 4:00 pm Durham City Hall, Transportation 4B
 Durham Orange Joint Staff Working Group Meeting Agenda October 10, 2018 2:30 pm 4:00 pm Durham City Hall, Transportation 4B 1. Call to Order/Roll Call 2. Election Chair Position 3. Open Issues a. FY2019
BUDGETWATCH January 2018 Special 2017 Year-End Flash Report
 January 2018 Special 2017 Year-End Flash Report Overall The January Budgetwatch is a flash look focusing on some very preliminary 2017 actual revenue results, along with debt service, compared with the
Pre-Existing Condition Insurance Plan Washington State (PCIP-WA) January 2011 Financial Review
 January 2011 Financial Review") Pre-Existing Condition Insurance Plan Washington State (PCIP-WA) January 2011 Financial Review 1. Financial Statements January 2011 UBalance Sheet Cash on Hand at the end of January 2011 is $30 K, which
Pre-Existing Condition Insurance Plan Washington State (PCIP-WA) January 2011 Financial Review 1. Financial Statements January 2011 UBalance Sheet Cash on Hand at the end of January 2011 is $30 K, which