Cash & Liquidity The chart below highlights CTA s cash position at June 2014 compared to June 2013.
|
|
|
- Kristopher Thornton
- 6 years ago
- Views:
Transcription

1 To: Chicago Transit Authority Board From: Ron DeNard, Chief Financial Officer Re: Financial Results for June 2014 Date: August 13, 2014 I. Summary CTA s financial results are $4.0 million favorable for June and $6.3 million favorable to budget for the year to date. The favorable variance for the year is due to higher non-farebox revenues and lower June expenses than anticipated in the budget. Ridership for the month is 42.6 million and is 2.3 million less than budget. For the year to date ridership is million and is less than budget and prior year by 9.5 million and 8.9 million, respectively. II. Cash & Liquidity The chart below highlights CTA s cash position at June 2014 compared to June June June Increase (Decrease) Unrestricted Cash $ $ 83.0 $ 30.2 Damage Reserve $ (13.4) Funds Owed by RTA $ (50.8) Trust Portfolio Assets $ (263.2) Total Cash and Receivables $ $ $ (297.2) CTA s total cash/receivables balance is equal to $700.8 million. Unrestricted cash was $30.2 million more than the prior year due to timing of expenditure payments and reimbursement of bond draws to fund capital projects. The cash in Damage Reserve, while still over-funded is $13.4 million lower than last year because of claims paid in 2014 and the credit taken from the Reserve in the second half of 2013 to offset the unexpected reduction in the State s reduced fare reimbursement program. Funds owed by the RTA were approximately $252.0 million which was $50.8 million less than the prior year. CTA continues to work closely with the RTA to monitor their receivable balance owed; Trust Portfolio Assets represents bond proceeds held in Trust for funding capital projects and making required debt service payments. The balances will decrease as we meet our scheduled spend down plan and debt service payments and will increase as CTA receives additional bond proceeds or grant money. 1
2 III. Revenue Fare & Pass Revenue $ 49,980 $ (1,162) $ 1,910 $ 285,969 $ (4,599) $ 2,739 Fare and pass revenue was unfavorable to budget for the month but was higher than June The Red Line South free shuttles and $0.50 bus fare discount was in effect in June Farebox revenue was favorable to budget offsetting pass revenue which was unfavorable. The average fare for the month was $1.17 and was $0.03 favorable to budget. Year to date fare and pass revenue was $4.6 million (1.6%) less than budget, in part due to the impact of the extreme winter weather during the first quarter. The average fare for the year to date is $1.13 per ride and $0.02 more than budget. Reduced Fare Subsidy $ 1,217 $ - $ (1,143) $ 7,303 $ - $ (6,858) Reduced Fare Subsidy is consistent with the budget but less than prior year due to the State reduction in funding. Advertising, Charter, Concession $ 2,234 $ (18) $ 428 $ 13,531 $ (91) $ 412 Advertising, Charter and Concessions Revenue is slightly unfavorable to budget for the month. Year to date revenue was more than prior year due to higher vehicle and platform ad revenue. Investment income $ 58 $ 20 $ 37 $ 251 $ (20) $ 80 Investment Income is higher than budget and prior year. The year to date unfavorable variance is primarily due to a lower realized yield on investments and the impact of short 2
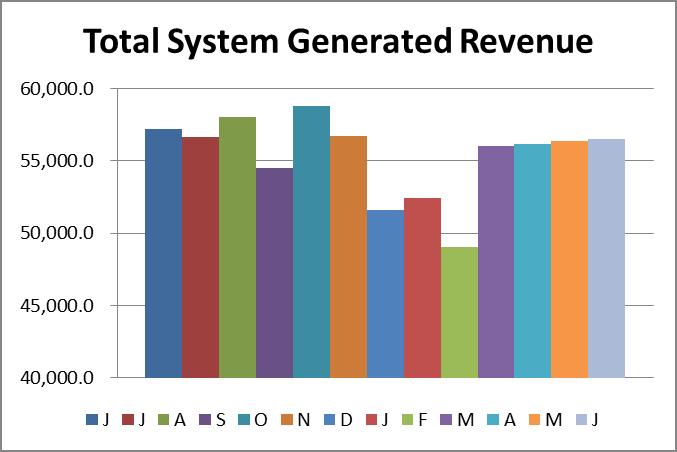
3 duration investments in the Damage Reserve Fund. Investment income is expected to improve for the balance of Other Revenue $ 3,019 $ 1,032 $ (1,940) $ 19,542 $ 7,388 $ (2,426) Other Revenue was favorable to budget for the month primarily due to $650K in additional revenue from the sale of property to City Colleges approved at the July 2014 Board meeting and other favorable miscellaneous revenue from sources such as ATM space rentals. Other Revenue is favorable for the year to date due to a sale of property with the City of Chicago, the additional grant revenue, and other miscellaneous revenue sources (such as parking lot revenue and scrap material sales) trending positively. Total System Generated Revenue $ 56,508 $ (128) $ (707) $ 326,596 $ 2,678 $ (6,053) Total System-Generated Revenue was $0.1 million less than budget for the month as fare revenue was less than budget and other revenue exceeded budget as described above. The $2.7 million year to date favorable variance is due to the additional non-capital grant revenue and sale of property, offsetting lower fare and pass revenues. IV. Expenses Labor $ 77,060 $ 1,333 $ 785 $ 477,368 $ 4,294 $ (6,439) Labor expense was $1.3 million less than budget for the month and $0.8 million less than prior year, mainly due to reduced overtime and the adjusted hiring strategy. For the year to date labor expense was $4.3 million less than budget and $6.4 million more than prior year. Overtime for the year to date exceeded budget by $5.1 million primarily due to the unseasonably cold and snowy weather during the first quarter. This has been offset by adjusting the hiring strategy and reducing overtime in future months. Labor expense is higher than the prior year because the Customer Service Assistant program was not fully implemented until mid-year 2013 and due to contractual increases in wages and salaries. 3
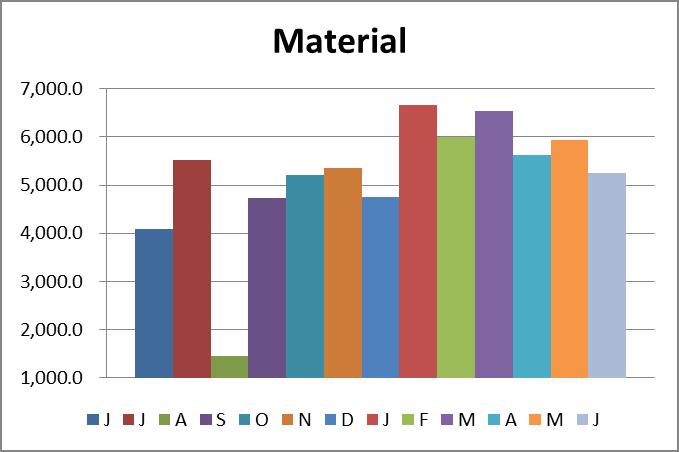
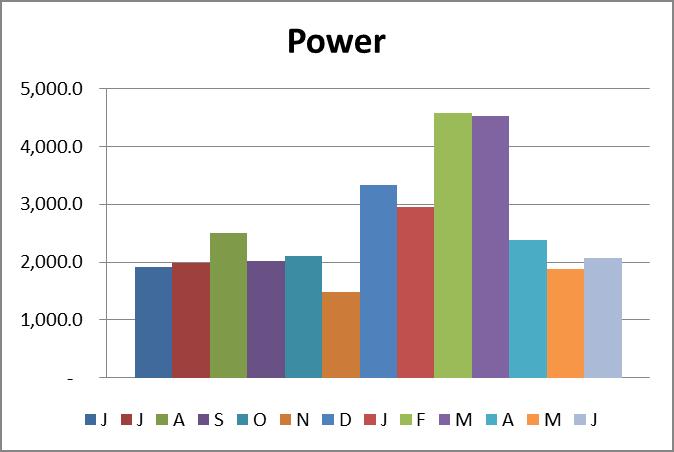
4 Material $ 5,253 $ (483) $ (1,176) $ 36,008 $ (4,891) $ (4,572) Material Expense was over budget by $0.5 million and $4.9 million for the month and year, respectively. Material expenses have been reduced compared to prior month trends but remain above budget. Bus shuttles supporting capital projects put more miles on the buses than anticipated. In addition, as vehicles undergo the overhaul process, additional work is performed as needed which increases the volume of material use. Fuel $ 4,304 $ 783 $ 997 $ 28,299 $ 1,417 $ 3,217 Fuel for Revenue Equipment expense was $0.8 million favorable to budget for the month based on a slightly lower volume and better pricing than anticipated. The year to date is favorable to budget and we expect to be on par or favorable with the overall budget for the remainder of 2014 by increasing the use of lower cost D2 fuel. The efficiency of the bus fleet has also improved, resulting in more miles per gallon. Overall price per gallon was $2.96 in June versus $3.10 in May. Power $ 2,074 $ (5) $ (152) $ 18,399 $ (4,211) $ (5,636) The Electric Power for Revenue Equipment expense was on par to budget for the month. The unfavorable variance for the year is due to the impact of severe weather conditions in the first quarter. Mild weather conditions in recent months did not require excess heating or cooling and therefore reduced the volume consumed. Provision Injuries & Damages $ - $ - $ 983 $ - $ - $ 5,896 Provision for Injuries and Damages was on par with budget. 4
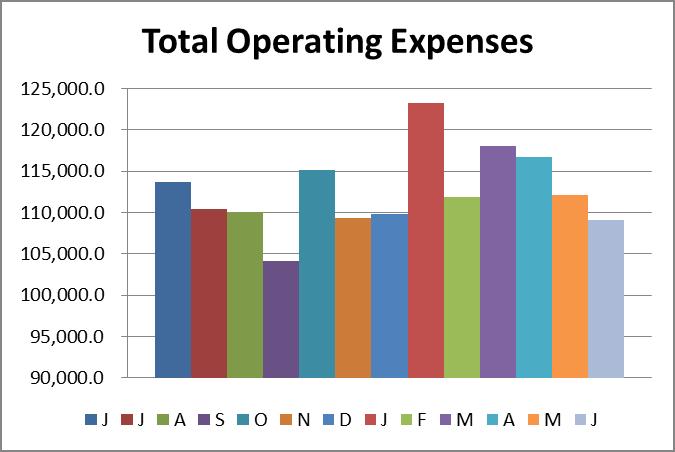
5 Purchase of Security Services $ 1,204 $ (44) $ 1,671 $ 6,294 $ 722 $ 9,798 Purchase of Security Services was slightly unfavorable to budget for the month. Security expense was $0.7 million favorable for the year primarily due to a one-time reclassification of charges eligible for grant reimbursement. Other Expenses $ 19,168 $ 2,580 $ 1,561 $ 124,648 $ 6,329 $ (11,186) Other Expenses was favorable to budget for the month due to lower equipment maintenance costs than anticipated. The year-to-date favorable variance includes a $1.7 million property damage reimbursement associated with a 2008 incident at the Cermak station. Of the total other expenses, the monthly pension obligation bond expense is $8.6 million; the remaining expenses are for utilities, maintenance contracts, services, and other expenses. Total Operating Expenses $ 109,063 $ 4,162 $ 4,670 $ 691,015 $ 3,659 $ (8,923) Operating Expenses were $4.2 million less than budget for the month and $3.7 million less than budget for the year to date. Operating expense was negatively impacted by severe weather in the first quarter of the year, primarily impacting materials and power categories. Since then, expenses have been favorable leading to an overall positive variance for the first half of the year. V. Recovery Ratio Recovery Ratio 63.21% % 1.12 Recovery Ratio, which measures the percentage of operating expenses CTA funds from internally generated revenues, was 63.21% for the month. This was favorable to budget by 5
6 3.18 percentage points. For the year to date the recovery ratio was 56.98% and is slightly favorable to budget. VI. Ridership Bus 22,390 (2,573) (2,687) 137,784 (11,650) (13,933) Rail 16, ,231 95,014 2,093 4,113 Rail to Rail Transfers 3,704 (199) (86) 21, Total 42,582 (2,297) (1,542) 254,007 (9,455) (8,898) Ridership for the month of June was 42.6 million and was 2.3 million less than budget and was 1.5 million less than prior year. Calendar adjusted ridership was down 4.8% from prior year. Ridership for the year to date was million and was 9.5 million less than budget and 8.9 million less than prior year. Calendar adjusted ridership was down 3.3% from prior year. More details on ridership can be found in the June Ridership Report 6
7 Cash & Liquidity 7


8 Cash & Liquidity (con t) Revenue 8
 9")
9 Revenue (con t) 9
")
10 Revenue (con t) 10

11 Expenses 11
")
12 Expenses (con t) 12
")
13 Expenses (con t) 13
Cash & Liquidity The chart below highlights CTA s cash position at November 2014 compared to November 2013.
 To: Chicago Transit Authority Board From: Ronald E. DeNard, Chief Financial Officer Re: Financial Results for November 2014 Date: January 12, 2015 I. Summary CTA s financial results are $1.9 million unfavorable
Cash & Liquidity The chart below highlights CTA s cash position at May 2014 compared to May 2013.
 To: Chicago Transit Authority Board From: Ron DeNard, Chief Financial Officer Re: Financial Results for May 2014 Date: July 16, 2014 I. Summary CTA s financial results are $5.6 million favorable for May
Ridership for the month is 39.4 million and is on par with budget. Ridership is 1.4 million or 3.6% higher than January 2014.
 To: Chicago Transit Authority Board From: Ron DeNard, Chief Financial Officer Re: Financial Results for January 2015 Date: March 6, 2015 I. Summary CTA s financial results are $2.0 million favorable for
Cash & Liquidity The chart below highlights CTA s cash position at February 2015 compared to February 2014.
 To: Chicago Transit Authority Board From: Ron DeNard, Chief Financial Officer Re: Financial Results for February 2015 Date: April 15, 2015 I. Summary CTA s financial results are favorable for the month
CTA s financial results are unfavorable by $0.5 million and $1.2 million for the month and year.
 To: Chicago Transit Authority Board From: Ron DeNard, Chief Financial Officer Re: Financial Results for May 2015 Date: July 13, 2015 I. Summary CTA s financial results are unfavorable by $0.5 million and
Cash & Liquidity The chart below highlights CTA s cash position at July 2015 compared to July 2014.
 To: Chicago Transit Authority Board From: Tom McKone, Acting CFO Re: Financial Results for July 2015 Date: September 4, 2015 I. Summary CTA s financial results are favorable by $1.9 million for the month
Cash & Liquidity The chart below highlights CTA s cash position at January 2016 compared to January 2015.
 To: Chicago Transit Authority Board From: Tom McKone, Acting Chief Financial Officer Re: Financial Results for January 2016 Date: March 9, 2016 I. Summary CTA s financial results are $0.8 million unfavorable
Cash & Liquidity The chart below highlights CTA s cash position at March 2017 compared to March 2016.
 To: Chicago Transit Authority Board From: Jeremy Fine, Chief Financial Officer Re: Financial Results for March 2017 Date: May 10, 2017 I. Summary CTA s financial results are $0.6 million favorable to budget
Cash & Liquidity The chart below highlights CTA s cash position at February 2017 compared to February 2016.
 To: Chicago Transit Authority Board From: Jeremy Fine, Chief Financial Officer Re: Financial Results for February 2017 Date: April 5, 2017 I. Summary CTA s financial results are $0.3 million favorable
Cash & Liquidity The chart below highlights CTA s cash position at August 2018 compared to August 2017.
 To: Chicago Transit Authority Board From: Jeremy Fine, Chief Financial Officer Re: Financial Results for August 2018 Date: October 10, 2018 I. Summary CTA s financial results are favorable to budget for
Cash & Liquidity The chart below highlights CTA s cash position at January 2018 compared to January 2017.
 To: Chicago Transit Authority Board From: Jeremy Fine, Chief Financial Officer Re: Financial Results for January 2018 Date: March 14, 2018 I. Summary CTA s financial results are $1.7 million unfavorable
Cash & Liquidity The chart below highlights CTA s cash position at June 2018 compared to June 2017.
 To: Chicago Transit Authority Board From: Jeremy Fine, Chief Financial Officer Re: Financial Results for June 2018 Date: August 15, 2018 I. Summary CTA s financial results are unfavorable to budget for
Cash & Liquidity The chart below highlights CTA s cash position at March 2018 compared to March 2017.
 To: Chicago Transit Authority Board From: Jeremy Fine, Chief Financial Officer Re: Financial Results for March 2018 Date: May 9, 2018 I. Summary CTA s financial results are $0.9 million favorable to budget
Cash & Liquidity The chart below highlights CTA s cash position at February 2016 compared to February 2015.
 To: Chicago Transit Authority Board From: Jeremy Fine, Chief Financial Officer Re: Financial Results for February 2016 Date: April 6, 2016 I. Summary CTA s financial results are $2.7 million favorable
Cash & Liquidity The chart below highlights CTA s cash position at December 2017 compared to December 2016.
 To: Chicago Transit Authority Board From: Jeremy Fine, Chief Financial Officer Re: Financial Results for December 2017 Date: February 14, 2018 I. Summary CTA s financial results are $4.7 million favorable
Cash & Liquidity The chart below highlights CTA s cash position at September 2017 compared to September 2016.
 To: Chicago Transit Authority Board From: Jeremy Fine, Chief Financial Officer Re: Financial Results for September 2017 Date: November 15, 2017 I. Summary CTA s financial results are $7.7 million favorable
The year to date is less than budget and prior year by 15.4 million and 11.6 million, respectively.
 To: Chicago Transit Authority Board From: Jeremy Fine, Chief Financial Officer Re: Financial Results for September 2016 Date: November 16, 2016 I. Summary CTA s financial results are $0.3 million unfavorable
Cash & Liquidity The chart below highlights CTA s cash position at July 2016 compared to July 2015.
 To: Chicago Transit Authority Board From: Jeremy Fine, Chief Financial Officer Re: Financial Results for July 2016 Date: September 14, 2016 I. Summary CTA s financial results are $0.4 million favorable
Suburban Service and Regional ADA Budget Results January 2019
 and Regional Results January 2019 Department of Internal Services Issued March 2019 Performance At-A-Glance January 2019 (Millions) $25 $20 $17 $15 $10 $5 $0 ($5) Generated Public Expenses Net Results
METRO. Fiscal Year 2012 Monthly Board Report. September 2012 (Fourth Quarter Fiscal Year-to-Date)
") METRO Fiscal Year 2012 Monthly Board Report Revenue Expense Ridership Performance (Fourth Quarter Fiscal Year-to-Date) This report is based on a preliminary closing of the year-end financials for FY2012
METRO Fiscal Year 2012 Monthly Board Report Revenue Expense Ridership Performance (Fourth Quarter Fiscal Year-to-Date) This report is based on a preliminary closing of the year-end financials for FY2012
CHICAGO TRANSIT AUTHORITY. FINANCIAL STATEMENTS AND SUPPLEMENTARY INFORMATION December 31, 2010 and 2009 (With Independent Auditors Report Thereon)
") FINANCIAL STATEMENTS AND SUPPLEMENTARY INFORMATION (With Independent Auditors Report Thereon) Chicago, Illinois FINANCIAL STATEMENTS CONTENTS Independent Auditors Report... 1 Management s Discussion and
FINANCIAL STATEMENTS AND SUPPLEMENTARY INFORMATION (With Independent Auditors Report Thereon) Chicago, Illinois FINANCIAL STATEMENTS CONTENTS Independent Auditors Report... 1 Management s Discussion and
Operating Budget. Second Quarter Financial Report
 Second Quarter Financial Report INDEX A. Executive Summary... A-1 B. Revenue and Expense Analysis... B-1 C. Budget Variance Reports... C-1 D. Ridership and Performance Measures... D-1 Board Budget Committee
1 ST QUARTER 2017 QUARTERLY FINANCIAL AND PERFORMANCE REPORT
 1 ST QUARTER 2017 QUARTERLY FINANCIAL AND PERFORMANCE REPORT May 2017 0 1 st Quarter 2017 Financial and Performance Report Table of Contents Executive Summary... 2 Environmental Factors... 4 Ridership...
CHICAGO TRANSIT AUTHORITY. FINANCIAL STATEMENTS AND SUPPLEMENTARY INFORMATION December 31, 2011 and 2010 (With Independent Auditors Report Thereon)
") FINANCIAL STATEMENTS AND SUPPLEMENTARY INFORMATION (With Independent Auditors Report Thereon) Chicago, Illinois FINANCIAL STATEMENTS CONTENTS Independent Auditors Report... 1 Management s Discussion and
FINANCIAL STATEMENTS AND SUPPLEMENTARY INFORMATION (With Independent Auditors Report Thereon) Chicago, Illinois FINANCIAL STATEMENTS CONTENTS Independent Auditors Report... 1 Management s Discussion and
REGIONAL TRANSPORTATION DISTRICT, COLORADO
 REGIONAL TRANSPORTATION DISTRICT, COLORADO Series 2004 Lease RTD Active Fleet of the District Fiscal Year Ended December 31, 2013 Fixed Route Bus Fleet Number RTD Owned Fixed Route Buses 40' Transit Coaches
REGIONAL TRANSPORTATION DISTRICT, COLORADO AS OF DECEMBER 31, 2015
 AS OF DECEMBER 31, RTD Active Fleet of the District Fixed Route Bus Fleet: Number RTD Owned- Fixed Route Buses 40' Transit Coaches 620 Articulated Buses 110 Intercity Coaches 175 Mall Shuttles 37 30' Transit
FY2018 Third Quarter Financial Update
 Finance and Committee Information Item IV-A May 10, 2018 Third Quarter Financial Update Page 30 of 53 Washington Metropolitan Area Transit Authority Board Action/Information Summary Action Information
METRO. Fiscal Year 2012 Monthly Board Report. December 2011 (First Quarter Fiscal Year-to-Date)
") METRO Fiscal Year 2012 Monthly Board Report Revenue Expense Ridership Performance (First Quarter Fiscal Year-to-Date) 1/27/2012 Table of Contents Section A Section B Section C Section D Section E Section
METRO Fiscal Year 2012 Monthly Board Report Revenue Expense Ridership Performance (First Quarter Fiscal Year-to-Date) 1/27/2012 Table of Contents Section A Section B Section C Section D Section E Section
3 RD QUARTER 2016 QUARTERLY FINANCIAL AND PERFORMANCE REPORT
 3 RD QUARTER 2016 QUARTERLY FINANCIAL AND PERFORMANCE REPORT November 2016 0 3 rd Quarter 2016 Financial and Performance Report Table of Contents Executive Summary... 1 Environmental Factors... 3 Ridership...
METRO. Fiscal Year 2013 Monthly Board Report. December 2012 (First Quarter Fiscal Year-to-Date)
") METRO Fiscal Year 2013 Monthly Board Report Revenue Expense Ridership Performance (First Quarter Fiscal Year-to-Date) 1/14/2013 Table of Contents Section A Section B Section C Section D Section E Section
METRO Fiscal Year 2013 Monthly Board Report Revenue Expense Ridership Performance (First Quarter Fiscal Year-to-Date) 1/14/2013 Table of Contents Section A Section B Section C Section D Section E Section
METRO MONTHLY BOARD REPORT
 METRO Revenue Expenses Service Performance Fiscal Year FY2011 Table of Contents Section A Section B Section C Section D Section E Section F Section G Section H Summary Sales Tax Revenue Fare Revenue Operating
4TH QUARTER 2016 QUARTERLY FINANCIAL AND PERFORMANCE REPORT
 4TH QUARTER 2016 QUARTERLY FINANCIAL AND PERFORMANCE REPORT February 2017 0 Quarterly Financial and Performance Report 4th Quarter 2016 4th Quarter 2016 Financial and Performance Report Table of Contents
New York City Transit
 New York City Transit MTA New York City Transit 2008 Preliminary Budget July Financial Plan 2008 2011 MISSION STATEMENT The mission of MTA New York City Transit is to provide customers with safe, reliable
Operating Budget. Third Quarter Financial Report (July 2005 March 2006)
") Third Quarter Financial Report (July 2005 March 2006) INDEX A. Executive Summary...page 2 B. Revenue and Expense Analysis...page 3 C. Budget Variance Reports...page 14 D. Ridership and Performance Measures...page
Third Quarter Financial Report (July 2005 March 2006) INDEX A. Executive Summary...page 2 B. Revenue and Expense Analysis...page 3 C. Budget Variance Reports...page 14 D. Ridership and Performance Measures...page
Operating Budget Stability
 Operating Budget Stability March Financial Update Report to Agenda Executive Summary March Performance Against FY16 Budget March Performance Against Same Period Last Year Appendix Financial Detail: March
($ in millions) Mid-Year
 Mid-Year") Table 1 Actual Variance Percent Actual Variance Percent Actual Variance Percent Revenue Farebox Revenue $379.0 $381.0 $2.0 0.5 $0.0 $0.0 $0.0 - $379.0 $381.0 $2.0 0.5 Vehicle Toll Revenue 122.6 125.2 2.5
Table 1 Actual Variance Percent Actual Variance Percent Actual Variance Percent Revenue Farebox Revenue $379.0 $381.0 $2.0 0.5 $0.0 $0.0 $0.0 - $379.0 $381.0 $2.0 0.5 Vehicle Toll Revenue 122.6 125.2 2.5
Operating Budget Report
 Operating Budget Report MTD Operating Budget ($ in Millions) Sept-FY2012 Sept-FY2013 Variance FY13 Actual Actual Budget $ Percent $140M Operating Expenditures ($ in Millions) Revenue $ 67 $ 68 $ 71 $ (3)
METRO. Fiscal Year 2013 Monthly Board Report. November 2012
 METRO Fiscal Year 2013 Monthly Board Report Revenue Expense Ridership Performance 12/13/2012 Table of Contents Section A Section B Section C Section D Section E Section F Section G Section H Section I
What is the Regional Guaranteed Ride Home (GRH) Program?
 Program?") What is the Regional Guaranteed Ride Home (GRH) Program? Multi-county sponsored program Reimburses cost of emergency rides for ridesharing employees Employers must enroll through their local County Transportation
What is the Regional Guaranteed Ride Home (GRH) Program? Multi-county sponsored program Reimburses cost of emergency rides for ridesharing employees Employers must enroll through their local County Transportation
FY2014 Operating Budget Performance Report
 Finance & Administration Committee Information Item IV-C September 11, 2014 FY2014 Operating Budget Performance Report Washington Metropolitan Area Transit Authority Board Action/Information Summary Action
METRO. Fiscal Year 2013 Monthly Board Report. January 2013
 METRO Fiscal Year 2013 Monthly Board Report Revenue Expense Ridership Performance 2/14/2013 Table of Contents Section A Section B Section C Section D Section E Section F Section G Section H Section I Section
Operating Budget Report
 Operating Budget Report MTD Operating Budget ($ in Millions) Oct-FY2012 Oct-FY2013 Variance FY13 Actual Actual Budget $ Percent $140M Operating Expenditures ($ in Millions) Revenue $ 67 $ 70 $ 79 $ (8)
4 TH QUARTER 2017 QUARTERLY FINANCIAL AND PERFORMANCE REPORT
 4 TH QUARTER 2017 QUARTERLY FINANCIAL AND PERFORMANCE REPORT February 2018 0 4 th Quarter 2017 Financial and Performance Report Table of Contents Executive Summary... 2 Environmental Factors... 4 Ridership...
CHICAGO TRANSIT AUTHORITY CHICAGO, ILLINOIS
 CHICAGO, ILLINOIS FINANCIAL STATEMENTS AND SUPPLEMENTARY INFORMATION Years Ended (With Independent Auditor s Report Thereon) Chicago, Illinois FINANCIAL STATEMENTS Years Ended TABLE OF CONTENTS Independent
2 ND QUARTER 2017 QUARTERLY FINANCIAL AND PERFORMANCE REPORT
 2 ND QUARTER 2017 QUARTERLY FINANCIAL AND PERFORMANCE REPORT August 2017 0 2 nd Quarter 2017 Financial and Performance Report Table of Contents Executive Summary... 2 Environmental Factors... 4 Ridership...
Operating Budget Report
 Operating Report Operating ($ in Millions) Operating Expenditures ($ in Millions) Jun-11 Jun-12 $ Percent Revenue $ 212,640 $ 217,643 $ 214,671 $ 2,973 1% Expense $ 359,102 $ 361,882 $ 366,332 $ 4,450
3RD QUARTER November 2018
 3RD QUARTER 2018 November 2018 0 Quarterly Financial and Performance Report 3rd Quarter 2018 3rd Quarter 2018 Financial and Performance Report Table of Contents Executive Summary... 2 Environmental Factors...
FY2018 Second Quarter Financial Update
 Finance and Committee Information Item III-A February 8, 2018 Second Quarter Financial Update 4 of 52 Washington Metropolitan Area Transit Authority Board Action/Information Summary Action Information
Operating Budget Stability Q1 FY17 Financial Update
 Operating Budget Stability Q1 FY17 Financial Update Report to Fiscal and Management Control Board Without action, operating deficit was on track to reach $427M by FY20 STATUS QUO FY17 PRO FORMA 8.1.2015
FY2017 Year-End Financial Update
 Finance Committee Information Item III-A September 14, 2017 FY2017 Year-End Financial Update Washington Metropolitan Area Transit Authority Board Action/Information Summary Action Information MEAD Number:
METRO. Fiscal Year 2015 Monthly Board Report. February 2015
 METRO Fiscal Year 2015 Monthly Board Report Revenue Expense Ridership Performance 4/2/2015 Table of Contents Section A Section B Section C Section D Section E Section F Section G Section H Section I Section
METRO. Fiscal Year Monthly Performance Report. Revenue Expense Ridership Performance. November 2018 (Third Quarter Fiscal Year-to Date)
") METRO Fiscal Year 2019 Monthly Performance Report Revenue Expense Ridership Performance (Third Quarter Fiscal Year-to Date) 12/12/2018 Table of Contents Section A Section B Section C Section D Section
METRO Fiscal Year 2019 Monthly Performance Report Revenue Expense Ridership Performance (Third Quarter Fiscal Year-to Date) 12/12/2018 Table of Contents Section A Section B Section C Section D Section
3 RD QUARTER 2017 QUARTERLY FINANCIAL AND PERFORMANCE REPORT
 3 RD QUARTER 2017 QUARTERLY FINANCIAL AND PERFORMANCE REPORT November 2017 0 3 rd Quarter 2017 Financial and Performance Report Table of Contents Executive Summary... 2 Environmental Factors... 4 Ridership...
May 31, 2016 Financial Report
 2016 May 31, 2016 Financial Report Capital Metropolitan Transportation Authority 7/13/2016 Table of Contents SUMMARY REPORTS Budgetary Performance - Revenue 2 - Sales Tax Revenue 6 - Operating Expenses
Financial Report - FY 2017 Year to Date May 31, 2017
 Financial Report - FY 2017 Year to Date July 19, 2017 1 Major Highlights Revenue Sales tax remittances received through YTD April 2017 are 4.2% higher than YTD April 2016 Plaza Saltillo lease income budgeted
ADOPTED 2017 OPERATING BUDGET AND CAPITAL PROGRAM
 2017 Budget December 2016 ADOPTED 2017 OPERATING BUDGET AND CAPITAL PROGRAM Summary Briefing of the Adopted Operating Budgets, Two-Year Financial Plans, and Five-Year Capital Programs of the RTA, CTA,
METRO. Fiscal Year 2014 Monthly Board Report. May 2014
 METRO Fiscal Year 2014 Monthly Board Report Revenue Expense Ridership Performance 7/11/2014 Table of Contents Section A Section B Section C Section D Section E Section F Section G Section H Section I Section
CHICAGO TRANSIT AUTHORITY PRESIDENT S FY2017 BUDGET RECOMMENDATIONS. Analysis and Recommendations
 CHICAGO TRANSIT AUTHORITY PRESIDENT S FY2017 BUDGET RECOMMENDATIONS Analysis and Recommendations November 14, 2016 TABLE OF CONTENTS EXECUTIVE SUMMARY... 1 CIVIC FEDERATION POSITION... 3 ISSUES THE CIVIC
METRO. Fiscal Year Monthly Performance Report. Revenue Expense Ridership Performance. February 2018 (First Quarter Fiscal Year-to Date)
") METRO Fiscal Year 2018 Monthly Performance Report Revenue Expense Ridership Performance (First Quarter Fiscal Year-to Date) 3/12/2018 Table of Contents Section A Section B Section C Section D Section E
METRO Fiscal Year 2018 Monthly Performance Report Revenue Expense Ridership Performance (First Quarter Fiscal Year-to Date) 3/12/2018 Table of Contents Section A Section B Section C Section D Section E
Capital Metropolitan Transportation Authority
 Capital Metropolitan Transportation Authority Monthly Performance Report (Covering Performance Data Through March and April 2010) Capital Metropolitan Transportation Authority 1 Performance Report Contents
Section I Year-to-date revenues collected and projected revenues and expenditures for the current fiscal year
 Report to Secretary of Administration and Finance and House and Senate Committees on Ways and Means regarding Revenue Projections and Changes to Fare and Fee Structure of the Massachusetts Bay Transportation
Operating Budget Report
 Operating Budget Report Operating Budget ($ in Millions) Operating Expenditures ($ in Millions) MTD May-FY2011 May - FY2012 Variance FY12 Actual Actual Budget $ Percent $140M Revenue $ 68,140 $ 70,480
Dallas Area Rapid Transit Dallas, Texas. Financial Statements Years Ended September 30, 2016 and 2015 and Independent Auditor s Report
 Dallas Area Rapid Transit Dallas, Texas Financial Statements Years Ended September 30, 2016 and 2015 and Independent Auditor s Report DALLAS, TEXAS FINANCIAL STATEMENTS AS OF AND FOR THE YEARS ENDED SEPTEMBER
Washington Metropolitan Area Transit Authority Metro Budget Overview
 Washington Metropolitan Area Transit Authority Metro Budget Overview February 2011 Metro 10,877 Employees (10,974 budgeted) 1,491 Buses 588 Escalators and 237 Elevators 106 Miles of Track 92 Traction Power
MTA Long Island Rail Road
 MTA Long Island Rail Road Budget July Financial Plan -2008 MISSION STATEMENT The mission of the MTA Long Island Rail Road is to provide a safe, accessible, clean, cost-effective, customer-focused rail
SOUTHEASTERN PENNSYLVANIA TRANSPORTATION AUTHORITY. Financial Statements June 30, 2018 and (With Independent Auditors Report Thereon)
") SOUTHEASTERN PENNSYLVANIA TRANSPORTATION AUTHORITY Financial Statements June 30, 2018 and 2017 (With Independent Auditors Report Thereon) SOUTHEASTERN PENNSYLVANIA TRANSPORTATION AUTHORITY YEARS ENDED
SOUTHEASTERN PENNSYLVANIA TRANSPORTATION AUTHORITY Financial Statements June 30, 2018 and 2017 (With Independent Auditors Report Thereon) SOUTHEASTERN PENNSYLVANIA TRANSPORTATION AUTHORITY YEARS ENDED
CTA 2007 Contingency Plan
 CTA 2007 Contingency Plan JUST THE FACTS RTA Directive Unless the RTA Board makes a determination no later than July 1, 2007, that the funds identified as new transit funding are available for 2007 such
OPERATING BUDGET REPORT
 OPERATING BUDGET REPORT OPERATING BUDGET ($ in Millions) MTD Nov-FY2012 Nov-FY2013 Actual Actual Budget $ Percent Revenue $ 63.0 $ 65.7 $ 68.3 $ (2.7) -3.9% Expense $ 107.6 $ 124.8 $ 129.8 $ 5.0 3.8% Subsidy
METRO. Fiscal Year Monthly Performance Report. Revenue Expense Ridership Performance. May 2018 (Second Quarter Fiscal Year-to Date)
") METRO Fiscal Year 2018 Monthly Performance Report Revenue Expense Ridership Performance (Second Quarter Fiscal Year-to Date) 6/12/2018 Table of Contents Section A Section B Section C Section D Section
METRO Fiscal Year 2018 Monthly Performance Report Revenue Expense Ridership Performance (Second Quarter Fiscal Year-to Date) 6/12/2018 Table of Contents Section A Section B Section C Section D Section
Adopted 2018 OPERATING BUDGET Two-Year Financial Plan and Five-Year CAPITAL PROGRAM
 2018 Adopted 2018 OPERATING BUDGET Two-Year Financial Plan and Five-Year CAPITAL PROGRAM MOVING YOU Northeastern Illinois December 2017 RTA Board of Directors Kirk Dillard Chairman Anthony K. Anderson
BUDGETWATCH March 2019 Flash Report
 March 2019 Flash Report Overall Latest Condition (reporting on operations through February and subsidies through March): Overall, YTD preliminary net results were favorable mainly reflecting lower operating
1ST QUARTER May 2018
 1ST QUARTER 2018 May 2018 0 1 st Quarter 2018 Financial and Performance Report Table of Contents Executive Summary... 2 Environmental Factors... 4 Ridership... 6 Peer Ridership Comparison... 7 Operating
FY2011 Budget Forum. District of Columbia. October 19, 2009
 FY2011 Budget Forum District of Columbia October 19, 2009 0 Meeting agenda What is Metro and what is the value of Metro service? What are the Fiscal Year 2011 budget challenges? What are the potential
Under the proposed Fee Schedule, the permit fees would be adjusted as follows:
 6.8 Pursuant to California law, if fees are charged by a local agency in connection with permit issuance, the fees may not exceed the estimated reasonable cost of providing the service for which the fee
RIVERSIDE TRANSIT AGENCY 1825 Third Street Riverside, CA November 17, 2005
 RIVERSIDE TRANSIT AGENCY 1825 Third Street Riverside, CA 92507 November 17, 2005 TO: THRU: FROM: SUBJECT: Summary: BOARD OF DIRECTORS Larry Rubio, Chief Executive Officer Chris Gallanes, Chief Financial
2004 Operating and Capital Program Financial Plan for Operations, and Capital Plan
 PAST AND FUTURE RESPONSIBLE PUBLIC SERVICE 2004 Operating and Capital Program 2004 2006 2006 Financial Plan for Operations, and 2004 2008 2008 Capital Plan A Fresh Approach To Public Transportation Final
Board of Directors. John J. Case, Chairman. Terrance M. Carr, Director West Central Suburban Cook County
 Final Program November 2003 Board of Directors John J. Case, Chairman Terrance M. Carr, Director West Central Suburban Cook County James C. Harris, Director South Suburban Cook County Richard A. Kwasneski,
2017 November Financial Plan Presentation to the Board November 15, 2017
 2017 November Financial Plan 2018-2021 Presentation to the Board November 15, 2017 The 2017 July Plan projected breakeven/small cash balances through 2019 with gaps of $112 million and $493 million in
MTA METRO-NORTH RAILROAD FINANCIAL STATEMENTS MONTH ENDED: MARCH 31, 2010
 FINANCIAL STATEMENTS MONTH ENDED: MARCH 31, 2010 OFFICE OF VICE PRESIDENT OF FINANCE & INFORMAnON SYSTEMS FEBRUARY FINANCIAL PLAN 2010 ADOPTED BUDGET ACCRUAL STATEMENT of OPERATIONS by CATEGORY March 2010
Financial Report Fiscal Year 2018
 Financial Report Fiscal Year 2018 Year to Date March 31, 2018 Presented on May 21, 2018 1 Major Highlights Revenue FY2018 sales tax revenue budgeted at 2.5% growth over FY2017 Sales tax remittances received
Quarterly Budget Report
 City of Chicago Quarterly Report 2 nd Quarter Mayor Rahm Emanuel Quarterly Report-2 nd Quarter Content and Purpose This quarterly report presents an overview of the City s operating revenues and expenditures
BUDGETWATCH March 2016 Flash Report
 March 2016 Flash Report Summary of February Budgetwatch (reporting on operations through January and subsidies through February): Overall results through February were slightly favorable. Net operating
New York City Transit Authority Consolidated Financial Statements Management s Discussion and Analysis December 31, 2004 and 2003
 New York City Transit Authority Consolidated Financial Statements Management s Discussion and Analysis Index Page(s) Independent Auditors Report... 1 Management s Discussion and Analysis... 2 12 Consolidated
Public Authorities by the Numbers: Capital District Transportation Authority
 Public Authorities by the Numbers: Capital District Transportation Authority June 2016 Table of Contents I. EXECUTIVE SUMMARY... 1 II. CAPITAL DISTRICT TRANSPORTATION AUTHORITY BY THE NUMBERS... 2 Introduction...
Annual Performance Report Proposal MassDOT SFY Prepared by OPM&I November, 2015
 Annual Performance Report Proposal MassDOT SF 2015 Prepared by OPM&I ovember, 2015 Legislative Mandate Acts of 2009 Established the Office of Performance Management & Innovation Charged with working with
BUDGETWATCH October 2018 Flash Report
 October 2018 Flash Report Overall Latest Condition (reporting on operations through September and subsidies through October): Passenger Revenues were slightly below the Forecast in September, marginally
COMPARISON OF NUCLEAR OUTAGE OM&A
 Filed: 0-0- Page of 0 0 0 COMPARISON OF NUCLEAR OUTAGE OM&A.0 PURPOSE This evidence presents period-over-period comparisons of outage OM&A by station for 0-0 in support of the approval of OPG s forecast
SOUTHEASTERN PENNSYLVANIA TRANSPORTATION AUTHORITY. Financial Statements June 30, 2017 and (With Independent Auditors Report Thereon)
") SOUTHEASTERN PENNSYLVANIA TRANSPORTATION AUTHORITY Financial Statements June 30, 2017 and 2016 (With Independent Auditors Report Thereon) SOUTHEASTERN PENNSYLVANIA TRANSPORTATION AUTHORITY YEARS ENDED
SOUTHEASTERN PENNSYLVANIA TRANSPORTATION AUTHORITY Financial Statements June 30, 2017 and 2016 (With Independent Auditors Report Thereon) SOUTHEASTERN PENNSYLVANIA TRANSPORTATION AUTHORITY YEARS ENDED
METRO. Fiscal Year 2017 Monthly Performance Report. Revenue Expense Ridership Performance. October 2016
 METRO Fiscal Year 2017 Monthly Performance Report Revenue Expense Ridership Performance 11/18/2016 Table of Contents Section A Section B Section C Section D Section E Section F Section G Section H Section
COMMUTER RAIL DIVISION OF THE REGIONAL TRANSPORTATION AUTHORITY AND THE NORTHEAST ILLINOIS REGIONAL COMMUTER RAILROAD CORPORATION
 Financial Statements and Supplementary Information (With Independent Auditors Report Thereon) Table of Contents Page(s) Independent Auditors Report 1 2 Management s Discussion and Analysis (Unaudited)
Chicago Transit Authority Financial Statements for the Years Ended December 31, 1999 and 1998 and Supplementary Information and Independent Auditors'
 Chicago Transit Authority Financial Statements for the Years Ended December 31, 1999 and 1998 and Supplementary Information and Independent Auditors' Report TABLE OF CONTENTS Page INDEPENDENT AUDITORS'
YOSEMITE AREA REGIONAL TRANSPORTATION SYSTEM FINANCIAL STATEMENTS AND INDEPENDENT AUDITOR S REPORT FOR THE YEAR ENDED JUNE 30, 2016
 YOSEMITE AREA REGIONAL TRANSPORTATION SYSTEM FINANCIAL STATEMENTS AND INDEPENDENT AUDITOR S REPORT FOR THE YEAR ENDED JUNE 30, 2016 JUNE 30, 2016 TABLE OF CONTENTS Page FINANCIAL SECTION Independent Auditor
- II OPERATING BUDGET REPORT ^ H FY2013 ^^ H. ««-ms. I ~?j i... \6.3 j^^^^^^ YTD OVERTIME BUDGET VS ACTUAL ($ in Millions) 1
 1") OPERATING BUDGET REPORT ^ H FY2013 ^^ H OPERATING BUDGET($ in Millions) MTD Revenue Expense Subsidy Cost Recovery YTD Revenue Expense Subsidy Cost Recovery Jan-FY2012 Jan-FY2013 Variance FY13 Actual Actual
OPERATING BUDGET REPORT ^ H FY2013 ^^ H OPERATING BUDGET($ in Millions) MTD Revenue Expense Subsidy Cost Recovery YTD Revenue Expense Subsidy Cost Recovery Jan-FY2012 Jan-FY2013 Variance FY13 Actual Actual
Budget Performance in Millions of Dollars Favorable/Unfavorable to Budget. Suburban Suburban
 v System Status Budget Performance in Millions of Dollars Favorable/Unfavorable to Budget 6 4 2 0-2 -4-6 -8 Suburban Suburban Suburban ADA Suburban ADA ADA ADA Revenue Expenses Funding Required Net Funding
BUDGETWATCH April 2015 Flash Report
 BUDGETWATCH April 2015 Flash Report Summary of March Budgetwatch (reporting on operations through February and subsidies through March): Overall, results through March were favorable mainly as a result
FY06 Operating Budget. FY2006 Proposed Operating Budget. Final Summary for Board Referral
 FY2006 Proposed Operating Budget Final Summary for Board Referral 1 Operating Statements Subsidy nearly $10M lower than December proposal Dec Base Other Subtot Mar Prop$ Adj Adj Changes Prop$ Revenues
Financial Plan. Section 8 STATUS QUO PLAN STATUS QUO PLAN ASSUMPTIONS STATUS QUO PLAN BUDGET ITEMS
 Section 8 Financial Plan This final section of the TDP contains the financial information with regard to the improvements described in Section 7, Alternatives. The financial information is divided into
Getting Metro Back on Track
 NVTC Presents: Getting Metro Back on Track A discussion with Virginia members of the WMATA Board @NovaTransit This forum is sponsored by the Northern Virginia Transportation Commission. Learn more about
8. FINANCIAL ANALYSIS
 8. FINANCIAL ANALYSIS This chapter presents the financial analysis conducted for the Locally Preferred Alternative (LPA) selected by the Metropolitan Transit Authority of Harris County (METRO) for the.
Financial Update for the Period Ended April 7, 2018
 For Information Financial Update for the Period Ended April 7, 2018 Date: June 12, 2018 To: TTC Board From: Chief Financial Officer Summary The purpose of this report is to provide the Board with the operating