Ridership for the month is 39.4 million and is on par with budget. Ridership is 1.4 million or 3.6% higher than January 2014.
|
|
|
- Andrew Mitchell
- 5 years ago
- Views:
Transcription

1 To: Chicago Transit Authority Board From: Ron DeNard, Chief Financial Officer Re: Financial Results for January 2015 Date: March 6, 2015 I. Summary CTA s financial results are $2.0 million favorable for January. Both operating expenses and system generated revenues are favorable to budget for the month. Ridership for the month is 39.4 million and is on par with budget. Ridership is 1.4 million or 3.6% higher than January II. Cash & Liquidity The chart below highlights CTA s cash position at January 2015 compared to January Jan Jan Increase (Decrease) Unrestricted Cash $ $ $ 18.4 Damage Reserve $ (8.7) Funds Owed by RTA $ (22.8) Trust Portfolio Assets $ Total Cash and Receivables $ 1,134.2 $ $ CTA s total cash/receivables balance is equal to $1.1 billion. Unrestricted cash was $18.4 million more than the prior year due an improvement in the cash flow lag for PTF (Public Transportation Funding) collections from five to four months. The cash in Damage Reserve is sufficiently funded and was $8.7 million lower than last year reflecting payouts for settled claims. Funds owed by the RTA were approximately $237.1 million which was $22.8 million less than the prior year. CTA continues to work closely with the RTA to monitor their receivable balance owed; Trust Portfolio Assets represents bond proceeds held in Trust for funding capital projects and making required debt service payments. 1
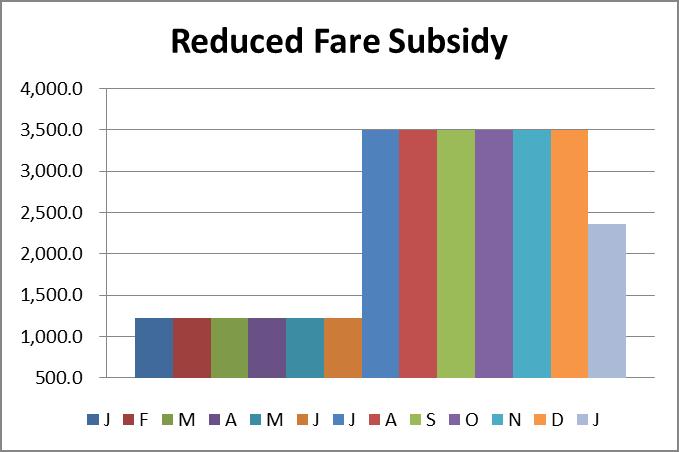
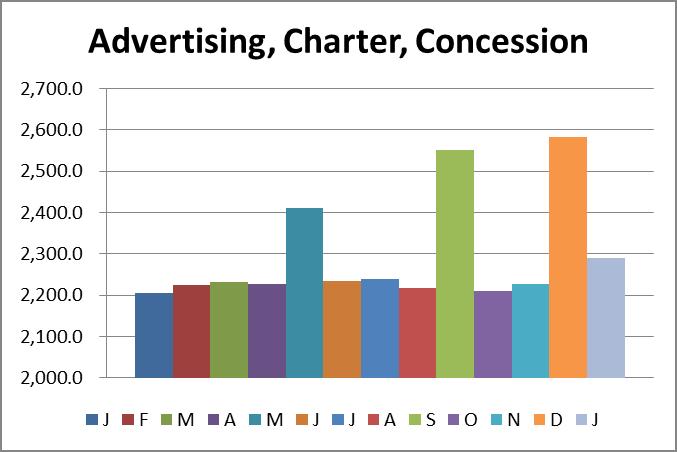
2 III. Revenue Fare & Pass Revenue $ 44,481 $ 449 $ (28) $ 44,481 $ 449 $ (28) Fare and pass revenue for January was $0.4 million favorable to budget and flat to prior year. The variance to prior year is impacted by one less workday in January 2015 and offset by the effect of the 2014 polar vortex. The average fare for the month was $1.13 and was $0.01 more than budget. The January 2014 average fare was $1.17 and unusually high because of the drop in ridership due to the polar vortex across lower average fare categories, such as students. Reduced Fare Subsidy $ 2,360 $ - $ 1,143 $ 2,360 $ - $ 1,143 Reduced Fare Subsidy is on par with budget for the month and is $1.1 million higher than prior year due to the timing of the 2014 mid-year reinstatement of funding. Advertising, Charter, Concession $ 2,290 $ (81) $ 84 $ 2,290 $ (81) $ 84 Advertising, Charter and Concessions Revenue is slightly unfavorable to budget for the month due to an unbudgeted advertising program cost. The increase over prior year is due to higher special contract guarantees, concession contracts, and the annual increase in vehicle and platform advertising minimum guarantee. Investment income $ 403 $ 347 $ 281 $ 403 $ 347 $ 281 Investment income was higher than budget for the month and prior year due to an accounting adjustment. Excluding the adjustment, investment income was higher than budget by 54k. 2
3 Other Revenue $ 2,289 $ 214 $ (2,092) $ 2,289 $ 214 $ (2,092) Other Revenue was favorable to budget for the month due to miscellaneous revenues from rentals and reimbursements. It is lower than prior year due to a one-time sale of property in Total System Generated Revenue $ 51,824 $ 929 $ (611) $ 51,824 $ 929 $ (611) Total System-Generated Revenue was $0.9 million more than budget for the month primarily due to higher fare and pass revenue than anticipated. Total System-Generated Revenue is $0.6 million less than prior year due to the sale of property in IV. Expenses Labor $ 82,569 $ 1,036 $ 2,397 $ 82,569 $ 1,036 $ 2,397 Labor expense was $1.0 million favorable to budget for the month, mainly due to timing of hiring for the year. Labor expense is $2.4 million less than 2014 due to one less workday in January Material $ 6,702 $ 130 $ (43) $ 6,702 $ 130 $ (43) Material expense was $0.1 million favorable to budget for the month and flat to prior year. 3
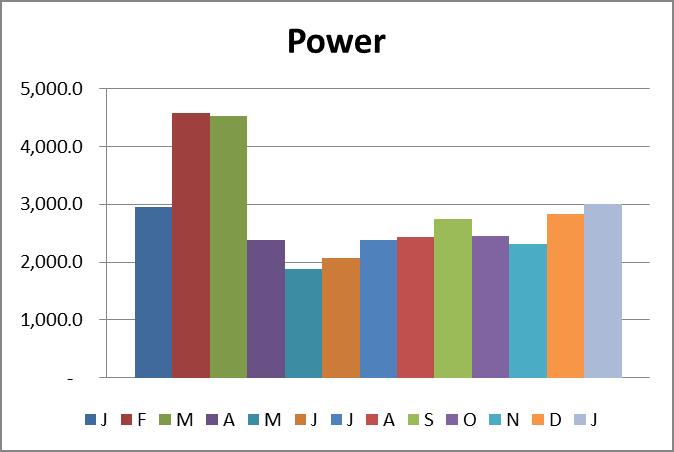
4 Fuel $ 4,526 $ 220 $ 781 $ 4,526 $ 220 $ 781 Fuel for Revenue Equipment expense was $0.2 million favorable to budget for the month. Fuel expense is $0.8 million favorable to prior year primarily due to lower prices. Power $ 3,013 $ 2 $ (54) $ 3,013 $ 2 $ (54) The Electric Power for Revenue Equipment expense was on par with budget. Purchase of Security Services $ 1,147 $ 56 $ (440) $ 1,147 $ 56 $ (440) Purchase of Security Services was slightly favorable to budget for the month. Security expense was $0.4 million unfavorable to prior year primarily due to a one-time 2014 reclassification of charges eligible for grant reimbursement. Other Expenses $ 23,988 $ (327) $ (1,340) $ 23,988 $ (327) $ (1,340) Other Expenses were $0.3 million unfavorable to budget for the month and $1.3 million higher than prior year. The increase over prior year is due to the timing of contractual expenses. Of the total monthly other expenses, the pension obligation bond expense is $10 million; the remaining expenses are for utilities, maintenance contracts, services, and other expenses. 4
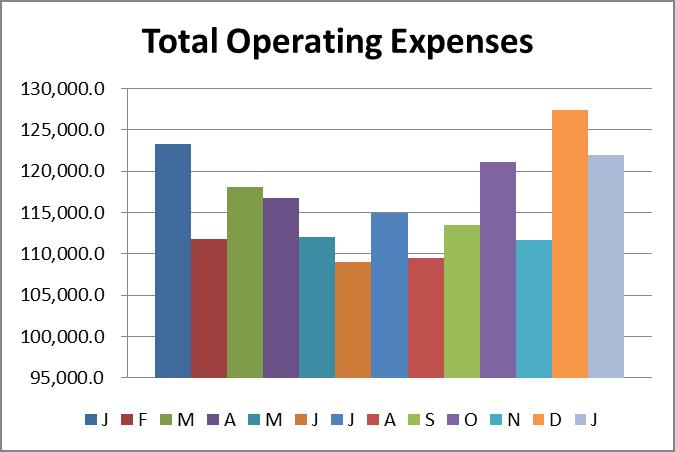
5 Total Operating Expenses $ 121,944 $ 1,115 $ 1,301 $ 121,944 $ 1,115 $ 1,301 Operating Expenses were less than budget for the month and prior year by $1.1 million and $1.3 million, respectively. The $1.1 million favorable variance to budget and $1.3 million favorable variance to prior year is due primarily to favorable labor expense with the remainder of expenses either slightly favorable or slightly unfavorable. V. Recovery Ratio Recovery Ratio 50.78% % 1.26 Recovery Ratio, which measures the percentage of operating expenses CTA funds from internally generated revenues, was 50.78% for the month. This was favorable to budget by 1.26 percentage points. VI. Ridership Bus 21, , Rail 14, , Rail to Rail Transfers 3, , Total 39, ,379 39, ,379 Ridership for the month of January was 39.4 million and was on par with budget and was 1.4 million more than prior year. Calendar adjusted ridership was up 5.2 % from prior year. January 2015 had 21 workdays compared with 22 in January More details on ridership can be found in the January Ridership Report. 5


6 Cash & Liquidity 6


7 Cash & Liquidity (con t) Revenue 7
 8")
8 Revenue (con t) 8
 9")
9 Revenue (con t) 9

10 Expenses 10
")
11 Expenses (con t) 11
")
12 Expenses (con t) 12
Cash & Liquidity The chart below highlights CTA s cash position at February 2015 compared to February 2014.
 To: Chicago Transit Authority Board From: Ron DeNard, Chief Financial Officer Re: Financial Results for February 2015 Date: April 15, 2015 I. Summary CTA s financial results are favorable for the month
CTA s financial results are unfavorable by $0.5 million and $1.2 million for the month and year.
 To: Chicago Transit Authority Board From: Ron DeNard, Chief Financial Officer Re: Financial Results for May 2015 Date: July 13, 2015 I. Summary CTA s financial results are unfavorable by $0.5 million and
Cash & Liquidity The chart below highlights CTA s cash position at November 2014 compared to November 2013.
 To: Chicago Transit Authority Board From: Ronald E. DeNard, Chief Financial Officer Re: Financial Results for November 2014 Date: January 12, 2015 I. Summary CTA s financial results are $1.9 million unfavorable
Cash & Liquidity The chart below highlights CTA s cash position at January 2016 compared to January 2015.
 To: Chicago Transit Authority Board From: Tom McKone, Acting Chief Financial Officer Re: Financial Results for January 2016 Date: March 9, 2016 I. Summary CTA s financial results are $0.8 million unfavorable
Cash & Liquidity The chart below highlights CTA s cash position at July 2015 compared to July 2014.
 To: Chicago Transit Authority Board From: Tom McKone, Acting CFO Re: Financial Results for July 2015 Date: September 4, 2015 I. Summary CTA s financial results are favorable by $1.9 million for the month
Cash & Liquidity The chart below highlights CTA s cash position at June 2014 compared to June 2013.
 To: Chicago Transit Authority Board From: Ron DeNard, Chief Financial Officer Re: Financial Results for June 2014 Date: August 13, 2014 I. Summary CTA s financial results are $4.0 million favorable for
Cash & Liquidity The chart below highlights CTA s cash position at May 2014 compared to May 2013.
 To: Chicago Transit Authority Board From: Ron DeNard, Chief Financial Officer Re: Financial Results for May 2014 Date: July 16, 2014 I. Summary CTA s financial results are $5.6 million favorable for May
Cash & Liquidity The chart below highlights CTA s cash position at March 2017 compared to March 2016.
 To: Chicago Transit Authority Board From: Jeremy Fine, Chief Financial Officer Re: Financial Results for March 2017 Date: May 10, 2017 I. Summary CTA s financial results are $0.6 million favorable to budget
Cash & Liquidity The chart below highlights CTA s cash position at December 2017 compared to December 2016.
 To: Chicago Transit Authority Board From: Jeremy Fine, Chief Financial Officer Re: Financial Results for December 2017 Date: February 14, 2018 I. Summary CTA s financial results are $4.7 million favorable
Cash & Liquidity The chart below highlights CTA s cash position at September 2017 compared to September 2016.
 To: Chicago Transit Authority Board From: Jeremy Fine, Chief Financial Officer Re: Financial Results for September 2017 Date: November 15, 2017 I. Summary CTA s financial results are $7.7 million favorable
Cash & Liquidity The chart below highlights CTA s cash position at February 2017 compared to February 2016.
 To: Chicago Transit Authority Board From: Jeremy Fine, Chief Financial Officer Re: Financial Results for February 2017 Date: April 5, 2017 I. Summary CTA s financial results are $0.3 million favorable
The year to date is less than budget and prior year by 15.4 million and 11.6 million, respectively.
 To: Chicago Transit Authority Board From: Jeremy Fine, Chief Financial Officer Re: Financial Results for September 2016 Date: November 16, 2016 I. Summary CTA s financial results are $0.3 million unfavorable
Cash & Liquidity The chart below highlights CTA s cash position at February 2016 compared to February 2015.
 To: Chicago Transit Authority Board From: Jeremy Fine, Chief Financial Officer Re: Financial Results for February 2016 Date: April 6, 2016 I. Summary CTA s financial results are $2.7 million favorable
Cash & Liquidity The chart below highlights CTA s cash position at July 2016 compared to July 2015.
 To: Chicago Transit Authority Board From: Jeremy Fine, Chief Financial Officer Re: Financial Results for July 2016 Date: September 14, 2016 I. Summary CTA s financial results are $0.4 million favorable
Cash & Liquidity The chart below highlights CTA s cash position at March 2018 compared to March 2017.
 To: Chicago Transit Authority Board From: Jeremy Fine, Chief Financial Officer Re: Financial Results for March 2018 Date: May 9, 2018 I. Summary CTA s financial results are $0.9 million favorable to budget
Cash & Liquidity The chart below highlights CTA s cash position at June 2018 compared to June 2017.
 To: Chicago Transit Authority Board From: Jeremy Fine, Chief Financial Officer Re: Financial Results for June 2018 Date: August 15, 2018 I. Summary CTA s financial results are unfavorable to budget for
Cash & Liquidity The chart below highlights CTA s cash position at January 2018 compared to January 2017.
 To: Chicago Transit Authority Board From: Jeremy Fine, Chief Financial Officer Re: Financial Results for January 2018 Date: March 14, 2018 I. Summary CTA s financial results are $1.7 million unfavorable
Cash & Liquidity The chart below highlights CTA s cash position at August 2018 compared to August 2017.
 To: Chicago Transit Authority Board From: Jeremy Fine, Chief Financial Officer Re: Financial Results for August 2018 Date: October 10, 2018 I. Summary CTA s financial results are favorable to budget for
3 RD QUARTER 2016 QUARTERLY FINANCIAL AND PERFORMANCE REPORT
 3 RD QUARTER 2016 QUARTERLY FINANCIAL AND PERFORMANCE REPORT November 2016 0 3 rd Quarter 2016 Financial and Performance Report Table of Contents Executive Summary... 1 Environmental Factors... 3 Ridership...
4 TH QUARTER 2017 QUARTERLY FINANCIAL AND PERFORMANCE REPORT
 4 TH QUARTER 2017 QUARTERLY FINANCIAL AND PERFORMANCE REPORT February 2018 0 4 th Quarter 2017 Financial and Performance Report Table of Contents Executive Summary... 2 Environmental Factors... 4 Ridership...
3 RD QUARTER 2017 QUARTERLY FINANCIAL AND PERFORMANCE REPORT
 3 RD QUARTER 2017 QUARTERLY FINANCIAL AND PERFORMANCE REPORT November 2017 0 3 rd Quarter 2017 Financial and Performance Report Table of Contents Executive Summary... 2 Environmental Factors... 4 Ridership...
2 ND QUARTER 2017 QUARTERLY FINANCIAL AND PERFORMANCE REPORT
 2 ND QUARTER 2017 QUARTERLY FINANCIAL AND PERFORMANCE REPORT August 2017 0 2 nd Quarter 2017 Financial and Performance Report Table of Contents Executive Summary... 2 Environmental Factors... 4 Ridership...
4TH QUARTER 2016 QUARTERLY FINANCIAL AND PERFORMANCE REPORT
 4TH QUARTER 2016 QUARTERLY FINANCIAL AND PERFORMANCE REPORT February 2017 0 Quarterly Financial and Performance Report 4th Quarter 2016 4th Quarter 2016 Financial and Performance Report Table of Contents
1 ST QUARTER 2017 QUARTERLY FINANCIAL AND PERFORMANCE REPORT
 1 ST QUARTER 2017 QUARTERLY FINANCIAL AND PERFORMANCE REPORT May 2017 0 1 st Quarter 2017 Financial and Performance Report Table of Contents Executive Summary... 2 Environmental Factors... 4 Ridership...
1ST QUARTER May 2018
 1ST QUARTER 2018 May 2018 0 1 st Quarter 2018 Financial and Performance Report Table of Contents Executive Summary... 2 Environmental Factors... 4 Ridership... 6 Peer Ridership Comparison... 7 Operating
CHICAGO TRANSIT AUTHORITY. FINANCIAL STATEMENTS AND SUPPLEMENTARY INFORMATION December 31, 2010 and 2009 (With Independent Auditors Report Thereon)
") FINANCIAL STATEMENTS AND SUPPLEMENTARY INFORMATION (With Independent Auditors Report Thereon) Chicago, Illinois FINANCIAL STATEMENTS CONTENTS Independent Auditors Report... 1 Management s Discussion and
FINANCIAL STATEMENTS AND SUPPLEMENTARY INFORMATION (With Independent Auditors Report Thereon) Chicago, Illinois FINANCIAL STATEMENTS CONTENTS Independent Auditors Report... 1 Management s Discussion and
Chicago Transit Authority Financial Statements for the Years Ended December 31, 1999 and 1998 and Supplementary Information and Independent Auditors'
 Chicago Transit Authority Financial Statements for the Years Ended December 31, 1999 and 1998 and Supplementary Information and Independent Auditors' Report TABLE OF CONTENTS Page INDEPENDENT AUDITORS'
Chicago Transit Authority Financial Statements for the Years Ended December 31, 2000 and 1999 and Supplementary Information and Independent Auditors'
 Chicago Transit Authority Financial Statements for the Years Ended December 31, 2000 and 1999 and Supplementary Information and Independent Auditors' Report TABLE OF CONTENTS Page INDEPENDENT AUDITORS'
3RD QUARTER November 2018
 3RD QUARTER 2018 November 2018 0 Quarterly Financial and Performance Report 3rd Quarter 2018 3rd Quarter 2018 Financial and Performance Report Table of Contents Executive Summary... 2 Environmental Factors...
CHICAGO TRANSIT AUTHORITY. FINANCIAL STATEMENTS AND SUPPLEMENTARY INFORMATION December 31, 2011 and 2010 (With Independent Auditors Report Thereon)
") FINANCIAL STATEMENTS AND SUPPLEMENTARY INFORMATION (With Independent Auditors Report Thereon) Chicago, Illinois FINANCIAL STATEMENTS CONTENTS Independent Auditors Report... 1 Management s Discussion and
FINANCIAL STATEMENTS AND SUPPLEMENTARY INFORMATION (With Independent Auditors Report Thereon) Chicago, Illinois FINANCIAL STATEMENTS CONTENTS Independent Auditors Report... 1 Management s Discussion and
Operating Budget Stability Q1 FY17 Financial Update
 Operating Budget Stability Q1 FY17 Financial Update Report to Fiscal and Management Control Board Without action, operating deficit was on track to reach $427M by FY20 STATUS QUO FY17 PRO FORMA 8.1.2015
Operating Budget. Second Quarter Financial Report
 Second Quarter Financial Report INDEX A. Executive Summary... A-1 B. Revenue and Expense Analysis... B-1 C. Budget Variance Reports... C-1 D. Ridership and Performance Measures... D-1 Board Budget Committee
METRO. Fiscal Year 2012 Monthly Board Report. September 2012 (Fourth Quarter Fiscal Year-to-Date)
") METRO Fiscal Year 2012 Monthly Board Report Revenue Expense Ridership Performance (Fourth Quarter Fiscal Year-to-Date) This report is based on a preliminary closing of the year-end financials for FY2012
METRO Fiscal Year 2012 Monthly Board Report Revenue Expense Ridership Performance (Fourth Quarter Fiscal Year-to-Date) This report is based on a preliminary closing of the year-end financials for FY2012
CHICAGO TRANSIT AUTHORITY PRESIDENT S FY2017 BUDGET RECOMMENDATIONS. Analysis and Recommendations
 CHICAGO TRANSIT AUTHORITY PRESIDENT S FY2017 BUDGET RECOMMENDATIONS Analysis and Recommendations November 14, 2016 TABLE OF CONTENTS EXECUTIVE SUMMARY... 1 CIVIC FEDERATION POSITION... 3 ISSUES THE CIVIC
October 2017 Monthly Financial Report
 GENERAL FUND OVERVIEW BTD Projection BTD Actuals BTD BTD % $ 450,269,075 $ 173,891,518 $ 181,528,672 $ 7,637,154 4.4% Expenditures $ 472,660,334 $ 180,624,776 $ 174,595,293 $ 6,029,483 3.3% Revenue Over
Operating Budget. Third Quarter Financial Report (July 2005 March 2006)
") Third Quarter Financial Report (July 2005 March 2006) INDEX A. Executive Summary...page 2 B. Revenue and Expense Analysis...page 3 C. Budget Variance Reports...page 14 D. Ridership and Performance Measures...page
Third Quarter Financial Report (July 2005 March 2006) INDEX A. Executive Summary...page 2 B. Revenue and Expense Analysis...page 3 C. Budget Variance Reports...page 14 D. Ridership and Performance Measures...page
Suburban Service and Regional ADA Budget Results January 2019
 and Regional Results January 2019 Department of Internal Services Issued March 2019 Performance At-A-Glance January 2019 (Millions) $25 $20 $17 $15 $10 $5 $0 ($5) Generated Public Expenses Net Results
Operating Budget Stability
 Operating Budget Stability March Financial Update Report to Agenda Executive Summary March Performance Against FY16 Budget March Performance Against Same Period Last Year Appendix Financial Detail: March
Budget Process Overview and Cost Allocation Methodology
 Budget Process Overview and Cost Allocation Methodology 1 Cost Allocation Agreement Guiding Principles Operate a consolidated regional public transportation system within and between the Participating
METRO. Fiscal Year 2012 Monthly Board Report. December 2011 (First Quarter Fiscal Year-to-Date)
") METRO Fiscal Year 2012 Monthly Board Report Revenue Expense Ridership Performance (First Quarter Fiscal Year-to-Date) 1/27/2012 Table of Contents Section A Section B Section C Section D Section E Section
METRO Fiscal Year 2012 Monthly Board Report Revenue Expense Ridership Performance (First Quarter Fiscal Year-to-Date) 1/27/2012 Table of Contents Section A Section B Section C Section D Section E Section
Section I Year-to-date revenues collected and projected revenues and expenditures for the current fiscal year
 Report to Secretary of Administration and Finance and House and Senate Committees on Ways and Means regarding Revenue Projections and Changes to Fare and Fee Structure of the Massachusetts Bay Transportation
($ in millions) Mid-Year
 Mid-Year") Table 1 Actual Variance Percent Actual Variance Percent Actual Variance Percent Revenue Farebox Revenue $379.0 $381.0 $2.0 0.5 $0.0 $0.0 $0.0 - $379.0 $381.0 $2.0 0.5 Vehicle Toll Revenue 122.6 125.2 2.5
Table 1 Actual Variance Percent Actual Variance Percent Actual Variance Percent Revenue Farebox Revenue $379.0 $381.0 $2.0 0.5 $0.0 $0.0 $0.0 - $379.0 $381.0 $2.0 0.5 Vehicle Toll Revenue 122.6 125.2 2.5
FY2018 Third Quarter Financial Update
 Finance and Committee Information Item IV-A May 10, 2018 Third Quarter Financial Update Page 30 of 53 Washington Metropolitan Area Transit Authority Board Action/Information Summary Action Information
The Board of Directors announces the unaudited results for the Third Quarter and 9 Months ended 30 September 2013.
 SBS TRANSIT LTD Company Registration No: 199206653M Third Quarter 2013 Financial Statements The Board of Directors announces the unaudited results for the Third Quarter and 9 Months ended 30 September
FY2014 Operating Budget Performance Report
 Finance & Administration Committee Information Item IV-C September 11, 2014 FY2014 Operating Budget Performance Report Washington Metropolitan Area Transit Authority Board Action/Information Summary Action
2019 Tax Budget Office of Management & Budget July 17, Greater Cleveland Regional Transit Authority
 Greater Cleveland Regional Transit Authority 2019 Tax Budget Office of Management & Budget July 17, 2018 Operating Budget Calendar o May o Jun o Jul Prepare 5 Yr. Financial Forecast Finalize 5 Yr Financial
METRO. Fiscal Year 2013 Monthly Board Report. December 2012 (First Quarter Fiscal Year-to-Date)
") METRO Fiscal Year 2013 Monthly Board Report Revenue Expense Ridership Performance (First Quarter Fiscal Year-to-Date) 1/14/2013 Table of Contents Section A Section B Section C Section D Section E Section
METRO Fiscal Year 2013 Monthly Board Report Revenue Expense Ridership Performance (First Quarter Fiscal Year-to-Date) 1/14/2013 Table of Contents Section A Section B Section C Section D Section E Section
CHATHAM AREA TRANSIT CHATHAM AREA TRANSIT AUTHORITY FINANCIAL REPORT
 CHATHAM AREA TRANSIT CHATHAM AREA TRANSIT AUTHORITY FINANCIAL REPORT Years Ended June 30, 2017 and 2016 CHATHAM AREA TRANSIT AUTHORITY TABLE OF CONTENTS Pages FINANCIAL SECTION: Independent Auditor s Report
IV. Major Assumptions Projections
 IV. Major Assumptions 2005-2008 Projections Debt Service Debt Service in the Financial Plan The following table reflects debt service projections for 2004 through 2008 associated with existing approved
Operating Budget Report
 Operating Budget Report MTD Operating Budget ($ in Millions) Sept-FY2012 Sept-FY2013 Variance FY13 Actual Actual Budget $ Percent $140M Operating Expenditures ($ in Millions) Revenue $ 67 $ 68 $ 71 $ (3)
CHICAGO TRANSIT AUTHORITY PRESIDENT S FY2018 BUDGET RECOMMENDATIONS. Analysis and Recommendations
 CHICAGO TRANSIT AUTHORITY PRESIDENT S FY2018 BUDGET RECOMMENDATIONS Analysis and Recommendations December 12, 2017 TABLE OF CONTENTS EXECUTIVE SUMMARY... 1 CIVIC FEDERATION POSITION... 5 CIVIC FEDERATION
CHICAGO TRANSIT AUTHORITY PRESIDENT S FY2019 BUDGET RECOMMENDATIONS. Analysis and Recommendations
 CHICAGO TRANSIT AUTHORITY PRESIDENT S FY2019 BUDGET RECOMMENDATIONS Analysis and Recommendations November 7, 2018 TABLE OF CONTENTS EXECUTIVE SUMMARY... 1 CIVIC FEDERATION POSITION... 4 ISSUES THE CIVIC
METRO MONTHLY BOARD REPORT
 METRO Revenue Expenses Service Performance Fiscal Year FY2011 Table of Contents Section A Section B Section C Section D Section E Section F Section G Section H Summary Sales Tax Revenue Fare Revenue Operating
Operating Budget Report
 Operating Budget Report MTD Operating Budget ($ in Millions) Oct-FY2012 Oct-FY2013 Variance FY13 Actual Actual Budget $ Percent $140M Operating Expenditures ($ in Millions) Revenue $ 67 $ 70 $ 79 $ (8)
REGIONAL TRANSPORTATION DISTRICT, COLORADO AS OF DECEMBER 31, 2015
 AS OF DECEMBER 31, RTD Active Fleet of the District Fixed Route Bus Fleet: Number RTD Owned- Fixed Route Buses 40' Transit Coaches 620 Articulated Buses 110 Intercity Coaches 175 Mall Shuttles 37 30' Transit
Financial Management Report... 3
 November 13, 2013 Table of Contents Financial Management Report... 3 OPERATING FUNDS STATEMENT OF REVENUES & EXPENSES... 3 METROPOLITAN COUNCIL INVESTMENT PERFORMANCE SHORT-TERM PORTFOLIO... 4 METROPOLITAN
Proposed Budget Fiscal Year 2010 July 1, 2009 June 30, 2010
 Proposed Budget Fiscal Year 2010 July 1, 2009 June 30, 2010 Presented to the Board of Directors: Finance, Administration, and Oversight Committee January 8, 2009 1 General Manager s Overview And Summary
CHICAGO TRANSIT AUTHORITY CHICAGO, ILLINOIS
 CHICAGO, ILLINOIS FINANCIAL STATEMENTS AND SUPPLEMENTARY INFORMATION Years Ended (With Independent Auditor s Report Thereon) Chicago, Illinois FINANCIAL STATEMENTS Years Ended TABLE OF CONTENTS Independent
Washington Metropolitan Area Transit Authority Metro Budget Overview
 Washington Metropolitan Area Transit Authority Metro Budget Overview February 2011 Metro 10,877 Employees (10,974 budgeted) 1,491 Buses 588 Escalators and 237 Elevators 106 Miles of Track 92 Traction Power
FY2018 Second Quarter Financial Update
 Finance and Committee Information Item III-A February 8, 2018 Second Quarter Financial Update 4 of 52 Washington Metropolitan Area Transit Authority Board Action/Information Summary Action Information
General Manager Remarks FMCB 10/6/2016
 General Manager Remarks FMCB 10/6/2016 Christopher T. Flynn 2 Education and performance awards MBA from the University of Massachusetts Bachelors of Arts in Economics from Merrimack College ACEC QBS AWARD
Adopted 2018 OPERATING BUDGET Two-Year Financial Plan and Five-Year CAPITAL PROGRAM
 2018 Adopted 2018 OPERATING BUDGET Two-Year Financial Plan and Five-Year CAPITAL PROGRAM MOVING YOU Northeastern Illinois December 2017 RTA Board of Directors Kirk Dillard Chairman Anthony K. Anderson
III. Major Assumptions Projections
 III. Major Assumptions 2004-2008 Projections Utilization (Revenue, Ridership, Vehicle Traffic) UTILIZATION Baseline Before Gap-Closing Actions 2004 Ridership and Revenue In 2004, ridership on the various
SOUTHEASTERN PENNSYLVANIA TRANSPORTATION AUTHORITY. Financial Statements June 30, 2018 and (With Independent Auditors Report Thereon)
") SOUTHEASTERN PENNSYLVANIA TRANSPORTATION AUTHORITY Financial Statements June 30, 2018 and 2017 (With Independent Auditors Report Thereon) SOUTHEASTERN PENNSYLVANIA TRANSPORTATION AUTHORITY YEARS ENDED
SOUTHEASTERN PENNSYLVANIA TRANSPORTATION AUTHORITY Financial Statements June 30, 2018 and 2017 (With Independent Auditors Report Thereon) SOUTHEASTERN PENNSYLVANIA TRANSPORTATION AUTHORITY YEARS ENDED
ADOPTED 2017 OPERATING BUDGET AND CAPITAL PROGRAM
 2017 Budget December 2016 ADOPTED 2017 OPERATING BUDGET AND CAPITAL PROGRAM Summary Briefing of the Adopted Operating Budgets, Two-Year Financial Plans, and Five-Year Capital Programs of the RTA, CTA,
Financial Report to the Board of Trustees
 Financial Report to the Board of Trustees February 18, 2010 FY09 Closeout and FY10 Six Month Update University of Connecticut Health Center FY09 Closeout 2 University of Connecticut Health Center FY 2009
FORT WORTH TRANSPORTATION AUTHORITY
 FINANCIAL REPORT SEPTEMBER 30, 2010 C O N T E N T S INDEPENDENT AUDITOR'S REPORT... 1 MANAGEMENT'S DISCUSSION AND ANALYSIS... 3 Page BASIC FINANCIAL STATEMENTS Statements of Net Assets... 8 Statements
Agenda. Pre-Trip Approval Booking Travel Methods of Payments. During Travel Travel Status Allowable Expenses Unallowable Expenses
 Travel Training Training Takeaways: Policies, rules, regulations, and procedures related to traveling on WSU business; Full travel process from approval to reimbursement; and Answers to frequently asked
BUDGETWATCH April 2015 Flash Report
 BUDGETWATCH April 2015 Flash Report Summary of March Budgetwatch (reporting on operations through February and subsidies through March): Overall, results through March were favorable mainly as a result
Audit Presentation. May 25, Donna M. Gonser, CPA Christa L. Kopacz, CPA
 Audit Presentation May 25, 2012 Donna M. Gonser, CPA Christa L. Kopacz, CPA 403 Main St., Suite 430 Buffalo, NY 14203 716-856-3300 www.lumsdencpa.com 0 Engagement Scope Audit Scope and Reports Financial
COMMUTER RAIL DIVISION OF THE REGIONAL TRANSPORTATION AUTHORITY AND THE NORTHEAST ILLINOIS REGIONAL COMMUTER RAILROAD CORPORATION
 Financial Statements and Supplementary Information (With Independent Auditors Report Thereon) Table of Contents Page(s) Independent Auditors Report 1 2 Management s Discussion and Analysis (Unaudited)
DEC FYTD RESULTS
 DEC. 2018 FYTD RESULTS DEC 2018 FYTD ACTUALS VARIANCE BUDGET FYTD VARIANCE 2018/2019 Prior FY 17/18 From Prior FY 2018/2019 From Budget PROGRAMS REVENUE $ 244,328 $ 206,156 $ 38,171 19% $ 230,584 $ 13,744
Quarterly Budget Report
 City of Chicago Quarterly Report 2 nd Quarter Mayor Rahm Emanuel Quarterly Report-2 nd Quarter Content and Purpose This quarterly report presents an overview of the City s operating revenues and expenditures
REGIONAL TRANSPORTATION DISTRICT, COLORADO
 REGIONAL TRANSPORTATION DISTRICT, COLORADO Series 2004 Lease RTD Active Fleet of the District Fiscal Year Ended December 31, 2013 Fixed Route Bus Fleet Number RTD Owned Fixed Route Buses 40' Transit Coaches
OPERATING BUDGET REPORT
 OPERATING BUDGET REPORT OPERATING BUDGET ($ in Millions) MTD Nov-FY2012 Nov-FY2013 Actual Actual Budget $ Percent Revenue $ 63.0 $ 65.7 $ 68.3 $ (2.7) -3.9% Expense $ 107.6 $ 124.8 $ 129.8 $ 5.0 3.8% Subsidy
METRO. Fiscal Year 2013 Monthly Board Report. November 2012
 METRO Fiscal Year 2013 Monthly Board Report Revenue Expense Ridership Performance 12/13/2012 Table of Contents Section A Section B Section C Section D Section E Section F Section G Section H Section I
METRO. Fiscal Year 2015 Monthly Board Report. February 2015
 METRO Fiscal Year 2015 Monthly Board Report Revenue Expense Ridership Performance 4/2/2015 Table of Contents Section A Section B Section C Section D Section E Section F Section G Section H Section I Section
PRE TRIP. Travel Training. Agenda 12/22/2017 WASHINGTON STATE UNIVERSITY
 Travel Training Training Takeaways: Policies, rules, regulations, and procedures related to traveling on WSU business; Full travel process from approval to reimbursement; and Answers to frequently asked
2017 YEAR-END FINANCIAL REPORT
 217 YEAR-END FINANCIAL REPORT The 217 Fiscal Year was another successful year for the Authority. The GCRTA received a Gold Level Award for Achievement in Excellence from The Partnership for Excellence,
IV. Major Assumptions Projections
 IV. Major Assumptions 2004-2008 Projections This page has been intentionally left blank. Utilization (Revenue, Ridership, Vehicle Traffic) This page has been intentionally left blank. UTILIZATION Baseline
New York City Transit
 New York City Transit MTA New York City Transit 2008 Preliminary Budget July Financial Plan 2008 2011 MISSION STATEMENT The mission of MTA New York City Transit is to provide customers with safe, reliable
1. approve the 2001 TTC Operating Budget (summarized in Appendix A) as described in this report and the following accompanying reports:
 as described in this report and the following accompanying reports:") MEETING DATE: February 16, 2001 SUBJECT: 2001 TTC Operating Budget RECOMMENDATION It is recommended that the Commission: 1. approve the 2001 TTC Operating Budget (summarized in Appendix A) as described
MEETING DATE: February 16, 2001 SUBJECT: 2001 TTC Operating Budget RECOMMENDATION It is recommended that the Commission: 1. approve the 2001 TTC Operating Budget (summarized in Appendix A) as described
June 2018 Monthly Financial Report
 GENERAL FUND OVERVIEW 2018 Budget YTD Projection YTD Actuals YTD YTD % $ 231,221,914 $ 122,469,971 $ 127,173,074 $ 4,703,104 3.8% Expenditures $ 253,846,860 $ 123,830,932 $ 111,880,437 $ 11,950,495 9.7%
FY2017 Year-End Financial Update
 Finance Committee Information Item III-A September 14, 2017 FY2017 Year-End Financial Update Washington Metropolitan Area Transit Authority Board Action/Information Summary Action Information MEAD Number:
Financial Report - FY 2017 Year to Date May 31, 2017
 Financial Report - FY 2017 Year to Date July 19, 2017 1 Major Highlights Revenue Sales tax remittances received through YTD April 2017 are 4.2% higher than YTD April 2016 Plaza Saltillo lease income budgeted
SOUTHEASTERN PENNSYLVANIA TRANSPORTATION AUTHORITY. Financial Statements June 30, 2017 and (With Independent Auditors Report Thereon)
") SOUTHEASTERN PENNSYLVANIA TRANSPORTATION AUTHORITY Financial Statements June 30, 2017 and 2016 (With Independent Auditors Report Thereon) SOUTHEASTERN PENNSYLVANIA TRANSPORTATION AUTHORITY YEARS ENDED
SOUTHEASTERN PENNSYLVANIA TRANSPORTATION AUTHORITY Financial Statements June 30, 2017 and 2016 (With Independent Auditors Report Thereon) SOUTHEASTERN PENNSYLVANIA TRANSPORTATION AUTHORITY YEARS ENDED
BUDGETWATCH October 2018 Flash Report
 October 2018 Flash Report Overall Latest Condition (reporting on operations through September and subsidies through October): Passenger Revenues were slightly below the Forecast in September, marginally
February 2016 Financial Report
 2016 February 2016 Financial Report Capital Metropolitan Transportation Authority 4/13/2016 Table of Contents SUMMARY REPORT Budgetary Performance - Revenue 2 - Sales Tax Revenue 5 - Operating Expenses
Charter High School for Architecture & Design
 Financial Operations Report September 30, 2017 1 S ant ii &~2~:~~ euslneu or Education Balance Sheet September 2017 ASSETS Current Assets Checking/Savings Cash Due from Other School Districts Due from
BUDGETWATCH March 2016 Flash Report
 March 2016 Flash Report Summary of February Budgetwatch (reporting on operations through January and subsidies through February): Overall results through February were slightly favorable. Net operating
Massachusetts Transportation Trust Fund
 Massachusetts Department of Transportation Report ID: BUD-001B-MTTF Statement of Revenue and Expenses - Actual vs. Budget Run Date: 4/11/2013 For the Fiscal Year 2013 Through Period Ending March 31, 2013
CTA 2007 Contingency Plan
 CTA 2007 Contingency Plan JUST THE FACTS RTA Directive Unless the RTA Board makes a determination no later than July 1, 2007, that the funds identified as new transit funding are available for 2007 such
REGIONAL TRANSPORTATION AUTHORITY AND SERVICE BOARDS
 REGIONAL TRANSPORTATION AUTHORITY AND SERVICE BOARDS Special -Purpose Combining Financial Statements 2017 Report REGIONAL TRANSPORTATION AUTHORITY AND SERVICE BOARDS SPECIAL-PURPOSE COMBINING FINANCIAL
ACADEMIC SENATE
 ACADEMIC SENATE http://www.csueastbay.edu/senate 510-885-3671 COMMITTEE ON BUDGET AND RESOURCE ALLOCATION 15-16 COBRA 3 March 10, 2016 TO: FROM: SUBJECT: PURPOSE: The Academic Senate The Committee on Budget
Operating Budget Report
 Operating Report Operating ($ in Millions) Operating Expenditures ($ in Millions) Jun-11 Jun-12 $ Percent Revenue $ 212,640 $ 217,643 $ 214,671 $ 2,973 1% Expense $ 359,102 $ 361,882 $ 366,332 $ 4,450
August 31, 2016 Financial Report
 August 31, 2016 Financial Report Capital Metropolitan Transportation Authority 10/14/2016 Table of Contents SUMMARY REPORTS Budgetary Performance - Revenue 2 - Sales Tax Revenue 6 - Operating Expenses
MONTHLY FINANCIAL STATUS MAY 2018
 (Millions) MONTHLY FINANCIAL STATUS To: Dave Genova, General Manager and CEO ACTION DISCUSSION INFO From: Heather McKillop, CFO and AGM Administration x Date: July 10, VS. BUDGET YTD VS. BUDGET MAY VS.
Budget Performance in Millions of Dollars Favorable/Unfavorable to Budget. Suburban Suburban
 v System Status Budget Performance in Millions of Dollars Favorable/Unfavorable to Budget 6 4 2 0-2 -4-6 -8 Suburban Suburban Suburban ADA Suburban ADA ADA ADA Revenue Expenses Funding Required Net Funding
MONTHLY FINANCIAL STATUS APRIL 2018
 (Millions) MONTHLY FINANCIAL STATUS To: Dave Genova, General Manager and CEO ACTION DISCUSSION INFO From: Heather McKillop, CFO and AGM Administration x Date: June 19, VS. BUDGET YTD VS. BUDGET APRIL VS.
2004 Operating and Capital Program Financial Plan for Operations, and Capital Plan
 PAST AND FUTURE RESPONSIBLE PUBLIC SERVICE 2004 Operating and Capital Program 2004 2006 2006 Financial Plan for Operations, and 2004 2008 2008 Capital Plan A Fresh Approach To Public Transportation Final