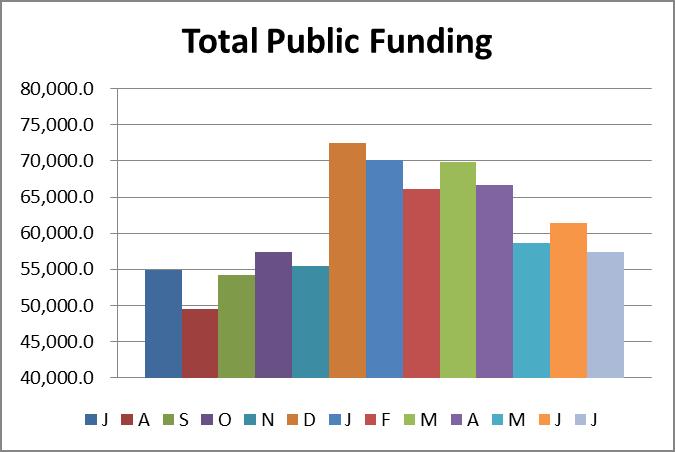
Cash & Liquidity The chart below highlights CTA s cash position at July 2015 compared to July 2014.
|
|
|
- Della Tucker
- 6 years ago
- Views:
Transcription

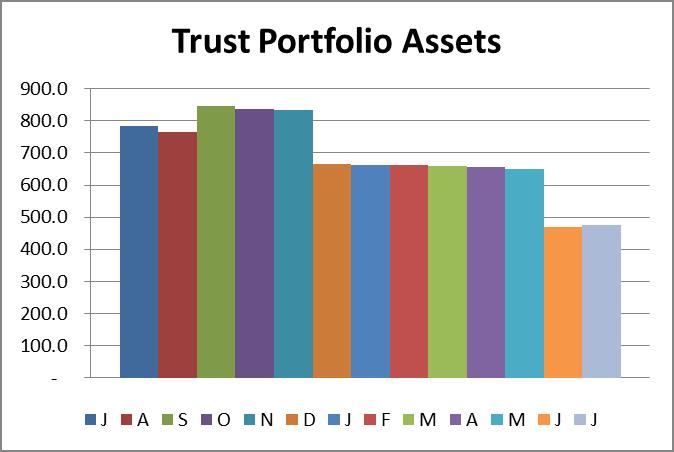
1 To: Chicago Transit Authority Board From: Tom McKone, Acting CFO Re: Financial Results for July 2015 Date: September 4, 2015 I. Summary CTA s financial results are favorable by $1.9 million for the month due to a combination of lower operating expenses and higher fare and pass revenue. The year to date is unfavorable by $0.9 million primarily due to the anticipated reduction in the State s free and reduced fare reimbursement. Ridership was 44.8 million for the month and was 0.3 million more than budget. Ridership for the year to date was million and was 3.8 million less than budget. II. Cash & Liquidity The chart below highlights CTA s cash position at July 2015 compared to July JULY JULY Increase (Decrease) Unrestricted Cash $ $ 98.2 $ 58.0 Damage Reserve $ (4.5) Funds Owed by RTA $ 2.1 Trust Portfolio Assets $ (308.6) Total Cash and Receivables $ 1,019.7 $ 1,272.7 $ (253.0) CTA s total cash/receivables balance is equal to $1.0 billion. Unrestricted cash was $58.0 million more than the prior year due to increased focus on reducing the delay in the receipt of reimbursements for capital related payments, recent insurance settlements and timing of expenditures. The Damage Reserve is sufficiently funded and was $4.5 million lower than last year reflecting payouts for settled claims. Funds owed by the RTA were approximately $284.0 million which was $2.1 million more than the prior year primarily due to a 5 month timing gap in State PTF (Public Transportation Funding). CTA continues to work closely with the RTA to monitor their receivable balance owed. Trust Portfolio Assets represents bond proceeds held in Trust for funding capital projects and making required debt service payments. 1
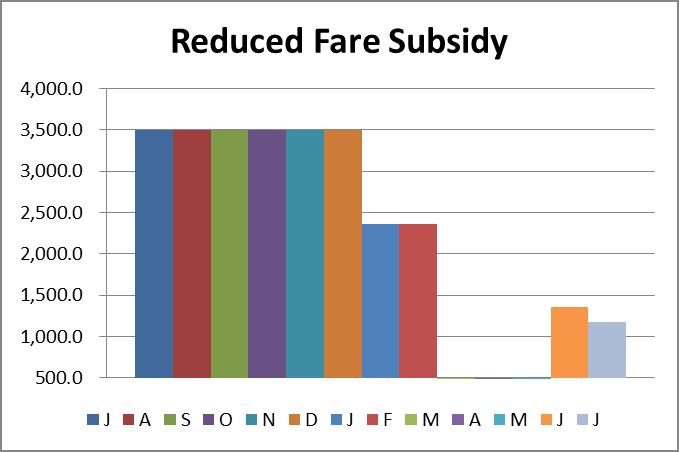
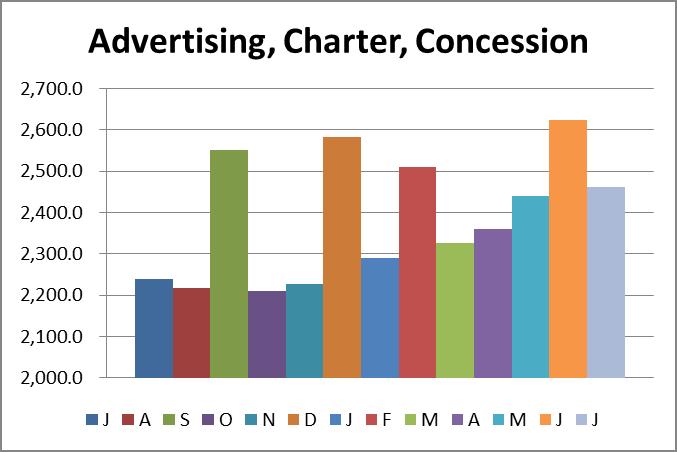
2 III. Revenue Fare & Pass Revenue $ 54,539 $ 1,359 $ 2,999 $ 338,674 $ (1,502) $ 1,165 Fare and pass revenue for July was favorable to budget by $1.4 million and higher than the prior year by $3.0 million. The average fare for the month was $1.22 and was $0.02 more than budget. Year-over-year fare and pass revenue increased by 5.8% in July and is 2.6% higher than budget for the month. Year to date fare and pass revenue was $1.5 million less than budget but was $1.2 million more than prior year. The average fare for the year to date was $1.13 per ride and is $0.01 more than budget. The year to date revenue was negatively impacted by the coldest February ever in Chicago and was the third-snowiest February on record. A strong July has helped bring the year to date total closer to the budgeted level. Reduced Fare Subsidy $ 1,180 $ (1,180) $ (2,323) $ 7,260 $ (9,261) $ (3,546) Reduced Fare Subsidy is $1.2 million less than budget for the month and $9.3 million less for the year to date due to the anticipated reduction in State funding for the free and reduced fare mandates. According to the July 2014 June 2015 State budget and the proposed (but not yet approved) July 2015 June 2016 State budget, we expect to receive approximately half of the originally budgeted amount. Advertising, Charter, Concession $ 2,461 $ 66 $ 223 $ 17,013 $ 99 $ 1,244 Advertising, Charter and Concessions Revenue is slightly favorable to budget for the month due to slightly higher billboard revenue than anticipated. The increase over the prior year is due to higher special contract guarantees, concession contracts, and the annual increase in vehicle and platform advertising minimum guarantee. 2
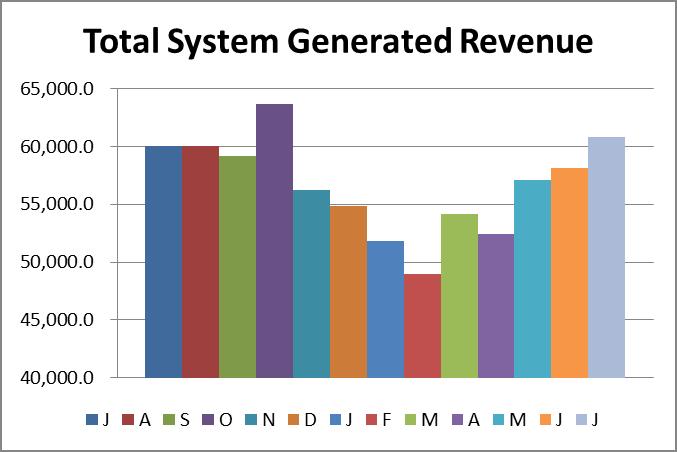
3 Investment income $ 98 $ 41 $ 42 $ 917 $ 519 $ 610 Investment income was higher than budget for the month and prior year. Improved cash forecasting and a better investment strategy through security selection has increased overall yield on the investment portfolio, which is expected to continue for the remainder of FY Other Revenue $ 2,526 $ (562) $ (152) $ 19,620 $ 1,750 $ (2,600) Other Revenue was unfavorable to budget by $0.6 million for the month due to timing of non-capital grant revenue. This revenue is offset by an equal amount in the Other Expense category. For the year to date Other Revenue is $1.8 million more than budget due to additional non-capital grant, rental and parking lot revenue. The year to date is lower than prior year due to a one-time sale of property in Total System Generated Revenue $ 60,803 $ (276) $ 788 $ 383,484 $ (8,395) $ (3,127) Total System-Generated Revenue was $0.3 million and $8.4 million less than budget for the month and year primarily due to the anticipated reduction in the State s free and reduced fare subsidy. The year to date system-generated revenue is $3.1 million less than prior year primarily due to this reduction and additional one-time revenues in 2014, including the sale of property and higher non-capital grant revenues. 3
4 IV. Expenses Labor $ 84,539 $ 1,275 $ (3,014) $ 572,684 $ 9,949 $ (13,791) Labor expense was $1.3 million favorable to budget for the month, mainly due to proactive management of vacant positions and favorable fringe expenses. Labor expense is $13.8 million unfavorable to 2014 due to contractual wage rate increases, increased investments in safety oversight and facilities maintenance, and an increase in rail service in Material $ 7,488 $ (1,635) $ (1,394) $ 48,718 $ (6,652) $ (6,616) Material expense was unfavorable to budget for the month by $1.6 million. The unfavorable variance for the month is partially due to a provision for inventory obsolescence. In addition, the variance is due to more rail car mileage than budgeted creating more wear on materials and leading to more frequent replacements; delayed vehicle overhauls due to a delay in state funding; and a slower retirement of older vehicles, which have a higher materials cost per mile, expected to be replaced by new ones. The unfavorable variance to budget for the year is also due to the severe weather in February. The unfavorable variance to prior year is attributed to a reclassification of certain expenses from the Other Expenses category into the Materials category. Fuel $ 4,284 $ 633 $ 423 $ 29,791 $ 2,557 $ 3,216 Fuel for Revenue Equipment expense was $0.6 million favorable to budget for the month due to lower usage than budgeted. Fuel is conservatively budgeted in 2015 to account for additional shuttles or other service that occurs throughout the year as a result of capital projects or other impacts. Fuel expense is $3.2 million favorable to prior year to date due to lower usage and price. Power $ 2,319 $ 195 $ 67 $ 17,176 $ 807 $ 3,609 4
5 The Electric Power for Revenue Equipment expense is slightly favorable to budget for the month and expected to remain within budget for the year with occasional monthly fluctuations. Volume is slightly lowered than budgeted due to the mild July weather. Year to date power expense is $3.6 million lower than 2014 due to the impact of the polar vortex in 2014, which required a higher volume of power consumption, and higher prices in Purchase of Security Services $ 1,200 $ 2 $ 24 $ 8,330 $ 85 $ (811) Purchase of Security Services was on par with budget for the month and slightly favorable for the year to date. Security expense was $0.8 million higher than 2014 primarily due to a one-time 2014 reclassification of charges eligible for grant reimbursement. Other Expenses $ 18,383 $ 1,693 $ 581 $ 156,933 $ 740 $ (13,321) Other Expenses were $1.7 million favorable to budget for the month primarily due to lower non-capital grant expense than anticipated. These expenses are offset by non-capital grant revenue for a neutral overall impact on the budget. Overall contractual and other expenses are trending as anticipated with timing of the expenses creating monthly variability. Year to date other expenses were within 0.5% of the 2015 budget and $13.3 million higher than 2014 due to the timing of contractual expenses and one-time credits received in Of the total monthly other expenses, the pension obligation bond expense is $10 million; the remaining expenses are for utilities, maintenance contracts, services, and other expenses. Total Operating Expenses $ 118,214 $ 2,163 $ (3,312) $ 833,632 $ 7,487 $ (27,715) Operating Expenses were $2.2 million less than budget for the month and $3.3 million more than prior year. The favorable year to date variance to budget is due primarily to favorable labor, fuel and power expenses which offset unfavorable material expense. 5
6 V. Recovery Ratio Recovery Ratio 61.81% % (0.74) Recovery Ratio, which measures the percentage of operating expenses CTA funds from internally generated revenues, was 61.81% for the month. This was favorable to budget by 1.00 percentage point and is due to a combination of favorable variances on operating expense and fare and pass revenue. For the year to date the recovery ratio was 55.17% and slightly unfavorable to budget. VI. Ridership Bus 22,901 (169) ,137 (2,542) (262) Rail 17, ,376 (891) 1,319 Rail to Rail Transfers 3, ,236 (391) 286 Total 44, , ,749 (3,824) 1,343 Ridership for the month of July was 44.8 million and was more than budget and prior year by 0.3 million and 1.4 million, respectively. Calendar adjusted ridership was up 3.4% from prior year. Ridership for the year to date was million and was 3.8 million less than budget but was 1.3 million more than the prior year to date. Calendar adjusted ridership was up 0.5% from the prior year to date. More details on ridership can be found in the July Ridership Report. 6

7 Cash & Liquidity 7


8 Cash & Liquidity (con t) Revenue 8
 9")
9 Revenue (con t) 9
")
10 Revenue (con t) 10

11 Expenses 11
")
12 Expenses (con t) 12
")
13 Expenses (con t) 13
CTA s financial results are unfavorable by $0.5 million and $1.2 million for the month and year.
 To: Chicago Transit Authority Board From: Ron DeNard, Chief Financial Officer Re: Financial Results for May 2015 Date: July 13, 2015 I. Summary CTA s financial results are unfavorable by $0.5 million and
Cash & Liquidity The chart below highlights CTA s cash position at February 2015 compared to February 2014.
 To: Chicago Transit Authority Board From: Ron DeNard, Chief Financial Officer Re: Financial Results for February 2015 Date: April 15, 2015 I. Summary CTA s financial results are favorable for the month
Cash & Liquidity The chart below highlights CTA s cash position at January 2016 compared to January 2015.
 To: Chicago Transit Authority Board From: Tom McKone, Acting Chief Financial Officer Re: Financial Results for January 2016 Date: March 9, 2016 I. Summary CTA s financial results are $0.8 million unfavorable
Ridership for the month is 39.4 million and is on par with budget. Ridership is 1.4 million or 3.6% higher than January 2014.
 To: Chicago Transit Authority Board From: Ron DeNard, Chief Financial Officer Re: Financial Results for January 2015 Date: March 6, 2015 I. Summary CTA s financial results are $2.0 million favorable for
Cash & Liquidity The chart below highlights CTA s cash position at February 2016 compared to February 2015.
 To: Chicago Transit Authority Board From: Jeremy Fine, Chief Financial Officer Re: Financial Results for February 2016 Date: April 6, 2016 I. Summary CTA s financial results are $2.7 million favorable
Cash & Liquidity The chart below highlights CTA s cash position at June 2014 compared to June 2013.
 To: Chicago Transit Authority Board From: Ron DeNard, Chief Financial Officer Re: Financial Results for June 2014 Date: August 13, 2014 I. Summary CTA s financial results are $4.0 million favorable for
Cash & Liquidity The chart below highlights CTA s cash position at November 2014 compared to November 2013.
 To: Chicago Transit Authority Board From: Ronald E. DeNard, Chief Financial Officer Re: Financial Results for November 2014 Date: January 12, 2015 I. Summary CTA s financial results are $1.9 million unfavorable
Cash & Liquidity The chart below highlights CTA s cash position at March 2017 compared to March 2016.
 To: Chicago Transit Authority Board From: Jeremy Fine, Chief Financial Officer Re: Financial Results for March 2017 Date: May 10, 2017 I. Summary CTA s financial results are $0.6 million favorable to budget
Cash & Liquidity The chart below highlights CTA s cash position at February 2017 compared to February 2016.
 To: Chicago Transit Authority Board From: Jeremy Fine, Chief Financial Officer Re: Financial Results for February 2017 Date: April 5, 2017 I. Summary CTA s financial results are $0.3 million favorable
Cash & Liquidity The chart below highlights CTA s cash position at May 2014 compared to May 2013.
 To: Chicago Transit Authority Board From: Ron DeNard, Chief Financial Officer Re: Financial Results for May 2014 Date: July 16, 2014 I. Summary CTA s financial results are $5.6 million favorable for May
Cash & Liquidity The chart below highlights CTA s cash position at September 2017 compared to September 2016.
 To: Chicago Transit Authority Board From: Jeremy Fine, Chief Financial Officer Re: Financial Results for September 2017 Date: November 15, 2017 I. Summary CTA s financial results are $7.7 million favorable
Cash & Liquidity The chart below highlights CTA s cash position at December 2017 compared to December 2016.
 To: Chicago Transit Authority Board From: Jeremy Fine, Chief Financial Officer Re: Financial Results for December 2017 Date: February 14, 2018 I. Summary CTA s financial results are $4.7 million favorable
Cash & Liquidity The chart below highlights CTA s cash position at January 2018 compared to January 2017.
 To: Chicago Transit Authority Board From: Jeremy Fine, Chief Financial Officer Re: Financial Results for January 2018 Date: March 14, 2018 I. Summary CTA s financial results are $1.7 million unfavorable
Cash & Liquidity The chart below highlights CTA s cash position at August 2018 compared to August 2017.
 To: Chicago Transit Authority Board From: Jeremy Fine, Chief Financial Officer Re: Financial Results for August 2018 Date: October 10, 2018 I. Summary CTA s financial results are favorable to budget for
The year to date is less than budget and prior year by 15.4 million and 11.6 million, respectively.
 To: Chicago Transit Authority Board From: Jeremy Fine, Chief Financial Officer Re: Financial Results for September 2016 Date: November 16, 2016 I. Summary CTA s financial results are $0.3 million unfavorable
Cash & Liquidity The chart below highlights CTA s cash position at July 2016 compared to July 2015.
 To: Chicago Transit Authority Board From: Jeremy Fine, Chief Financial Officer Re: Financial Results for July 2016 Date: September 14, 2016 I. Summary CTA s financial results are $0.4 million favorable
Cash & Liquidity The chart below highlights CTA s cash position at March 2018 compared to March 2017.
 To: Chicago Transit Authority Board From: Jeremy Fine, Chief Financial Officer Re: Financial Results for March 2018 Date: May 9, 2018 I. Summary CTA s financial results are $0.9 million favorable to budget
Cash & Liquidity The chart below highlights CTA s cash position at June 2018 compared to June 2017.
 To: Chicago Transit Authority Board From: Jeremy Fine, Chief Financial Officer Re: Financial Results for June 2018 Date: August 15, 2018 I. Summary CTA s financial results are unfavorable to budget for
CHICAGO TRANSIT AUTHORITY. FINANCIAL STATEMENTS AND SUPPLEMENTARY INFORMATION December 31, 2010 and 2009 (With Independent Auditors Report Thereon)
") FINANCIAL STATEMENTS AND SUPPLEMENTARY INFORMATION (With Independent Auditors Report Thereon) Chicago, Illinois FINANCIAL STATEMENTS CONTENTS Independent Auditors Report... 1 Management s Discussion and
FINANCIAL STATEMENTS AND SUPPLEMENTARY INFORMATION (With Independent Auditors Report Thereon) Chicago, Illinois FINANCIAL STATEMENTS CONTENTS Independent Auditors Report... 1 Management s Discussion and
Suburban Service and Regional ADA Budget Results January 2019
 and Regional Results January 2019 Department of Internal Services Issued March 2019 Performance At-A-Glance January 2019 (Millions) $25 $20 $17 $15 $10 $5 $0 ($5) Generated Public Expenses Net Results
Chicago Transit Authority Financial Statements for the Years Ended December 31, 1999 and 1998 and Supplementary Information and Independent Auditors'
 Chicago Transit Authority Financial Statements for the Years Ended December 31, 1999 and 1998 and Supplementary Information and Independent Auditors' Report TABLE OF CONTENTS Page INDEPENDENT AUDITORS'
METRO. Fiscal Year 2012 Monthly Board Report. September 2012 (Fourth Quarter Fiscal Year-to-Date)
") METRO Fiscal Year 2012 Monthly Board Report Revenue Expense Ridership Performance (Fourth Quarter Fiscal Year-to-Date) This report is based on a preliminary closing of the year-end financials for FY2012
METRO Fiscal Year 2012 Monthly Board Report Revenue Expense Ridership Performance (Fourth Quarter Fiscal Year-to-Date) This report is based on a preliminary closing of the year-end financials for FY2012
Operating Budget Stability
 Operating Budget Stability March Financial Update Report to Agenda Executive Summary March Performance Against FY16 Budget March Performance Against Same Period Last Year Appendix Financial Detail: March
CHICAGO TRANSIT AUTHORITY. FINANCIAL STATEMENTS AND SUPPLEMENTARY INFORMATION December 31, 2011 and 2010 (With Independent Auditors Report Thereon)
") FINANCIAL STATEMENTS AND SUPPLEMENTARY INFORMATION (With Independent Auditors Report Thereon) Chicago, Illinois FINANCIAL STATEMENTS CONTENTS Independent Auditors Report... 1 Management s Discussion and
FINANCIAL STATEMENTS AND SUPPLEMENTARY INFORMATION (With Independent Auditors Report Thereon) Chicago, Illinois FINANCIAL STATEMENTS CONTENTS Independent Auditors Report... 1 Management s Discussion and
FY2018 Third Quarter Financial Update
 Finance and Committee Information Item IV-A May 10, 2018 Third Quarter Financial Update Page 30 of 53 Washington Metropolitan Area Transit Authority Board Action/Information Summary Action Information
Chicago Transit Authority Financial Statements for the Years Ended December 31, 2000 and 1999 and Supplementary Information and Independent Auditors'
 Chicago Transit Authority Financial Statements for the Years Ended December 31, 2000 and 1999 and Supplementary Information and Independent Auditors' Report TABLE OF CONTENTS Page INDEPENDENT AUDITORS'
Proposed Budget Fiscal Year 2010 July 1, 2009 June 30, 2010
 Proposed Budget Fiscal Year 2010 July 1, 2009 June 30, 2010 Presented to the Board of Directors: Finance, Administration, and Oversight Committee January 8, 2009 1 General Manager s Overview And Summary
Operating Budget Report
 Operating Report Operating ($ in Millions) Operating Expenditures ($ in Millions) Jun-11 Jun-12 $ Percent Revenue $ 212,640 $ 217,643 $ 214,671 $ 2,973 1% Expense $ 359,102 $ 361,882 $ 366,332 $ 4,450
1 ST QUARTER 2017 QUARTERLY FINANCIAL AND PERFORMANCE REPORT
 1 ST QUARTER 2017 QUARTERLY FINANCIAL AND PERFORMANCE REPORT May 2017 0 1 st Quarter 2017 Financial and Performance Report Table of Contents Executive Summary... 2 Environmental Factors... 4 Ridership...
Operating Budget. Second Quarter Financial Report
 Second Quarter Financial Report INDEX A. Executive Summary... A-1 B. Revenue and Expense Analysis... B-1 C. Budget Variance Reports... C-1 D. Ridership and Performance Measures... D-1 Board Budget Committee
METRO. Fiscal Year 2012 Monthly Board Report. December 2011 (First Quarter Fiscal Year-to-Date)
") METRO Fiscal Year 2012 Monthly Board Report Revenue Expense Ridership Performance (First Quarter Fiscal Year-to-Date) 1/27/2012 Table of Contents Section A Section B Section C Section D Section E Section
METRO Fiscal Year 2012 Monthly Board Report Revenue Expense Ridership Performance (First Quarter Fiscal Year-to-Date) 1/27/2012 Table of Contents Section A Section B Section C Section D Section E Section
REGIONAL TRANSPORTATION DISTRICT, COLORADO AS OF DECEMBER 31, 2015
 AS OF DECEMBER 31, RTD Active Fleet of the District Fixed Route Bus Fleet: Number RTD Owned- Fixed Route Buses 40' Transit Coaches 620 Articulated Buses 110 Intercity Coaches 175 Mall Shuttles 37 30' Transit
CHICAGO TRANSIT AUTHORITY PRESIDENT S FY2017 BUDGET RECOMMENDATIONS. Analysis and Recommendations
 CHICAGO TRANSIT AUTHORITY PRESIDENT S FY2017 BUDGET RECOMMENDATIONS Analysis and Recommendations November 14, 2016 TABLE OF CONTENTS EXECUTIVE SUMMARY... 1 CIVIC FEDERATION POSITION... 3 ISSUES THE CIVIC
Operating Budget Report
 Operating Budget Report Operating Budget ($ in Millions) Operating Expenditures ($ in Millions) MTD May-FY2011 May - FY2012 Variance FY12 Actual Actual Budget $ Percent $140M Revenue $ 68,140 $ 70,480
Section I Year-to-date revenues collected and projected revenues and expenditures for the current fiscal year
 Report to Secretary of Administration and Finance and House and Senate Committees on Ways and Means regarding Revenue Projections and Changes to Fare and Fee Structure of the Massachusetts Bay Transportation
New York City Transit
 New York City Transit MTA New York City Transit 2008 Preliminary Budget July Financial Plan 2008 2011 MISSION STATEMENT The mission of MTA New York City Transit is to provide customers with safe, reliable
FY2011 Budget Forum. District of Columbia. October 19, 2009
 FY2011 Budget Forum District of Columbia October 19, 2009 0 Meeting agenda What is Metro and what is the value of Metro service? What are the Fiscal Year 2011 budget challenges? What are the potential
3 RD QUARTER 2016 QUARTERLY FINANCIAL AND PERFORMANCE REPORT
 3 RD QUARTER 2016 QUARTERLY FINANCIAL AND PERFORMANCE REPORT November 2016 0 3 rd Quarter 2016 Financial and Performance Report Table of Contents Executive Summary... 1 Environmental Factors... 3 Ridership...
Operating Budget Stability Q1 FY17 Financial Update
 Operating Budget Stability Q1 FY17 Financial Update Report to Fiscal and Management Control Board Without action, operating deficit was on track to reach $427M by FY20 STATUS QUO FY17 PRO FORMA 8.1.2015
SOUTHEASTERN PENNSYLVANIA TRANSPORTATION AUTHORITY. Financial Statements June 30, 2018 and (With Independent Auditors Report Thereon)
") SOUTHEASTERN PENNSYLVANIA TRANSPORTATION AUTHORITY Financial Statements June 30, 2018 and 2017 (With Independent Auditors Report Thereon) SOUTHEASTERN PENNSYLVANIA TRANSPORTATION AUTHORITY YEARS ENDED
SOUTHEASTERN PENNSYLVANIA TRANSPORTATION AUTHORITY Financial Statements June 30, 2018 and 2017 (With Independent Auditors Report Thereon) SOUTHEASTERN PENNSYLVANIA TRANSPORTATION AUTHORITY YEARS ENDED
REGIONAL TRANSPORTATION DISTRICT, COLORADO
 REGIONAL TRANSPORTATION DISTRICT, COLORADO Series 2004 Lease RTD Active Fleet of the District Fiscal Year Ended December 31, 2013 Fixed Route Bus Fleet Number RTD Owned Fixed Route Buses 40' Transit Coaches
4 TH QUARTER 2017 QUARTERLY FINANCIAL AND PERFORMANCE REPORT
 4 TH QUARTER 2017 QUARTERLY FINANCIAL AND PERFORMANCE REPORT February 2018 0 4 th Quarter 2017 Financial and Performance Report Table of Contents Executive Summary... 2 Environmental Factors... 4 Ridership...
Washington Metropolitan Area Transit Authority Metro Budget Overview
 Washington Metropolitan Area Transit Authority Metro Budget Overview February 2011 Metro 10,877 Employees (10,974 budgeted) 1,491 Buses 588 Escalators and 237 Elevators 106 Miles of Track 92 Traction Power
METRO. Fiscal Year 2013 Monthly Board Report. December 2012 (First Quarter Fiscal Year-to-Date)
") METRO Fiscal Year 2013 Monthly Board Report Revenue Expense Ridership Performance (First Quarter Fiscal Year-to-Date) 1/14/2013 Table of Contents Section A Section B Section C Section D Section E Section
METRO Fiscal Year 2013 Monthly Board Report Revenue Expense Ridership Performance (First Quarter Fiscal Year-to-Date) 1/14/2013 Table of Contents Section A Section B Section C Section D Section E Section
2 ND QUARTER 2017 QUARTERLY FINANCIAL AND PERFORMANCE REPORT
 2 ND QUARTER 2017 QUARTERLY FINANCIAL AND PERFORMANCE REPORT August 2017 0 2 nd Quarter 2017 Financial and Performance Report Table of Contents Executive Summary... 2 Environmental Factors... 4 Ridership...
4TH QUARTER 2016 QUARTERLY FINANCIAL AND PERFORMANCE REPORT
 4TH QUARTER 2016 QUARTERLY FINANCIAL AND PERFORMANCE REPORT February 2017 0 Quarterly Financial and Performance Report 4th Quarter 2016 4th Quarter 2016 Financial and Performance Report Table of Contents
FY2014 Operating Budget Performance Report
 Finance & Administration Committee Information Item IV-C September 11, 2014 FY2014 Operating Budget Performance Report Washington Metropolitan Area Transit Authority Board Action/Information Summary Action
METRO. Fiscal Year 2014 Monthly Board Report. May 2014
 METRO Fiscal Year 2014 Monthly Board Report Revenue Expense Ridership Performance 7/11/2014 Table of Contents Section A Section B Section C Section D Section E Section F Section G Section H Section I Section
CHICAGO TRANSIT AUTHORITY PRESIDENT S FY2019 BUDGET RECOMMENDATIONS. Analysis and Recommendations
 CHICAGO TRANSIT AUTHORITY PRESIDENT S FY2019 BUDGET RECOMMENDATIONS Analysis and Recommendations November 7, 2018 TABLE OF CONTENTS EXECUTIVE SUMMARY... 1 CIVIC FEDERATION POSITION... 4 ISSUES THE CIVIC
METRO MONTHLY BOARD REPORT
 METRO Revenue Expenses Service Performance Fiscal Year FY2011 Table of Contents Section A Section B Section C Section D Section E Section F Section G Section H Summary Sales Tax Revenue Fare Revenue Operating
($ in millions) Mid-Year
 Mid-Year") Table 1 Actual Variance Percent Actual Variance Percent Actual Variance Percent Revenue Farebox Revenue $379.0 $381.0 $2.0 0.5 $0.0 $0.0 $0.0 - $379.0 $381.0 $2.0 0.5 Vehicle Toll Revenue 122.6 125.2 2.5
Table 1 Actual Variance Percent Actual Variance Percent Actual Variance Percent Revenue Farebox Revenue $379.0 $381.0 $2.0 0.5 $0.0 $0.0 $0.0 - $379.0 $381.0 $2.0 0.5 Vehicle Toll Revenue 122.6 125.2 2.5
FY2018 Second Quarter Financial Update
 Finance and Committee Information Item III-A February 8, 2018 Second Quarter Financial Update 4 of 52 Washington Metropolitan Area Transit Authority Board Action/Information Summary Action Information
May 31, 2016 Financial Report
 2016 May 31, 2016 Financial Report Capital Metropolitan Transportation Authority 7/13/2016 Table of Contents SUMMARY REPORTS Budgetary Performance - Revenue 2 - Sales Tax Revenue 6 - Operating Expenses
METRO. Fiscal Year 2013 Monthly Board Report. November 2012
 METRO Fiscal Year 2013 Monthly Board Report Revenue Expense Ridership Performance 12/13/2012 Table of Contents Section A Section B Section C Section D Section E Section F Section G Section H Section I
1ST QUARTER May 2018
 1ST QUARTER 2018 May 2018 0 1 st Quarter 2018 Financial and Performance Report Table of Contents Executive Summary... 2 Environmental Factors... 4 Ridership... 6 Peer Ridership Comparison... 7 Operating
Operating Budget. Third Quarter Financial Report (July 2005 March 2006)
") Third Quarter Financial Report (July 2005 March 2006) INDEX A. Executive Summary...page 2 B. Revenue and Expense Analysis...page 3 C. Budget Variance Reports...page 14 D. Ridership and Performance Measures...page
Third Quarter Financial Report (July 2005 March 2006) INDEX A. Executive Summary...page 2 B. Revenue and Expense Analysis...page 3 C. Budget Variance Reports...page 14 D. Ridership and Performance Measures...page
Operating Budget Report
 Operating Budget Report MTD Operating Budget ($ in Millions) Sept-FY2012 Sept-FY2013 Variance FY13 Actual Actual Budget $ Percent $140M Operating Expenditures ($ in Millions) Revenue $ 67 $ 68 $ 71 $ (3)
METRO. Fiscal Year 2015 Monthly Board Report. February 2015
 METRO Fiscal Year 2015 Monthly Board Report Revenue Expense Ridership Performance 4/2/2015 Table of Contents Section A Section B Section C Section D Section E Section F Section G Section H Section I Section
Financial Report - FY 2017 Year to Date May 31, 2017
 Financial Report - FY 2017 Year to Date July 19, 2017 1 Major Highlights Revenue Sales tax remittances received through YTD April 2017 are 4.2% higher than YTD April 2016 Plaza Saltillo lease income budgeted
OPERATING BUDGET REPORT
 OPERATING BUDGET REPORT OPERATING BUDGET ($ in Millions) MTD Nov-FY2012 Nov-FY2013 Actual Actual Budget $ Percent Revenue $ 63.0 $ 65.7 $ 68.3 $ (2.7) -3.9% Expense $ 107.6 $ 124.8 $ 129.8 $ 5.0 3.8% Subsidy
3 RD QUARTER 2017 QUARTERLY FINANCIAL AND PERFORMANCE REPORT
 3 RD QUARTER 2017 QUARTERLY FINANCIAL AND PERFORMANCE REPORT November 2017 0 3 rd Quarter 2017 Financial and Performance Report Table of Contents Executive Summary... 2 Environmental Factors... 4 Ridership...
Operating Budget Report
 Operating Budget Report MTD Operating Budget ($ in Millions) Oct-FY2012 Oct-FY2013 Variance FY13 Actual Actual Budget $ Percent $140M Operating Expenditures ($ in Millions) Revenue $ 67 $ 70 $ 79 $ (8)
METRO. Monthly Board Report. June 2006
 METRO Monthly Board Report Operating Capital Service Performance June 26 7/17/26 June 26 MONTHLY BOARD REPORT INDEX Section A Section B Section C Section D Section E Section F Section G Operating Budget
FY2017 Year-End Financial Update
 Finance Committee Information Item III-A September 14, 2017 FY2017 Year-End Financial Update Washington Metropolitan Area Transit Authority Board Action/Information Summary Action Information MEAD Number:
CHICAGO TRANSIT AUTHORITY CHICAGO, ILLINOIS
 CHICAGO, ILLINOIS FINANCIAL STATEMENTS AND SUPPLEMENTARY INFORMATION Years Ended (With Independent Auditor s Report Thereon) Chicago, Illinois FINANCIAL STATEMENTS Years Ended TABLE OF CONTENTS Independent
The Board of Directors announces the unaudited results for the Third Quarter and 9 Months ended 30 September 2013.
 SBS TRANSIT LTD Company Registration No: 199206653M Third Quarter 2013 Financial Statements The Board of Directors announces the unaudited results for the Third Quarter and 9 Months ended 30 September
What is the Regional Guaranteed Ride Home (GRH) Program?
 Program?") What is the Regional Guaranteed Ride Home (GRH) Program? Multi-county sponsored program Reimburses cost of emergency rides for ridesharing employees Employers must enroll through their local County Transportation
What is the Regional Guaranteed Ride Home (GRH) Program? Multi-county sponsored program Reimburses cost of emergency rides for ridesharing employees Employers must enroll through their local County Transportation
PROPOSED FISCAL YEAR 2011 BUDGET. Testimony of. Richard Sarles, General Manager. Washington Metropolitan Area Transit Authority.
 PROPOSED FISCAL YEAR 2011 BUDGET Testimony of Richard Sarles, General Manager Washington Metropolitan Area Transit Authority Before the Council of the District of Columbia Committee on Public Works and
Agenda. Pre-Trip Approval Booking Travel Methods of Payments. During Travel Travel Status Allowable Expenses Unallowable Expenses
 Travel Training Training Takeaways: Policies, rules, regulations, and procedures related to traveling on WSU business; Full travel process from approval to reimbursement; and Answers to frequently asked
February 2016 Financial Report
 2016 February 2016 Financial Report Capital Metropolitan Transportation Authority 4/13/2016 Table of Contents SUMMARY REPORT Budgetary Performance - Revenue 2 - Sales Tax Revenue 5 - Operating Expenses
METRO. Fiscal Year 2013 Monthly Board Report. January 2013
 METRO Fiscal Year 2013 Monthly Board Report Revenue Expense Ridership Performance 2/14/2013 Table of Contents Section A Section B Section C Section D Section E Section F Section G Section H Section I Section
METRO. Fiscal Year Monthly Performance Report. Revenue Expense Ridership Performance. November 2018 (Third Quarter Fiscal Year-to Date)
") METRO Fiscal Year 2019 Monthly Performance Report Revenue Expense Ridership Performance (Third Quarter Fiscal Year-to Date) 12/12/2018 Table of Contents Section A Section B Section C Section D Section
METRO Fiscal Year 2019 Monthly Performance Report Revenue Expense Ridership Performance (Third Quarter Fiscal Year-to Date) 12/12/2018 Table of Contents Section A Section B Section C Section D Section
3RD QUARTER November 2018
 3RD QUARTER 2018 November 2018 0 Quarterly Financial and Performance Report 3rd Quarter 2018 3rd Quarter 2018 Financial and Performance Report Table of Contents Executive Summary... 2 Environmental Factors...
PRE TRIP. Travel Training. Agenda 12/22/2017 WASHINGTON STATE UNIVERSITY
 Travel Training Training Takeaways: Policies, rules, regulations, and procedures related to traveling on WSU business; Full travel process from approval to reimbursement; and Answers to frequently asked
Quarterly Budget Report
 City of Chicago Quarterly Report 2 nd Quarter Mayor Rahm Emanuel Quarterly Report-2 nd Quarter Content and Purpose This quarterly report presents an overview of the City s operating revenues and expenditures
FORT WORTH TRANSPORTATION AUTHORITY
 FINANCIAL REPORT SEPTEMBER 30, 2010 C O N T E N T S INDEPENDENT AUDITOR'S REPORT... 1 MANAGEMENT'S DISCUSSION AND ANALYSIS... 3 Page BASIC FINANCIAL STATEMENTS Statements of Net Assets... 8 Statements
- II OPERATING BUDGET REPORT ^ H FY2013 ^^ H. ««-ms. I ~?j i... \6.3 j^^^^^^ YTD OVERTIME BUDGET VS ACTUAL ($ in Millions) 1
 1") OPERATING BUDGET REPORT ^ H FY2013 ^^ H OPERATING BUDGET($ in Millions) MTD Revenue Expense Subsidy Cost Recovery YTD Revenue Expense Subsidy Cost Recovery Jan-FY2012 Jan-FY2013 Variance FY13 Actual Actual
OPERATING BUDGET REPORT ^ H FY2013 ^^ H OPERATING BUDGET($ in Millions) MTD Revenue Expense Subsidy Cost Recovery YTD Revenue Expense Subsidy Cost Recovery Jan-FY2012 Jan-FY2013 Variance FY13 Actual Actual
ADOPTED 2017 OPERATING BUDGET AND CAPITAL PROGRAM
 2017 Budget December 2016 ADOPTED 2017 OPERATING BUDGET AND CAPITAL PROGRAM Summary Briefing of the Adopted Operating Budgets, Two-Year Financial Plans, and Five-Year Capital Programs of the RTA, CTA,
CHATHAM AREA TRANSIT CHATHAM AREA TRANSIT AUTHORITY FINANCIAL REPORT
 CHATHAM AREA TRANSIT CHATHAM AREA TRANSIT AUTHORITY FINANCIAL REPORT Years Ended June 30, 2017 and 2016 CHATHAM AREA TRANSIT AUTHORITY TABLE OF CONTENTS Pages FINANCIAL SECTION: Independent Auditor s Report
Audit Presentation. May 25, Donna M. Gonser, CPA Christa L. Kopacz, CPA
 Audit Presentation May 25, 2012 Donna M. Gonser, CPA Christa L. Kopacz, CPA 403 Main St., Suite 430 Buffalo, NY 14203 716-856-3300 www.lumsdencpa.com 0 Engagement Scope Audit Scope and Reports Financial
Financial Management Report... 3
 November 13, 2013 Table of Contents Financial Management Report... 3 OPERATING FUNDS STATEMENT OF REVENUES & EXPENSES... 3 METROPOLITAN COUNCIL INVESTMENT PERFORMANCE SHORT-TERM PORTFOLIO... 4 METROPOLITAN
CHICAGO TRANSIT AUTHORITY PRESIDENT S FY2016 BUDGET RECOMMENDATIONS. Analysis and Recommendations
 CHICAGO TRANSIT AUTHORITY PRESIDENT S FY2016 BUDGET RECOMMENDATIONS Analysis and Recommendations November 13, 2015 TABLE OF CONTENTS EXECUTIVE SUMMARY... 1 CIVIC FEDERATION POSITION... 4 ISSUES THE CIVIC
ARLINGTON COUNTY, VIRGINIA. County Board Agenda Item Meeting of October 15, Receive the County Manager s Budget Forecast for Fiscal Year 2018.
 ARLINGTON COUNTY, VIRGINIA County Board Agenda Item Meeting of October 15, 2016 DATE: October 14, 2016 SUBJECT: Presentation of the FY 2018 Financial C. M. RECOMMENDATION: Receive the County Manager s
COMMUTER RAIL DIVISION OF THE REGIONAL TRANSPORTATION AUTHORITY AND THE NORTHEAST ILLINOIS REGIONAL COMMUTER RAILROAD CORPORATION
 Financial Statements and Supplementary Information (With Independent Auditors Report Thereon) Table of Contents Page(s) Independent Auditors Report 1 2 Management s Discussion and Analysis (Unaudited)
Travel, Transportation Modes and Transportation-Related Expenses
 Authority: History: Source of Authority: Related Links: Responsible Office: 05.179 Travel, Transportation Modes and Transportation-Related Expenses Vice Chancellor of Business Affairs Effective June 1,
SOUTHEASTERN PENNSYLVANIA TRANSPORTATION AUTHORITY. Financial Statements June 30, 2017 and (With Independent Auditors Report Thereon)
") SOUTHEASTERN PENNSYLVANIA TRANSPORTATION AUTHORITY Financial Statements June 30, 2017 and 2016 (With Independent Auditors Report Thereon) SOUTHEASTERN PENNSYLVANIA TRANSPORTATION AUTHORITY YEARS ENDED
SOUTHEASTERN PENNSYLVANIA TRANSPORTATION AUTHORITY Financial Statements June 30, 2017 and 2016 (With Independent Auditors Report Thereon) SOUTHEASTERN PENNSYLVANIA TRANSPORTATION AUTHORITY YEARS ENDED
COMMUTER RAIL DIVISION OF THE REGIONAL TRANSPORTATION AUTHORITY AND THE NORTHEAST ILLINOIS REGIONAL COMMUTER RAILROAD CORPORATION
 Financial Statements and Supplementary Information (With Independent Auditors Report Thereon) Table of Contents Page(s) Independent Auditors Report 1 2 Management s Discussion and Analysis (Unaudited)
BOARD OF DIRECTORS REPORT
 BOARD OF DIRECTORS REPORT To: David A. Genova, General Manager Date: October 9, 2018 From: Heather McKillop, Chief Financial Officer GM Date: October 9, 2018 Board Meeting Date: October 16, 2018 Subject:
Financial Report to the Board of Trustees
 Financial Report to the Board of Trustees February 18, 2010 FY09 Closeout and FY10 Six Month Update University of Connecticut Health Center FY09 Closeout 2 University of Connecticut Health Center FY 2009
August 31, 2016 Financial Report
 August 31, 2016 Financial Report Capital Metropolitan Transportation Authority 10/14/2016 Table of Contents SUMMARY REPORTS Budgetary Performance - Revenue 2 - Sales Tax Revenue 6 - Operating Expenses
2011 Citizens' Summary
 2011 Citizens' Summary Transmittal Letter Executive Summary TL - 1 A Strategic Approach to the Budget TL - 4 Program and Project Initiatives TL - 5 Fare Structure TL - 6 General Fund TL - 7 Service Levels
JANUARY FY Monthly Financial and Operational Report. Rhode Island Public Transit Authority
 JANUARY FY 2019 Monthly Financial and Operational Report Rhode Island Public Transit Authority Financial Summary As of December FY 2019 Budget Actual Variance % Variance Revenues $ 64,896,602 $ 58,000,401
CTA 2007 Contingency Plan
 CTA 2007 Contingency Plan JUST THE FACTS RTA Directive Unless the RTA Board makes a determination no later than July 1, 2007, that the funds identified as new transit funding are available for 2007 such
METRO. Fiscal Year Monthly Performance Report. Revenue Expense Ridership Performance. February 2018 (First Quarter Fiscal Year-to Date)
") METRO Fiscal Year 2018 Monthly Performance Report Revenue Expense Ridership Performance (First Quarter Fiscal Year-to Date) 3/12/2018 Table of Contents Section A Section B Section C Section D Section E
METRO Fiscal Year 2018 Monthly Performance Report Revenue Expense Ridership Performance (First Quarter Fiscal Year-to Date) 3/12/2018 Table of Contents Section A Section B Section C Section D Section E
METRO. Fiscal Year 2017 Monthly Performance Report. Revenue Expense Ridership Performance. October 2016
 METRO Fiscal Year 2017 Monthly Performance Report Revenue Expense Ridership Performance 11/18/2016 Table of Contents Section A Section B Section C Section D Section E Section F Section G Section H Section
Adopted 2018 OPERATING BUDGET Two-Year Financial Plan and Five-Year CAPITAL PROGRAM
 2018 Adopted 2018 OPERATING BUDGET Two-Year Financial Plan and Five-Year CAPITAL PROGRAM MOVING YOU Northeastern Illinois December 2017 RTA Board of Directors Kirk Dillard Chairman Anthony K. Anderson
2004 Operating and Capital Program Financial Plan for Operations, and Capital Plan
 PAST AND FUTURE RESPONSIBLE PUBLIC SERVICE 2004 Operating and Capital Program 2004 2006 2006 Financial Plan for Operations, and 2004 2008 2008 Capital Plan A Fresh Approach To Public Transportation Final
Board of Directors. John J. Case, Chairman. Terrance M. Carr, Director West Central Suburban Cook County
 Final Program November 2003 Board of Directors John J. Case, Chairman Terrance M. Carr, Director West Central Suburban Cook County James C. Harris, Director South Suburban Cook County Richard A. Kwasneski,
RIVERSIDE TRANSIT AGENCY 1825 Third Street Riverside, CA November 17, 2005
 RIVERSIDE TRANSIT AGENCY 1825 Third Street Riverside, CA 92507 November 17, 2005 TO: THRU: FROM: SUBJECT: Summary: BOARD OF DIRECTORS Larry Rubio, Chief Executive Officer Chris Gallanes, Chief Financial
CHICAGO TRANSIT AUTHORITY PRESIDENT S FY2018 BUDGET RECOMMENDATIONS. Analysis and Recommendations
 CHICAGO TRANSIT AUTHORITY PRESIDENT S FY2018 BUDGET RECOMMENDATIONS Analysis and Recommendations December 12, 2017 TABLE OF CONTENTS EXECUTIVE SUMMARY... 1 CIVIC FEDERATION POSITION... 5 CIVIC FEDERATION