|
|
|
- Matthew McKinney
- 5 years ago
- Views:
Transcription
1
2
3
4
5
6
7
8
9
10
11
12
13
14
15
16
17
18
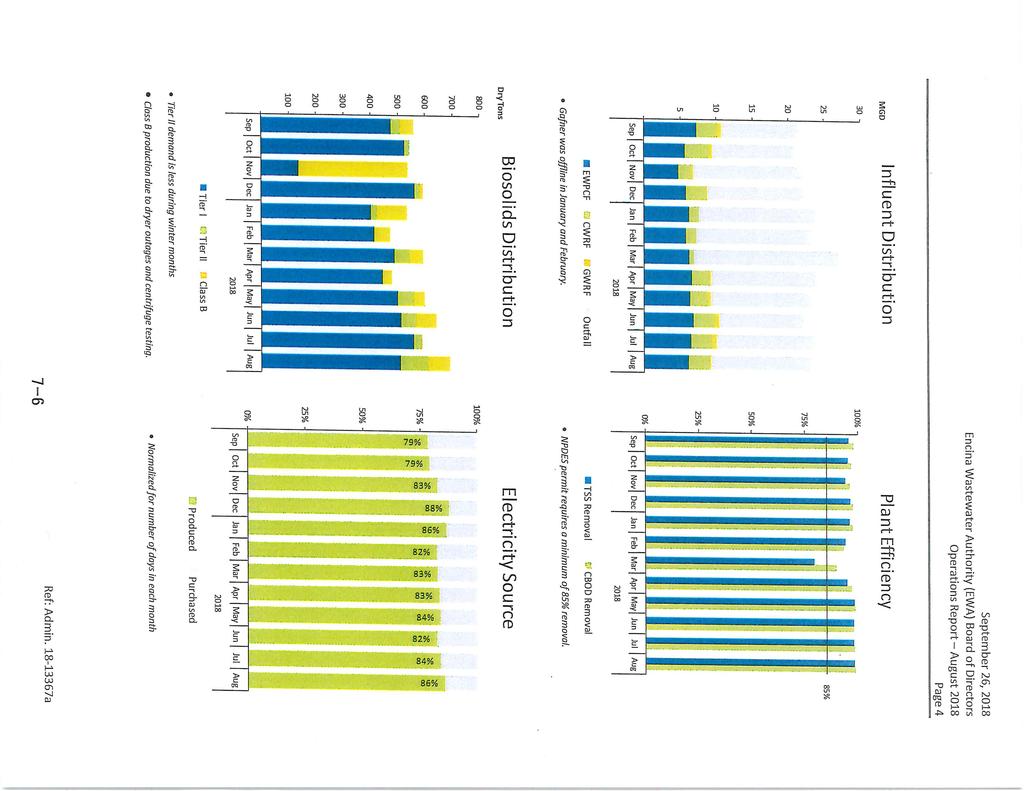
19 ENCINA WASTEWATER AUTHORITY Key Performance Indicators FY2019 August 31, 2018 Encina Water Pollution Control Facility These key performance indicators illustrate various aspects of the EWA's operations with historical performance, industry benchmarks and self imposed goals. NPDES Permit Compliance EWA holds a National Pollutant Discharge Elimination System (NPDES) Permit EWA Goal 0.3 yr 3 yr Electricity Onsite Generation FY 2019 FY 2018 Goal Proactive Maintenance FY 2019 FY 2018 Goal 80% 83% 85% PureGreen Class A Production FY 2019 FY 2018 Goal Alternative Fuel Receiving FY 2019 FY 2018 Goal 304, ,825 gal gal 79% 94% 80% 78% 508,009 93% 97% Operating Costs per Million Gallons Treated gal issued by the Regional Water Quality Control Board for discharge from the Encina Ocean Outfall. In March 2018, the facility experienced a plant upset for the first time in nine years which resulted in a permit violation. EWA generates the majority of its Treatment Plant electricity demand onsite through its Cogeneration System whereby methane gas is collected from the digesters and used as an alternative fuel source. The California treatment plant benchmark is 75%, but staff has a self imposed goal of 80%. The Technical Services Team focuses on performing preventive maintenance inan effort to support equipment reliability and service life, and in turn, reduce reactive costs. It is standard for two thirds of maintenance activities in treatment plants to be proactive in nature, but staff has a self imposed goal of 80%. The Operations Team uses the heat drying process to produce a Class A Biosolid known as PureGreen fertilizer which can be directly applied to land. This metric illustrates the percentage of wastewater solids converted into Class A. This may gradually decline as solids receiving increases and digester capacity is reached. The Alternative Fuel Receiving Facility receives deliveries of Fats, Oils, Grease (FOG) and Brewery Waste. EWA earns tipping fees for accepting this and generates additional methane gas by feeding it into the digesters. This metric illustrates the monthly average gallons of FOG and Brewery Waste received. $1,550 $1,450 $1,350 FY 2017 FY 2018 FY 2019 Jul Oct Jan Apr This metric depicts each month's rolling 12 month cost per million gallons treated. EWA's operating costs are largely driven by personnel, energy and chemical consumption. Because much of this is commodity price driven, we anticipate the cost per million gallons to increase by an inflationary rate, all else being equal. This graph illustrates the increased cost per million gallons treated in FY2018 as a result of EWA adding two full time operators dedicated to heat dryer operations. In addition, the plant witnessed increased energy costs and improved on executing planned services within the annual budget. Training Overtime Safety Attrition Odor 30 Goal 42 FY18 47 FY19 hours per employee (annualized) < 2.3% 3.4% 2.8% Goal FY18 FY19 < Goal FY18 0 < FY19 FY19 Goal FY18 % of salaries total injury rate employee turnover % (excluding retirements) 1.4 < 3 Goal 28 FY18 complaints 1 FY19
20
21
22
23 ITEM 9 APPROVAL OF DEMANDS DASHBOARD FOR AUGUST 2018 Summary Operating $ 1,839,343 Capital $ 1,187,904 August Demands $ 3,027,246 YTD Demands $ 6,385,827 39% August YTD 36% 8% 17% 2019 Budget 2019 Budget FY2019 Budget $ 38,086,184 61% 64% $3.0 M Historical Trend $2.5 M $2.0 M $1.8 M $1.5 M $1.0 M $1.2 M $0.5 M Jun Jul Aug Sep Oct Nov Dec Jan Feb Mar Apr May Jun Jul Aug FY2018 FY2019 Demands Mix Top 10 Vendors Payroll 38% $1,141K Vendors 62% $1,887K 484 invoices processed JR FILANC CONSTRUCTION COMPANY INC ENTERPRISE AUTOMATION HAWTHORNE POWER SYSTEMS SAN DIEGO GAS & ELECTRIC CAROLLO ENGINEERS, INC. POLYDYNE INC AG TECH LLC ANDRITZ SEPARATION INC TEKWORKS CDW GOVERNMENT OTHER $515 K $155 K $150 K $130 K $106 K $70 K $66 K $49 K $47 K $46 K $553 K This represents unaudited data.
24
25
26
27
28
29
30
31
32
33
34
35
36
37
38
39
40
41
42
43
44
45
46
47
48
49
50
51 ITEM 10 TREASURER'S CASH AND INVESTMENTS REPORT DASHBOARD FOR AUGUST 2018 $10M Cash & Investments $8M $6M $5.3M $4M $2M $2.4M $1.8M Jun Jul Aug Sep Oct Nov Dec Jan Feb Mar Apr May Jun Jul Aug FY2018 Total LAIF CAMP Cash FY2019 $6M $5M Disbursements $4M $3M $3.0M $2M $1M Jun Jul Aug Sep Oct Nov Dec Jan Feb Mar Apr May Jun Jul Aug FY2018 FY2019 $8M Receipts $6M $4.7M $4M $2M Jun Jul Aug Sep Oct Nov Dec Jan Feb Mar Apr May Jun Jul Aug FY2018 FY2019 This represents unaudited data.
52
53
54
55
56

57
58
59
60
61
62

63
64
65 ITEM 11 FISCAL YEAR TO DATE OPERATING BUDGET PERFORMANCE REPORT DASHBOARD FOR AUGUST 2018 $0.0M $3.5M $6.9M $10.4M $13.9M 14% Carlsbad $ Carlsbad $ 670K Vista $ Vista $ 540K Vallecitos $ Vallecitos $ 444K Leucadia $ Leucadia $ 390K Buena $ Buena $ 224K Encinitas $ Encinitas $ 106K Q4 Expense $ Q1 Expense $ 2.37M 14% Carlsbad $ 670K Vista $ 540K Vallecitos $ 444K Leucadia $ 390K Buena $ 224K Encinitas $ 106K YTD Expense $ 2.37M FY2018 Budget $ 16.5M 14% Spent YTD 86% Carlsbad $ Carlsbad $ Vista $ Vista $ Vallecitos $ Vallecitos $ Leucadia $ Leucadia $ Buena $ Buena $ Encinitas $ Encinitas $ Q3 Expense $ Q2 Expense $ This represents unaudited data.
66
67
68
69
70
71
72

73

74

75
76

77
78

79
80
81
XML Publisher Balance Sheet Vision Operations (USA) Feb-02
 Feb-02") Page:1 Apr-01 May-01 Jun-01 Jul-01 ASSETS Current Assets Cash and Short Term Investments 15,862,304 51,998,607 9,198,226 Accounts Receivable - Net of Allowance 2,560,786
Page:1 Apr-01 May-01 Jun-01 Jul-01 ASSETS Current Assets Cash and Short Term Investments 15,862,304 51,998,607 9,198,226 Accounts Receivable - Net of Allowance 2,560,786
GENERAL FUND AT A GLANCE Category Budget YTD Actual % % Year Passed Resources 8.33% Uses 8.33% $0 $1,330,750
 City of Edmond Monthly Financial Report FY 2008/2009 Through the Month Ended Unaudited - Intended for Management Purposes Only The following is a summary of the City's financial results for operating funds.
Big Walnut Local School District
 Big Walnut Local School District Monthly Financial Report for the month ended September 30, 2013 Prepared By: Felicia Drummey Treasurer BIG WALNUT LOCAL SCHOOL DISTRICT SUMMARY OF YEAR TO DATE FINANCIAL
Financial & Business Highlights For the Year Ended June 30, 2017
 Financial & Business Highlights For the Year Ended June, 17 17 16 15 14 13 12 Profit and Loss Account Operating Revenue 858 590 648 415 172 174 Investment gains net 5 162 909 825 322 516 Other 262 146
Economic Activity Index ( GDB-EAI ) For the month of May 2013 G O V E R N M E N T D E V E L O P M E N T B A N K F O R P U E R T O R I C O
 For the month of May 2013 G O V E R N M E N T D E V E L O P M E N T B A N K F O R P U E R T O R I C O") Economic Activity Index ( GDB-EAI ) For the month of May 2013 General Commentary May 2013 GDB-EAI for the month of May registered a 3.4% year-over-year ( YOY ) reduction May 2013 EAI was 126.7, a 3.4%
Economic Activity Index ( GDB-EAI ) For the month of May 2013 General Commentary May 2013 GDB-EAI for the month of May registered a 3.4% year-over-year ( YOY ) reduction May 2013 EAI was 126.7, a 3.4%
FUEL PRICE RISK MANAGEMENT POLICY REPORT "FUEL HEDGE"
 FUEL PRICE RISK MANAGEMENT POLICY REPORT "FUEL HEDGE" Sep-18 FUEL PRICE RISK MANAGEMENT POLICY REPORT Sep-18 (Office of Management and Budget 09/30/2018) The Fuel Price Risk Management Policy approved
ENCINA WASTEWATER AUTHORITY Budget Fiscal Year 2018 ENCINA WASTEWATER AUTHORITY FY2018 RECOMMENDED OPERATING & CAPITAL BUDGETS TABLE OF CONTENTS
 ENCINA WASTEWATER AUTHORITY RECOMMENDED OPERATING & CAPITAL BUDGETS INTRODUCTION TABLE OF CONTENTS Letter of Transmittal... 1 Policy Brief: Workforce Staffing Strategy... 3 Operating Revenue and Expense
QUARTERLY REPORT AND CERTIFICATION OF THE COUNTY TREASURER For Quarter Ending June 30, 2009 COMPLIANCE CERTIFICATION
 QUARTERLY REPORT AND CERTIFICATION OF THE COUNTY TREASURER For Quarter Ending June 30, 2009 The Government Code requires the County Treasurer to render a Quarterly Report to the County Administrator, the
2016 Spring Conference And Training Seminar. Cash Planning and Forecasting
 Cash Planning and Forecasting A different world! Cash forecasting starts with expectations about future flows Uses history to identify beginning balances.and to understand patterns of how things interact
HIPIOWA - IOWA COMPREHENSIVE HEALTH ASSOCIATION Unaudited Balance Sheet As of July 31
 Unaudited Balance Sheet As of July 31 Total Enrollment: 407 Assets: Cash $ 9,541,661 $ 1,237,950 Invested Cash 781,689 8,630,624 Premiums Receivable 16,445 299,134 Prepaid 32,930 34,403 Assessments Receivable
HIPIOWA - IOWA COMPREHENSIVE HEALTH ASSOCIATION Unaudited Balance Sheet As of January 31
 Unaudited Balance Sheet As of January 31 Total Enrollment: 371 Assets: Cash $ 1,408,868 $ 1,375,117 Invested Cash 4,664,286 4,136,167 Premiums Receivable 94,152 91,261 Prepaid 32,270 33,421 Assessments
GENERAL FUND AT A GLANCE Category Budget YTD Actual % % Year Passed Resources 50.00% Uses 50.00% $0 $1,928,600
 City of Edmond Monthly Financial Report FY 2007/2008 Through the Month Ended Unaudited - Intended for Management Purposes Only The following is a summary of the City's financial results for operating funds.
QUESTION 2. QUESTION 3 Which one of the following is most indicative of a flexible short-term financial policy?
 QUESTION 1 Compute the cash cycle based on the following information: Average Collection Period = 47 Accounts Payable Period = 40 Average Age of Inventory = 55 QUESTION 2 Jan 41,700 July 39,182 Feb 18,921
Spheria Australian Smaller Companies Fund
 29-Jun-18 $ 2.7686 $ 2.7603 $ 2.7520 28-Jun-18 $ 2.7764 $ 2.7681 $ 2.7598 27-Jun-18 $ 2.7804 $ 2.7721 $ 2.7638 26-Jun-18 $ 2.7857 $ 2.7774 $ 2.7690 25-Jun-18 $ 2.7931 $ 2.7848 $ 2.7764 22-Jun-18 $ 2.7771
Executive Summary. July 17, 2015
 Executive Summary July 17, 2015 The Revenue Estimating Conference adopted interest rates for use in the state budgeting process. The adopted interest rates take into consideration current benchmark rates
FUEL PRICE RISK MANAGEMENT POLICY REPORT "FUEL HEDGE"
 FUEL PRICE RISK MANAGEMENT POLICY REPORT "FUEL HEDGE" December 2018 FUEL PRICE RISK MANAGEMENT POLICY REPORT December 2018 The Fuel Price Risk Management Policy approved by the Board on February 16, 2006
City of El Segundo Office of the City Treasurer
 City of El Segundo Office of the City Treasurer Date: September 15, 2015 From: Office of the City Treasurer To: El Segundo City Council RE: Investment Portfolio Report As of June 30, 2015 Introduction:
Cash & Liquidity The chart below highlights CTA s cash position at September 2017 compared to September 2016.
 To: Chicago Transit Authority Board From: Jeremy Fine, Chief Financial Officer Re: Financial Results for September 2017 Date: November 15, 2017 I. Summary CTA s financial results are $7.7 million favorable
Big Walnut Local School District
 Big Walnut Local School District Monthly Financial Report for the month ended September 30, 2012 Prepared By: Felicia Drummey Treasurer BIG WALNUT LOCAL SCHOOL DISTRICT SUMMARY OF YEAR-TO-DATE FINANCIAL
TERMS OF REFERENCE FOR THE INVESTMENT COMMITTEE
 I. PURPOSE The purpose of the Investment Committee (the Committee ) is to recommend to the Board the investment policy, including the asset mix policy and the appropriate benchmark for both ICBC and any
Cash & Liquidity The chart below highlights CTA s cash position at January 2018 compared to January 2017.
 To: Chicago Transit Authority Board From: Jeremy Fine, Chief Financial Officer Re: Financial Results for January 2018 Date: March 14, 2018 I. Summary CTA s financial results are $1.7 million unfavorable
11 May Report.xls Office of Budget & Fiscal Planning
 Education and General Fund Actual Revenues and s by Month MTD YTD Change Revenue Jul Aug Sep Oct Nov Dec Jan Feb Mar Apr May Jun Per 14 Total over FY06 Enrollment Fees $ 8,211 $ 219 $ 41,952 ($ 818) $
General Fund Revenue
 Millions Percent of Kathy Steinert, Director of Fiscal Services Phone: 541.923.8927 145 SE Salmon Ave Redmond, OR 97756 kathy.steinert@redmond.k12.or.us Date: May 23, 2014 To: Redmond School District Board
Historical Pricing PJM COMED, Around the Clock. Cal '15 Cal '16 Cal '17 Cal '18 Cal '19 Cal '20 Cal '21 Cal '22
 $50 Historical Pricing PJM COMED, Around the Clock $48 $46 $44 $42 $40 $38 $36 $34 $32 $30 $28 $26 Cal '15 Cal '16 Cal '17 Cal '18 Cal '19 Cal '20 Cal '21 Cal '22 The information presented above was gathered
The year to date is less than budget and prior year by 15.4 million and 11.6 million, respectively.
 To: Chicago Transit Authority Board From: Jeremy Fine, Chief Financial Officer Re: Financial Results for September 2016 Date: November 16, 2016 I. Summary CTA s financial results are $0.3 million unfavorable
Sales Tax Collection Report. For The Month Ending 03/31/14. February 2014 Sales
 Sales Tax Collection Report For The Month Ending 03/31/14 February 2014 Sales Report Prepared By The Sales Tax Department 1 Sales Tax Report Table of Contents Page 3 Sales Tax Recap of Gross Receipts Collected
Investment Performance Report as of June 30, Presented by: Elizabeth B. A. Miller, CFA Chief Investment Officer
 Investment Performance Report as of June 30, 2018 Presented by: Elizabeth B. A. Miller, CFA Chief Investment Officer Joint Committee on Pensions, Investments, and Benefits October 29, 2018 Executive Summary
December 10, Butler School District 53 1
 December 10, 2018 Butler School District 53 1 Key Terms Aggregate Levy annual corporate levy other than debt service Debt Service Levy made to retire the principal or pay interest on bonds Property Tax
Review of Registered Charites Compliance Rates with Annual Reporting Requirements 2016
 Review of Registered Charites Compliance Rates with Annual Reporting Requirements 2016 October 2017 The Charities Regulator, in accordance with the provisions of section 14 of the Charities Act 2009, carried
Management Reports. June for PREPARED BY POWERED BY
 Management Reports for June 217 PREPARED BY POWERED BY Contents 1. Management Reports Cashflow Forecast Actual vs Budget P&L Forecast Where Did Our Money Go? Net Worth 2. Understanding your Reports 3.
Cash & Liquidity The chart below highlights CTA s cash position at June 2018 compared to June 2017.
 To: Chicago Transit Authority Board From: Jeremy Fine, Chief Financial Officer Re: Financial Results for June 2018 Date: August 15, 2018 I. Summary CTA s financial results are unfavorable to budget for
Historical Pricing PJM PSEG, Around the Clock. Cal '15 Cal '16 Cal '17 Cal '18 Cal '19 Cal '20 Cal '21 Cal '22
 $70 Historical Pricing PJM PSEG, Around the Clock $65 $60 $55 $50 $45 $40 $35 $30 $25 Cal '15 Cal '16 Cal '17 Cal '18 Cal '19 Cal '20 Cal '21 Cal '22 The information presented above was gathered and compiled
Quarterly Statistical Digest
 Quarterly Statistical Digest August Volume 27, No. 3 The Statistical Digest is a quarterly publication of the Central Bank of The Bahamas, prepared by the Research Department for issue in February, May,
Board of Directors October 2018 and YTD Financial Report
 Board of Directors October 2018 and YTD Financial Report Consolidated Financial Results Operating Margin October ($30,262) $129,301 ($159,563) Year-to-date $292,283 $931,358 ($639,076) Excess of Revenue
Foundations of Investing
 www.edwardjones.com Member SIPC Foundations of Investing 1 5 HOW CAN I STAY ON TRACK? 4 HOW DO I GET THERE? 1 WHERE AM I TODAY? MY FINANCIAL NEEDS 3 CAN I GET THERE? 2 WHERE WOULD I LIKE TO BE? 2 Develop
February Economic Activity Index ( GDB-EAI )
") February 2014 Economic Activity Index ( GDB-EAI ) General Commentary February 2014 In February 2014, the GDB-EAI registered a 2.4% year-over-year (y-o-y) reduction (the lowest since May 2013), after showing
February 2014 Economic Activity Index ( GDB-EAI ) General Commentary February 2014 In February 2014, the GDB-EAI registered a 2.4% year-over-year (y-o-y) reduction (the lowest since May 2013), after showing
Cash & Liquidity The chart below highlights CTA s cash position at December 2017 compared to December 2016.
 To: Chicago Transit Authority Board From: Jeremy Fine, Chief Financial Officer Re: Financial Results for December 2017 Date: February 14, 2018 I. Summary CTA s financial results are $4.7 million favorable
Factor Leave Accruals. Accruing Vacation and Sick Leave
 Factor Leave Accruals Accruing Vacation and Sick Leave Factor Leave Accruals As part of the transition of non-exempt employees to biweekly pay, the UC Office of the President also requires standardization
Fiscal Year 2018 Project 1 Annual Budget
 Fiscal Year 2018 Project 1 Annual Budget Table of Contents Table Page Summary 3 Summary of Costs Table 1 4 Treasury Related Expenses Table 2 5 Summary of Full Time Equivalent Table 3 6 Positions Cost-to-Cash
Performance Report October 2018
 Structured Investments Indicative Report October 2018 This report illustrates the indicative performance of all Structured Investment Strategies from inception to 31 October 2018 Matured Investment Strategies
Cash & Liquidity The chart below highlights CTA s cash position at March 2017 compared to March 2016.
 To: Chicago Transit Authority Board From: Jeremy Fine, Chief Financial Officer Re: Financial Results for March 2017 Date: May 10, 2017 I. Summary CTA s financial results are $0.6 million favorable to budget
Mechanics of Cash Flow Forecasting
 Texas Association Of State Senior College & University Business Officers July 13, 2015 Mechanics of Cash Flow Forecasting Susan K. Anderson, CEO Anderson Financial Management, L.L.C. 130 Pecan Creek Drive
DECEMBER KPI REPORT. Service Provider SLA Performance Core and Non-Core Settlement Systems Core and Non-Core BSC Systems. Supplier Performance
 1.% 99.5% 99.% 98.5% 98.% 97.5% 97.% Core and Non-Core Settlement Systems Core and Non-Core BSC Systems In December, Core Settlement was affected by Service Desk metrics of less than 1%. Please see below
Quarterly Statistical Digest
 Quarterly Statistical Digest February 2019 Volume 28, No. 1 The Statistical Digest is a quarterly publication of the Central Bank of The Bahamas, prepared by the Research Department for issue in February,
Water Operations Current Month - November 2018
 November 2018 Water Operations Current Month - November 2018 $8.0 Net Operating Revenue (Net of Bad Debt) $8.1 $8.6 $8.0 2.0 1.5 Volumes Billions of Gallons Sold 1.8 1.7 1.6 $6.0 1.0 $4.0 $2.0 0.5 Actual
Business & Financial Services December 2017
 Business & Financial Services December 217 Completed Procurement Transactions by Month 2 4 175 15 125 1 75 5 2 1 Business Days to Complete 25 Jan Feb Mar Apr May Jun Jul Aug Sep Oct Nov Dec 217 Procurement
Cash & Liquidity The chart below highlights CTA s cash position at August 2018 compared to August 2017.
 To: Chicago Transit Authority Board From: Jeremy Fine, Chief Financial Officer Re: Financial Results for August 2018 Date: October 10, 2018 I. Summary CTA s financial results are favorable to budget for
June Economic Activity Index ( GDB-EAI )
") June 2014 Economic Activity Index ( GDB-EAI ) General Commentary June 2014 In June 2014, the GDB-EAI registered a 1.0% year-over-year (y-o-y) reduction, after showing a 1.1% y-o-y decrease in June 2014.
June 2014 Economic Activity Index ( GDB-EAI ) General Commentary June 2014 In June 2014, the GDB-EAI registered a 1.0% year-over-year (y-o-y) reduction, after showing a 1.1% y-o-y decrease in June 2014.
Asset Manager Performance Comparison
 Cape Peninsula University of Technology Retirement Fund August 2017 DISCLAIMER AND WARNINGS: Towers Watson (Pty) Ltd, a Willis Towers Watson company, is an authorised financial services provider. Although
Asset Manager Performance Comparison
 Cape Peninsula University of Technology Retirement Fund September 2017 DISCLAIMER AND WARNINGS: Towers Watson (Pty) Ltd, a Willis Towers Watson company, is an authorised financial services provider. Although
WESTWOOD LUTHERAN CHURCH Summary Financial Statement YEAR TO DATE - February 28, Over(Under) Budget WECC Fund Actual Budget
 Budget WECC Fund Actual Budget") WESTWOOD LUTHERAN CHURCH Summary Financial Statement YEAR TO DATE - February 28, 2018 General Fund Actual A B C D E F WECC Fund Actual Revenue Revenue - Faith Giving 1 $ 213 $ 234 $ (22) - Tuition $ 226
WESTWOOD LUTHERAN CHURCH Summary Financial Statement YEAR TO DATE - February 28, 2018 General Fund Actual A B C D E F WECC Fund Actual Revenue Revenue - Faith Giving 1 $ 213 $ 234 $ (22) - Tuition $ 226
Cash & Liquidity The chart below highlights CTA s cash position at July 2016 compared to July 2015.
 To: Chicago Transit Authority Board From: Jeremy Fine, Chief Financial Officer Re: Financial Results for July 2016 Date: September 14, 2016 I. Summary CTA s financial results are $0.4 million favorable
Monthly Financial Report
 AGENDA ITEM NO: 4.C.1 Monthly Financial Report with data through February 2019 (Unaudited) The data contained in this report has not been independently audited. Alameda Municipal Power Financial Report
QUARTERLY FINANCIAL REPORT December 31, 2017
 California Independent System Operator QUARTERLY FINANCIAL REPORT December 31, 2017 Preliminary and Unaudited 250 Outcropping Way Folsom, CA 95630 (916) 351-4000 CALIFORNIA INDEPENDENT SYSTEM OPERATOR
Economic and Revenue Update
 Economic and Revenue Update A Briefing for the Money Committees Aubrey L. Layne, Jr. Secretary of Finance Commonwealth of Virginia www.finance.virginia.gov January 2018 Topics for Discussion National and
Quarterly Financial Review
 First Quarter 2014 Quarterly Financial Review Norfolk Southern Corporation Finance Department Three Commercial Place Norfolk, Virginia 23510.2191 Norfolk Southern Railway System Contents Consolidated Statements
February Economic Activity Index ( GDB-EAI )
") February 2015 Economic Activity Index ( GDB-EAI ) General Commentary February 2015 In February 2015, the GDB-EAI registered a 1.6% year-over-year (y-o-y) reduction, and a month-over-month (m-o-m) increase
February 2015 Economic Activity Index ( GDB-EAI ) General Commentary February 2015 In February 2015, the GDB-EAI registered a 1.6% year-over-year (y-o-y) reduction, and a month-over-month (m-o-m) increase
Division of Bond Finance Interest Rate Calculations. Revenue Estimating Conference Interest Rates Used for Appropriations, including PECO Bond Rates
 Division of Bond Finance Interest Rate Calculations Revenue Estimating Conference Interest Rates Used for Appropriations, including PECO Bond Rates November 16, 2018 Division of Bond Finance Calculation
Cash & Liquidity The chart below highlights CTA s cash position at March 2018 compared to March 2017.
 To: Chicago Transit Authority Board From: Jeremy Fine, Chief Financial Officer Re: Financial Results for March 2018 Date: May 9, 2018 I. Summary CTA s financial results are $0.9 million favorable to budget
Purpose The purpose of the Controller s Report is to provide summarized financial information on a monthly basis to the Board of Directors.
 November 28, 2018 Attention: Administrative and Finance Committee Controller s Report on Monthly Financial Activity. (Information) Purpose The purpose of the Controller s Report is to provide summarized
Research Accounting & Analysis University of Washington
 Research Accounting & Analysis Grant & Contract Accounting? Management Accounting & Analysis Operational Performance Dashboard for November 2 Quarter 2 FY 2 (October - December 2) Grant and Contract Accounting
F I S C A L & E C O N O M I C U P D A T E
 W A S H I N G T O N C O U N T Y, M A R Y L A N D S E P T E M B E R 2 1 5 F I S C A L & E C O N O M I C U P D A T E M A J O R E C O N O M I C T R E N D S Inside this Report: Employment Data 1 The following
Cost Estimation of a Manufacturing Company
 Cost Estimation of a Manufacturing Company Name: Business: Date: Economics of One Unit: Manufacturing Company (Only complete if you are making a product, such as a bracelet or beauty product) Economics
Cash & Liquidity The chart below highlights CTA s cash position at February 2017 compared to February 2016.
 To: Chicago Transit Authority Board From: Jeremy Fine, Chief Financial Officer Re: Financial Results for February 2017 Date: April 5, 2017 I. Summary CTA s financial results are $0.3 million favorable
Strategic Plan Progress Report Goal 4 Focus. May 2015 San Francisco, California
 Strategic Plan Progress Report Goal 4 Focus May 2015 San Francisco, California 1 Goal 4 focus Create a workplace that delivers outstanding service Objective 4.1 Improve internal communications Objective
Beginning Date: January 2016 End Date: June Managers in Zephyr: Benchmark: Morningstar Short-Term Bond
 Beginning Date: January 2016 End Date: June 2018 Managers in Zephyr: Benchmark: Manager Performance January 2016 - June 2018 (Single Computation) 11200 11000 10800 10600 10400 10200 10000 9800 Dec 2015
Algo Trading System RTM
 Year Return 2016 15,17% 2015 29,57% 2014 18,57% 2013 15,64% 2012 13,97% 2011 55,41% 2010 50,98% 2009 48,29% Algo Trading System RTM 89000 79000 69000 59000 49000 39000 29000 19000 9000 2-Jan-09 2-Jan-10
Revenue Estimating Conference Tobacco Tax and Surcharge Executive Summary
 Revenue Estimating Conference Tobacco Tax and Surcharge Executive Summary February 12, 2014 The Revenue Estimating Conference reviewed Tobacco Tax and Surcharge revenues on February 12, 2014. The forecasts
Beginning Date: January 2016 End Date: September Managers in Zephyr: Benchmark: Morningstar Short-Term Bond
 Beginning Date: January 2016 End Date: September 2018 Managers in Zephyr: Benchmark: Manager Performance January 2016 - September 2018 (Single Computation) 11400 - Yorktown Funds 11200 11000 10800 10600
Quarterly Financial Review
 Second Quarter 2013 Quarterly Financial Review Norfolk Southern Corporation Finance Department Three Commercial Place Norfolk, Virginia 23510.2191 7/20/2012 DRAFTB Norfolk Southern Railway System Contents
PHOENIX ENERGY MARKETING CONSULTANTS INC. HISTORICAL NATURAL GAS & CRUDE OIL PRICES UPDATED TO July, 2018
 Jan-01 $12.9112 $10.4754 $9.7870 $1.5032 $29.2595 $275.39 $43.78 $159.32 $25.33 Feb-01 $10.4670 $7.8378 $6.9397 $1.5218 $29.6447 $279.78 $44.48 $165.68 $26.34 Mar-01 $7.6303 $7.3271 $5.0903 $1.5585 $27.2714
Review of Membership Developments
 RIPE Network Coordination Centre Review of Membership Developments 7 October 2009/ GM / Lisbon http://www.ripe.net 1 Applications development RIPE Network Coordination Centre 140 120 100 80 60 2007 2008
GROUNDWATER REDUCTION PLAN MONTHLY OPERATIONS REPORT MONTH REPORTED: DECEMBER, 2018
 [Type here] GROUNDWATER REDUCTION PLAN MONTHLY OPERATIONS REPORT MONTH REPORTED: DECEMBER, 2018 FY 2019 - Operating Actual vs. Budgeted FYTD 2019 - Key Performance Indicators Actual Budgeted % Variance
Common stock prices 1. New York Stock Exchange indexes (Dec. 31,1965=50)2. Transportation. Utility 3. Finance
2. Transportation. Utility 3. Finance") Digitized for FRASER http://fraser.stlouisfed.org/ Federal Reserve Bank of St. Louis 000 97 98 99 I90 9 9 9 9 9 9 97 98 99 970 97 97 ""..".'..'.."... 97 97 97 97 977 978 979 980 98 98 98 98 98 98 987 988
Digitized for FRASER http://fraser.stlouisfed.org/ Federal Reserve Bank of St. Louis 000 97 98 99 I90 9 9 9 9 9 9 97 98 99 970 97 97 ""..".'..'.."... 97 97 97 97 977 978 979 980 98 98 98 98 98 98 987 988
Constructing a Cash Flow Forecast
 Constructing a Cash Flow Forecast Method and Worked Example A cash flow forecast shows the estimates of the timing and amounts of cash inflows and outflows over a period of time. The sections of a cash
OUR STRATEGIC INITIATIVES
 OUR STRATEGIC INITIATIVES EWA relies upon the strategic business planning process to align the Vision, Mission, Core Values, and Business Principles with the strategies, objectives, goals, and tasks everyday
Looking at a Variety of Municipal Valuation Metrics
 Looking at a Variety of Municipal Valuation Metrics Muni vs. Treasuries, Corporates YEAR MUNI - TREASURY RATIO YEAR MUNI - CORPORATE RATIO 200% 80% 175% 150% 75% 70% 65% 125% Average Ratio 0% 75% 50% 60%
OTHER DEPOSITS FINANCIAL INSTITUTIONS DEPOSIT BARKAT SAVING ACCOUNT
 WEIGHTAGES JAN FEB MAR APR MAY JUN JUL AUG SEPT OCT NOV DEC ANNOUNCEMENT DATE 19.Dez.14 27.Jän.15 24.Feb.15 26.Mär.15 27.Apr.15 26.Mai.15 25.Jun.15 28.Jul.15 26.Aug.15 23.Sep.15 27.Okt.15 25.Nov.15 MUDARIB
May Economic Activity Index ( FAFAA-EAI )
") May 2016 Economic Activity Index ( FAFAA-EAI ) About the interpretation of the FAFAA-EAI The FAFAA-EAI is an indicator of general economic activity, not a direct measurement of real GNP. The annual growth
May 2016 Economic Activity Index ( FAFAA-EAI ) About the interpretation of the FAFAA-EAI The FAFAA-EAI is an indicator of general economic activity, not a direct measurement of real GNP. The annual growth
HUD NSP-1 Reporting Apr 2010 Grantee Report - New Mexico State Program
 HUD NSP-1 Reporting Apr 2010 Grantee Report - State Program State Program NSP-1 Grant Amount is $19,600,000 $9,355,381 (47.7%) has been committed $4,010,874 (20.5%) has been expended Grant Number HUD Region
Net Quick Assets. Target = $510,050 (6 months operating expenses) 12 Month Average Monthly Operating Expenses = $85,008
 12 Month Average Monthly Operating Expenses = $85,008") $800,000 $600,000 $400,000 Net Quick Assets Target = $510,050 (6 months operating expenses) 12 Month Average Monthly Operating Expenses = $85,008 Current Assets Current Liabilities Current Net FINANCIAL
$800,000 $600,000 $400,000 Net Quick Assets Target = $510,050 (6 months operating expenses) 12 Month Average Monthly Operating Expenses = $85,008 Current Assets Current Liabilities Current Net FINANCIAL
Exchange Rate Requirements
 C APPENDIX Foreign Currency Financial Reporting from Euro to Yen to Yuan: A Guide to Fundamental Concepts and Practical Applications By Robert Rowanc Copyright 2011 by SAS Institute, Inc. Exchange Rate
Washington State Health Insurance Pool Treasurer s Report February 2018 Financial Review
 Washington State Health Insurance Pool Treasurer s Report February 2018 Financial Review 1. 2017 Interim III Assessment Required An assessment of $8.5 M was required to adequately fund the pool until the
Dulles Corridor Enterprise Financial Update Dulles Corridor Advisory Committee Meeting
 Dulles Corridor Enterprise Financial Update Dulles Corridor Advisory Committee Meeting December 15, 2014 Discussion Outline Finance Plan for the Metrorail Project Allocation of Estimated Capital Costs
Financial Report - FY 2017 Year to Date May 31, 2017
 Financial Report - FY 2017 Year to Date July 19, 2017 1 Major Highlights Revenue Sales tax remittances received through YTD April 2017 are 4.2% higher than YTD April 2016 Plaza Saltillo lease income budgeted
Washington State Health Insurance Pool Treasurer s Report March 2018 Financial Review
 Washington State Health Insurance Pool Treasurer s Report March 2018 Financial Review 1. 2017 Interim III Assessment Required An assessment of $8.5 M was required to adequately fund the pool until the
Washington State Health Insurance Pool Treasurer s Report January 2018 Financial Review
 Washington State Health Insurance Pool Treasurer s Report January 2018 Financial Review 1. 2017 Interim III Assessment Required An assessment of $8.5 M was required to adequately fund the pool until the
Earned Value Management An Overview March 2014
 Earned Value Management An Overview March 2014 SAVE International Cascadia Chapter Introduction What is Earned Value? Why is Earned Value important? What is required? Earned Value Definitions & Process
Washington State Health Insurance Pool Treasurer s Report April 2018 Financial Review
 Washington State Health Insurance Pool Treasurer s Report April 2018 Financial Review 1. 2018 Interim I Assessment Required An assessment of $7.0 M is required to adequately fund the pool until the next
Financial Report for the Month of SEPTEMBER
 WILLOUGHBY, OH Financial Report for the Month of SEPTEMBER Month Ended SEPTEMBER 30, 2013 BOARD OF EDUCATION Mrs. Margaret Warner, President SUPERINTENDENT Mr. Steve Thompson Mrs. Sharon Scott, Vice President
MEDICAID FEDERAL SHARE OF MATCHING FUNDS
 MEDICAID FEDERAL SHARE OF MATCHING FUNDS revised by EDR based on FFIS Estimated for FFY 2019 August 3, 2017 Effective State Budget Year State adopted February 2017 State State FY real Difference in state
Singapore Exchange Limited Building Tomorrow s Market, Today
 Singapore Exchange Limited Building Tomorrow s Market, Today Singapore Exchange SGX: Building Tomorrow s Market, Today SGX: Our Fundamentals FY2002 Half Year Results Going Forward SGX: Building Tomorrow
Security Analysis: Performance
 Security Analysis: Performance Independent Variable: 1 Yr. Mean ROR: 8.72% STD: 16.76% Time Horizon: 2/1993-6/2003 Holding Period: 12 months Risk-free ROR: 1.53% Ticker Name Beta Alpha Correlation Sharpe
SUMMARY OF OPERATING RESULTS DECEMBER UWHC Finance Committee & Authority Board
 SUMMARY OF OPERATING RESULTS DECEMBER 20 UWHC Finance Committee & Authority Board Adult Admissions,679,263,263 2,039 1,932 1,929 December 20 2014 YTD 2 Pediatrics Admissions 1,781 1,799 1,776 257 280 274
PETERS TOWNSHIP SANITARY AUTHORITY 2011 BUDGET WORKSHOP. November 30, 2010
 PETERS TOWNSHIP SANITARY AUTHORITY 2011 BUDGET WORKSHOP November 30, 2010 Agenda A. 2010 Budget Performance Summary B. 2011 Budget Request C. 2011 Capital Plan D. Consulting Engineer s Annual Report Preliminary
Sedona Fire District. Monthly Financial Report. Monthly Financial Report September Attached are the following for your information and review:
 Sedona Fire District Monthly Financial Report Monthly Financial Report September 2018 Attached are the following for your information and review: 1. Sheet as of September 30, 2018. 2. Summary of Reconciled
THE B E A CH TO WN S O F P ALM B EA CH
 THE B E A CH TO WN S O F P ALM B EA CH C OU N T Y F LO R I D A August www.luxuryhomemarketing.com PALM BEACH TOWNS SINGLE-FAMILY HOMES LUXURY INVENTORY VS. SALES JULY Sales Luxury Benchmark Price : 7,
City of Joliet 2014 Revenue Review. October 2013
 City of Joliet 2014 Revenue Review October 2013 General Fund 2014 Est. Revenues = $163.6 M Licenses, Permits, Fees Gaming Taxes 5% 12% Sales Taxes 27% Income Taxes 9% Charges for Services 14% Other Taxes
Management Comments. February 12, 2015
 Management Comments February 12, 2015 Average Bill, Not Average Cost of Service Court Rich: according to this Exhibit 6, 62.4 percent of the people in E-23 are paying less than the average cost of service,
Anaheim s Portfolio Balances
 Impact on Cash Management and Investment Strategies Henry Stern, CTP City Treasurer City of Anaheim C.M.T.A. San Diego April 21, 2011 Elements of a Portfolio Management Program Investment Policy Return