Management Comments. February 12, 2015
|
|
|
- Erik Bond
- 6 years ago
- Views:
Transcription
1 Management Comments February 12, 2015
2 Average Bill, Not Average Cost of Service Court Rich: according to this Exhibit 6, 62.4 percent of the people in E-23 are paying less than the average cost of service, correct? Aidan McSheffrey: Well, again, it s the average cost of service for the average customer, not the average cost of service for the stratum 1 through 4 customers you mentioned. January 15, 2015 Interview Transcript page 73 2
3 Current Rate of Return by Stratum Stratum Avg. Monthly Summer Kwh Current Rate of Return % % % % % % Overall 2.7% 3


4 Typical Solar Customer Average Monthly Demand and Energy 1,545 kwh 8.9 kw 8.5 kw 491 kwh Energy Before Solar After Solar Demand 4

 Stratum 5")
5 Current Solar Customers Compared to Each Residential Stratum Delivered by SRP (July) On Peak - Summer Stratum 1 Stratum 2 Stratum 3 Stratum :00 AM 1:00 AM 2:00 AM 3:00 AM 4:00 AM 5:00 AM 6:00 AM 7:00 AM 8:00 AM 9:00 AM 10:00 AM 11:00 AM 12:00 PM 1:00 PM 2:00 PM 3:00 PM 4:00 PM 5:00 PM 6:00 PM 7:00 PM 8:00 PM 9:00 PM 10:00 PM 11:00 PM Demand (kw) Stratum 5 Stratum 6 Average Solar On-Peak Hours 5
6 Monthly Averages Average Month kwh On-Peak kw Stratum Stratum Stratum Stratum 4 1, Stratum 5 1, Stratum 6 2, Typical Solar Customer Non-Solar 6


7 How Solar Affects SRP s System 4CP Allocator Source: SRP _CommentsInquiriesResponses_PriceProcess.pdf (page 224 and many others of 651) 7

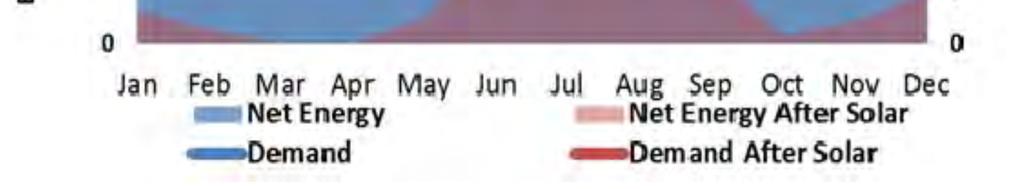
8 How Solar Affects SRP s System -Energy Energy (kwh) 3,500 3,000 2,500 2,000 1,500 1, Typical Solar Customer Monthly Energy Jan Feb Mar Apr May Jun Jul Aug Sep Oct Nov Dec Net Energy Net Energy After Solar 8
9 How Solar Affects SRP s System -Demand Typical Solar Customer Monthly Demand Demand (kw) Jan Feb Mar Apr May Jun Jul Aug Sep Oct Nov Dec Demand Demand After Solar 9
10 Typical Solar Customer Average Monthly Demand and Energy 1,545 kwh 8.9 kw 8.5 kw 491 kwh Energy Before Solar After Solar Demand 10
11 18% 16% Rooftop Solar On A Clear Day Normalized Data from September System Peak Hour 14% 12% 10% 8% 6% 4% 2% 0% Percent of Total Generation 1 AM 2 AM 3 AM 4 AM 5 AM 6 AM 7 AM 8 AM 9 AM 10 AM 11 AM 12 PM 1 PM 2 PM 3 PM 4 PM 5 PM 6 PM 7 PM 8 PM 9 PM 10 PM 11 PM 12 AM Time of Day 11
12 15-Minute vs. 30-Minute Demand Instantaneous peak is what we build for and are obligated to serve. The cost of meeting this obligation doesn t change irrespective of how measured. Measuring over a wider period of time will yield a lower measured peak demand. Thus, demand charges go up with a wider measurement period. 12
13 E-27 Design Comparison E-27 Proposed (Bluebook) 15 min On-Pk Demand E-27 Alternate 30 min On-Pk Demand Amp Svc MSC Amp Svc Season On-Peak Demand ($/kw) First 3 kw Next 7 kw All Add'l kw Energy ($/kwh) On-Peak Off-Peak Summer Peak $8.10 $15.05 $28.93 $ $ $32.44 $45.44 Summer $6.61 $12.07 $22.98 $ $ Winter $2.87 $4.57 $7.91 $ $ Summer Peak $9.59 $17.82 $34.19 $ $ $32.44 $45.44 Summer $8.03 $14.63 $27.77 $ $ Winter $3.55 $5.68 $9.74 $ $
14 We can do either one 14
15 Grandfathering Discussion 15
16 Normal Gradualism 100% 80% 60% 40% 20% 0% Apr 2015 Apr 2016 Apr 2017 Apr 2018 Apr 2019 Apr 2020 Apr 2021 Apr 2022 Apr 2023 Apr 2024 Apr
17 SRP Residential Solar Customer Growth and Upfront Renewable Energy Credit Payment (August 2004 December 2014) Upfront REC Payment / Per Watt $4.00 $3.50 $3.00 $2.50 $2.00 $1.50 $1.00 $ ,000 Number of Residential Solar Customers 18,000 16,000 14,000 12,000 10,000 8,000 6,000 4,000 2,000 $0.00 FY04 FY05 FY06 FY07 FY08 FY09 FY10 FY11 FY12 FY13 FY14 FY15 0 Average Solar Upfront REC Payment Residential Solar Customers End of SRP Upfront REC Payment 17
18 Payments for REC Agreement Residential Commercial Paid to Customers $36.7 M $37.2 M Paid to Vendors $14.6 M $47.9 M Total $51.3 M $85.1 M Note: Does not include approximately $14M in solar heating payments 18
19 Residential Solar Customers Type Category A: REC agreement paid to customers (customers who own their system, commissioned and in process) Category B: REC agreement paid to vendors (customers who leased their system) Category C: No REC agreement (End of incentives - Sept 6 November 28 ) Category D: No REC agreement (Post Announcement Nov. 29 Dec. 8) # of Customers 4,304 7,310 1,766 2,063 19
20 Grandfathering Costs Type 10 Year Cost Each Add'l Year Category A: REC agreement paid to customers $25M $3M Category B: REC agreement paid to vendors $43M $4M Category C: No REC agreement (End of incentives - Sept 6 November 28 ) $10M $1M Category D: No REC agreement (Post Announcement Nov. 29 Dec. 8) $12M $1M $90M $9M These are estimates only. They can and will change as prices may be changed by SRP s Board over time. 20
21 Conceptual Option for 10 Year Grandfathering (Multi Category) Pay 3 cents/kwh generated in year 11, 2 cents/kwh in year 12, 1 cent/kwh in year 13 Total cost $8.4 million Phases in move to E-27 $20/month impact in first year $10/month incremental impact in years 2, 3, 4 21
22 Combined Net Revenues FY2016 ($ Millions) Zero Price Increase 3.9% Price Increase Total Operating Revenues $3,200 $3,309 Operating Expenses Purchased Power/Fuel/Water for Power $1,252 $1,252 Operating Expenses & Maintenance $1,112 $1,112 Depreciation and Amortization $535 $535 Taxes and Tax Equivalents $167 $167 Total Operating Expenses $3,066 $3,066 Net Operating Revenues $134 $243 Plus Other Income $5 $5 Less Net Financing Costs $185 $182 Combined Net Revenue ($46) $66 22
23 Cost Allocation Question 23
24 AECC Recommended Price Change 5.0% 4.0% 3.0% 2.0% 1.0% 0.0% -1.0% -2.0% Residential (Average) Commercial Industrial E-65 SRP Management Proposal AECC Proposal 24

25 SRP Prices Remain Competitive Overall Price (Cents per kwh) Source: Dept. of Energy EIA-826 Reports for 12 months ending July 31, 2014 *Data for Arizona does not include SRP. 25

26 SRP Prices Remain Competitive Industrial Price (Cents per kwh) SO. CALIFORNIA NEVADA ARIZONA* NEW MEXICO SRP (Proposed) SRP (EIA) Source: Dept. of Energy EIA-826 Reports for 12 months ending November 30, *Data for Arizona does not include SRP. Note: APS AG-1 and SRP s FESR are limited alternatives 26
27 Would Dr. Chamberlin prefer a cost recovery shift from summer to winter or vice versa, and why? 27
28 28
Power Accountants Association Annual Meeting Potential Impacts from Oct 2015 Rate Change
 Power Accountants Association Annual Meeting Potential Impacts from Oct 2015 Rate Change Material Provided by: Chris Mitchell Chris Mitchell Management Consultants (CMMC) mail@chrismitchellmc.com 5/14/2015
WESTERN MASSACHUSETTS
 Page 1 of 5 PART A - TOTAL DELIVERY RATES (1) Reconciling Rates = Sum of Part B Rates MDPU Service Rate Base Reconciling Total Revenue Energy Efficiency Charge (EEC) Renewable Total Schedule No. Area Component
Business & Financial Services December 2017
 Business & Financial Services December 217 Completed Procurement Transactions by Month 2 4 175 15 125 1 75 5 2 1 Business Days to Complete 25 Jan Feb Mar Apr May Jun Jul Aug Sep Oct Nov Dec 217 Procurement
XML Publisher Balance Sheet Vision Operations (USA) Feb-02
 Feb-02") Page:1 Apr-01 May-01 Jun-01 Jul-01 ASSETS Current Assets Cash and Short Term Investments 15,862,304 51,998,607 9,198,226 Accounts Receivable - Net of Allowance 2,560,786
Page:1 Apr-01 May-01 Jun-01 Jul-01 ASSETS Current Assets Cash and Short Term Investments 15,862,304 51,998,607 9,198,226 Accounts Receivable - Net of Allowance 2,560,786
Executive Summary. July 17, 2015
 Executive Summary July 17, 2015 The Revenue Estimating Conference adopted interest rates for use in the state budgeting process. The adopted interest rates take into consideration current benchmark rates
Large Commercial Rate Simplification
 Large Commercial Rate Simplification Presented to: Key Account Luncheon Red Lion Hotel Presented by: Mark Haddad Assistant Director/CFO October 19, 2017 Most Important Information First There is no rate
FOR RELEASE: MONDAY, MARCH 21 AT 4 PM
 Interviews with 1,012 adult Americans conducted by telephone by Opinion Research Corporation on March 18-20, 2011. The margin of sampling error for results based on the total sample is plus or minus 3
Spheria Australian Smaller Companies Fund
 29-Jun-18 $ 2.7686 $ 2.7603 $ 2.7520 28-Jun-18 $ 2.7764 $ 2.7681 $ 2.7598 27-Jun-18 $ 2.7804 $ 2.7721 $ 2.7638 26-Jun-18 $ 2.7857 $ 2.7774 $ 2.7690 25-Jun-18 $ 2.7931 $ 2.7848 $ 2.7764 22-Jun-18 $ 2.7771
Last change 1/1/19 1/1/19 1/1/19 1/1/19 1/1/19 1/1/19 1/1/19 3/1/98 7/1/18 7/1/18 1/1/03 1/1/19
 Page 1 of 5 PART A - TOTAL DELIVERY RATES (1) Reconciling Rates = Sum of Part B Rates MDPU Service Rate Base Reconciling Total Revenue Distributed Energy Efficiency Charge (EEC) Renewable Total Schedule
Historical Pricing PJM COMED, Around the Clock. Cal '15 Cal '16 Cal '17 Cal '18 Cal '19 Cal '20 Cal '21 Cal '22
 $50 Historical Pricing PJM COMED, Around the Clock $48 $46 $44 $42 $40 $38 $36 $34 $32 $30 $28 $26 Cal '15 Cal '16 Cal '17 Cal '18 Cal '19 Cal '20 Cal '21 Cal '22 The information presented above was gathered
Historical Pricing PJM PSEG, Around the Clock. Cal '15 Cal '16 Cal '17 Cal '18 Cal '19 Cal '20 Cal '21 Cal '22
 $70 Historical Pricing PJM PSEG, Around the Clock $65 $60 $55 $50 $45 $40 $35 $30 $25 Cal '15 Cal '16 Cal '17 Cal '18 Cal '19 Cal '20 Cal '21 Cal '22 The information presented above was gathered and compiled
NSTAR ELECTRIC COMPANY d/b/a EVERSOURCE ENERGY SUMMARY OF ELECTRIC SERVICE DELIVERY RATES. M.D.P.U. No E Page 1 of 10
 Page 1 of 10 No. Code Area Component Distribution Rate Adjust (1) Distribution Decoupling Transition Transmission (2) System Benefits Recon. Total EEC Energy Delivery R-1 7 A1/A5 ALL Customer $7.00 $7.00
FDD FIRM STORAGE SERVICE NORTHERN NATURAL GAS COMPANY
 FDD FIRM STORAGE SERVICE NORTHERN NATURAL GAS COMPANY FIRM STORAGE SERVICE OPTIONS Northern s firm storage service is provided pursuant to the FDD Rate Schedule located in Northern s FERC Gas Tariff. The
Financial & Business Highlights For the Year Ended June 30, 2017
 Financial & Business Highlights For the Year Ended June, 17 17 16 15 14 13 12 Profit and Loss Account Operating Revenue 858 590 648 415 172 174 Investment gains net 5 162 909 825 322 516 Other 262 146
Big Walnut Local School District
 Big Walnut Local School District Monthly Financial Report for the month ended September 30, 2013 Prepared By: Felicia Drummey Treasurer BIG WALNUT LOCAL SCHOOL DISTRICT SUMMARY OF YEAR TO DATE FINANCIAL
HUD NSP-1 Reporting Apr 2010 Grantee Report - New Mexico State Program
 HUD NSP-1 Reporting Apr 2010 Grantee Report - State Program State Program NSP-1 Grant Amount is $19,600,000 $9,355,381 (47.7%) has been committed $4,010,874 (20.5%) has been expended Grant Number HUD Region
(Internet version) Financial & Statistical Report November 2018
 Financial & Statistical Report November 2018") (Internet version) Financial & Statistical Report November 2018 12/17/2018 Statement of Operations For the Period Ended November 30, 2018 (in millions) Current Month Year-to-Date Operating Revenue $ 31.4
(Internet version) Financial & Statistical Report November 2018 12/17/2018 Statement of Operations For the Period Ended November 30, 2018 (in millions) Current Month Year-to-Date Operating Revenue $ 31.4
Performance Report October 2018
 Structured Investments Indicative Report October 2018 This report illustrates the indicative performance of all Structured Investment Strategies from inception to 31 October 2018 Matured Investment Strategies
NSTAR ELECTRIC COMPANY d/b/a EVERSOURCE ENERGY SUMMARY OF ELECTRIC SERVICE DELIVERY RATES. M.D.P.U. No C Page 1 of 10
 Page 1 of 10 No. Code Area Component Distribution Rate Adjust (1) Distribution Decoupling Transition Transmission (2) System Benefits Recon. Total EEC Energy Delivery R-1 7 A1/A5 ALL Customer $7.00 $7.00
Common stock prices 1. New York Stock Exchange indexes (Dec. 31,1965=50)2. Transportation. Utility 3. Finance
2. Transportation. Utility 3. Finance") Digitized for FRASER http://fraser.stlouisfed.org/ Federal Reserve Bank of St. Louis 000 97 98 99 I90 9 9 9 9 9 9 97 98 99 970 97 97 ""..".'..'.."... 97 97 97 97 977 978 979 980 98 98 98 98 98 98 987 988
Digitized for FRASER http://fraser.stlouisfed.org/ Federal Reserve Bank of St. Louis 000 97 98 99 I90 9 9 9 9 9 9 97 98 99 970 97 97 ""..".'..'.."... 97 97 97 97 977 978 979 980 98 98 98 98 98 98 987 988
WESTWOOD LUTHERAN CHURCH Summary Financial Statement YEAR TO DATE - February 28, Over(Under) Budget WECC Fund Actual Budget
 Budget WECC Fund Actual Budget") WESTWOOD LUTHERAN CHURCH Summary Financial Statement YEAR TO DATE - February 28, 2018 General Fund Actual A B C D E F WECC Fund Actual Revenue Revenue - Faith Giving 1 $ 213 $ 234 $ (22) - Tuition $ 226
WESTWOOD LUTHERAN CHURCH Summary Financial Statement YEAR TO DATE - February 28, 2018 General Fund Actual A B C D E F WECC Fund Actual Revenue Revenue - Faith Giving 1 $ 213 $ 234 $ (22) - Tuition $ 226
(Internet version) Financial & Statistical Report September 2017
 Financial & Statistical Report September 2017") (Internet version) Financial & Statistical Report September 2017 10/23/2017 Statement of Operations For the Period Ended September 30, 2017 (in millions) Current Month Year-to-Date Operating Revenue &
(Internet version) Financial & Statistical Report September 2017 10/23/2017 Statement of Operations For the Period Ended September 30, 2017 (in millions) Current Month Year-to-Date Operating Revenue &
(Internet version) Financial & Statistical Report December 2017
 Financial & Statistical Report December 2017") (Internet version) Financial & Statistical Report December 2017 01/22/2018 Statement of Operations For the Period Ended December 31, 2017 (in millions) Current Month Year-to-Date Operating Revenue & Patronage
(Internet version) Financial & Statistical Report December 2017 01/22/2018 Statement of Operations For the Period Ended December 31, 2017 (in millions) Current Month Year-to-Date Operating Revenue & Patronage
(Internet version) Financial & Statistical Report December 2016
 Financial & Statistical Report December 2016") (Internet version) Financial & Statistical Report December 2016 1/23/2017 Statement of Operations For the Period Ended December 31, 2016 (in millions) Current Month Year-to-Date Operating Revenue & Patronage
(Internet version) Financial & Statistical Report December 2016 1/23/2017 Statement of Operations For the Period Ended December 31, 2016 (in millions) Current Month Year-to-Date Operating Revenue & Patronage
Big Walnut Local School District
 Big Walnut Local School District Monthly Financial Report for the month ended September 30, 2012 Prepared By: Felicia Drummey Treasurer BIG WALNUT LOCAL SCHOOL DISTRICT SUMMARY OF YEAR-TO-DATE FINANCIAL
Division of Bond Finance Interest Rate Calculations. Revenue Estimating Conference Interest Rates Used for Appropriations, including PECO Bond Rates
 Division of Bond Finance Interest Rate Calculations Revenue Estimating Conference Interest Rates Used for Appropriations, including PECO Bond Rates November 16, 2018 Division of Bond Finance Calculation
Southern California Gas Company. and. San Diego Gas & Electric Company. Pipeline Safety Reliability Project. Application (A.
 Southern California Gas Company and San Diego Gas & Electric Company Pipeline Safety Reliability Project Application (A.) 15-09-013 September 30, 2015 Workpapers to the Prepared Direct Testimony of Jason
NSTAR ELECTRIC COMPANY d/b/a EVERSOURCE ENERGY SUMMARY OF ELECTRIC SERVICE DELIVERY RATES. M.D.P.U. No C Page 1 of 9
 Page 1 of 9 R-1 7 A1/A5 ALL Customer $7.00 $7.00 $7.00 Residential 01/48 Energy (kwh) $0.04563 $0.01833 $0.06396 ($0.00057) $0.00088 ($0.00052) $0.02585 $0.00250 $0.01475 $0.01725 $0.00050 $0.10735 32/66/68
Monthly Financial Report
 AGENDA ITEM NO: 4.C.1 Monthly Financial Report with data through February 2019 (Unaudited) The data contained in this report has not been independently audited. Alameda Municipal Power Financial Report
Review of Registered Charites Compliance Rates with Annual Reporting Requirements 2016
 Review of Registered Charites Compliance Rates with Annual Reporting Requirements 2016 October 2017 The Charities Regulator, in accordance with the provisions of section 14 of the Charities Act 2009, carried
Economic Activity Index ( GDB-EAI ) For the month of May 2013 G O V E R N M E N T D E V E L O P M E N T B A N K F O R P U E R T O R I C O
 For the month of May 2013 G O V E R N M E N T D E V E L O P M E N T B A N K F O R P U E R T O R I C O") Economic Activity Index ( GDB-EAI ) For the month of May 2013 General Commentary May 2013 GDB-EAI for the month of May registered a 3.4% year-over-year ( YOY ) reduction May 2013 EAI was 126.7, a 3.4%
Economic Activity Index ( GDB-EAI ) For the month of May 2013 General Commentary May 2013 GDB-EAI for the month of May registered a 3.4% year-over-year ( YOY ) reduction May 2013 EAI was 126.7, a 3.4%
OTHER DEPOSITS FINANCIAL INSTITUTIONS DEPOSIT BARKAT SAVING ACCOUNT
 WEIGHTAGES JAN FEB MAR APR MAY JUN JUL AUG SEPT OCT NOV DEC ANNOUNCEMENT DATE 19.Dez.14 27.Jän.15 24.Feb.15 26.Mär.15 27.Apr.15 26.Mai.15 25.Jun.15 28.Jul.15 26.Aug.15 23.Sep.15 27.Okt.15 25.Nov.15 MUDARIB
QUESTION 2. QUESTION 3 Which one of the following is most indicative of a flexible short-term financial policy?
 QUESTION 1 Compute the cash cycle based on the following information: Average Collection Period = 47 Accounts Payable Period = 40 Average Age of Inventory = 55 QUESTION 2 Jan 41,700 July 39,182 Feb 18,921
Fiscal Year 2018 Project 1 Annual Budget
 Fiscal Year 2018 Project 1 Annual Budget Table of Contents Table Page Summary 3 Summary of Costs Table 1 4 Treasury Related Expenses Table 2 5 Summary of Full Time Equivalent Table 3 6 Positions Cost-to-Cash
Release date: 12 July 2018
 Release date: 12 July 218 UK Finance: Mortgage Trends Update May 218 Mortgage market sees pre-summer boost as remortgaging continues strong upward trend Key data highlights: There were 32,2 new first-time
Memorandum. This memorandum does not require Board action. EXECUTIVE SUMMARY
 California Independent System Operator Corporation Memorandum To: ISO Board of Governors From: Eric Hildebrandt, Executive Director, Market Monitoring Date: November 7, 2018 Re: Department of Market Monitoring
Review of Membership Developments
 RIPE Network Coordination Centre Review of Membership Developments 7 October 2009/ GM / Lisbon http://www.ripe.net 1 Applications development RIPE Network Coordination Centre 140 120 100 80 60 2007 2008
ONTARIO ENERGY REPORT Q3 2018
 ONTARIO ENERGY REPORT Q3 JULY SEPTEMBER OIL AND NATURAL GAS Regular Gasoline and Diesel Provincial Retail Prices ($/L) Regular Gasoline $1.3 Diesel $1.9 Source: Ministry of Energy, Northern Development
June 2018 MLS Statistical Report
 Jan Feb Mar Apr May Jun Jul Aug Sep Oct Nov Dec June 218 MLS Statistical Report Total Sales The Month to Month Unit Sales graph shows that sales have started their seasonal decline. For the year, residential
Monthly Financial Report
 AGENDA ITEM NO: 4.C.1 Monthly Financial Report with data through October 2017 (Unaudited) The data contained in this report has not been independently audited. Alameda Municipal Power Financial Report
Status of the Unemployment Trust Fund and Related Issues. Commission on Unemployment Compensation. Ellen Marie Hess, Commissioner.
 Status of the Unemployment Trust Fund and Related Issues Commission on Unemployment Compensation August 8, 2018 Ellen Marie Hess, Commissioner 2 Trust Fund Data Standard Forecast (Millions of Dollars)
ATLANTIC CITY ELECTRIC COMPANY BPU NJ
 Attachment 1 Attachment 1 Page 1 of 3 ATLANTIC CITY ELECTRIC COMPANY BPU NJ No. 11 Electric Service - Section IV Revised Sheet Replaces Revised Sheet No. 60 RIDER (BGS) Basic Generation Service (BGS) Basic
City of Modesto Economic Indicators December 2014 Edition
 City of Modesto Economic Indicators December 2014 Edition Steve Christensen City of Modesto Economic Outlook: City of Modesto The City of Modesto continues to slowly recover from the Great Recession. Some
Docket No. DE Dated: 06/16/2017 Attachment CJG-1 Page 1
 Docket No. DE 16-8 Dated: 06/16/017 Attachment CJG-1 Page 1 1 3 4 6 7 8 9 Summary of Forecasted Energy Service 10 Cost For January 017 through December 017 TOTAL COST Cents per KWH Reference 11 1 Fossil
The Financial Reporting Checklists Every Firm should be Doing
 The Financial Reporting Checklists Every Firm should be Doing Presented by Rebecca Kelley, CPA Maggie Kennedy, CPA FM34 4/5/2017 3:00 PM - 4:15 PM The handouts and presentations attached are copyright
Using projections to manage your programs
 Using projections to manage your programs To project total provider reimbursements To do what ifs based on caseloads or other metrics To project amounts of admin & support available for spending Based
Natural Gas Avoided Cost Meeting. 10 a.m. 12 p.m. May 12, 2017
 Natural Gas Avoided Cost Meeting 10 a.m. 12 p.m. May 12, 2017 Agenda Introduction OPUC Energy Trust Schedule for updates Overview of Process to Update Avoided Costs Proposed Updates for 2017 Possible Future
Japan Securities Finance Co.,Ltd
 Japan Securities Finance Co.,Ltd \ mil ( )ratio of OR Mar-13 Mar-14 Securities Finance Bussiness 14,093 16,363 Margin Loan Business 6,625 9,240 (37.5%) (47.2%) Interest on Loans 1,760 4,012 Interest
Docket No. DE Dated: 12/09/2016 Attachment CJG-1 Page 1
 Docket No. DE 1-8 Dated: 1/09/01 Attachment CJG-1 Page 1 1 01 ENERGY SERVICE RATE CALCULATION 8 9 Summary of Forecasted Energy Service 10 Cost For January 01 Through December 01 TOTAL COST Cents per KWH
TERMS OF REFERENCE FOR THE INVESTMENT COMMITTEE
 I. PURPOSE The purpose of the Investment Committee (the Committee ) is to recommend to the Board the investment policy, including the asset mix policy and the appropriate benchmark for both ICBC and any
March 2019 ARP Rate Call Package
 March 219 ARP Rate Call Package FMPA Executive Committee April 9, 219 March 219 Key Discussion Items ARP avg. gas cost for February was $2.67/MMBtu (~8% below budget). Current forward curve is $.12/MMBtu
Docket No. DE Dated: 05/09/2016 Attachment CJG-1 Page 1
 Docket No. DE 1-1 Dated: 0/09/01 Attachment CJG-1 Page 1 1 8 9 Summary of Forecasted Energy Service 10 Cost For January 01 Through December 01 TOTAL COST Cents per KWH Reference 11 1 Fossil energy costs
11 May Report.xls Office of Budget & Fiscal Planning
 Education and General Fund Actual Revenues and s by Month MTD YTD Change Revenue Jul Aug Sep Oct Nov Dec Jan Feb Mar Apr May Jun Per 14 Total over FY06 Enrollment Fees $ 8,211 $ 219 $ 41,952 ($ 818) $
Regional overview Gisborne
 Regional overview Purchasing intentions - additional income-related rent subsidy (IRRS) places Area District 1 2 3 4+ TOTAL 3 35 5 7 total 3 35 5 7 7 8 9 1 11 Purchasing intentions - change within the
Proposed Direction to Bord Gáis Energy Supply regarding the application of the Regulated Tariff Formula
 Proposed Direction to Bord Gáis Energy Supply regarding the application of the Regulated Tariff Formula CER/04/089 1. Introduction The Regulated Tariff Formula ( RTF ) took effect on 1 April 2003 for gas
Buad 195 Chapter 4 Example Solutions, Pre-Midterm Page 1 of 9
 Buad 195 Chapter 4 Example Solutions, Pre-Midterm Page 1 of 9 Example 1 4-5 page 116 Ross Pro s Sports Equipment + Projected sales... 4,800 units + Desired ending inventory... 480 (10% 4,800) Beginning
SmallBizU WORKSHEET 1: REQUIRED START-UP FUNDS. Online elearning Classroom. Item Required Amount ($) Fixed Assets. 1 -Buildings $ 2 -Land $
 Fixed Assets. 1 -Buildings $ 2 -Land $") WORKSHEET 1: REQUIRED START-UP FUNDS Item Required Amount () Fixed Assets 1 -Buildings 2 -Land 3 -Initial Inventory 4 -Equipment 5 -Furniture and Fixtures 6 -Vehicles 7 Total Fixed Assets Working Capital
WORKSHEET 1: REQUIRED START-UP FUNDS Item Required Amount () Fixed Assets 1 -Buildings 2 -Land 3 -Initial Inventory 4 -Equipment 5 -Furniture and Fixtures 6 -Vehicles 7 Total Fixed Assets Working Capital
Cost Estimation of a Manufacturing Company
 Cost Estimation of a Manufacturing Company Name: Business: Date: Economics of One Unit: Manufacturing Company (Only complete if you are making a product, such as a bracelet or beauty product) Economics
Washington Gas Light Company Utility Rate Requests District of Columbia Formal Case No Decision May 15, 2013
 Washington Gas Light Company Utility Rate Requests District of Columbia Formal Case No. 1093 Decision May 15, 2013 July 25, 2013 Update to AOBA Utility Committee Meeting 1 Formal Case No. 1093 Base Rate
U.S. Natural Gas Storage Charts
 U.S. Natural Gas Storage Charts BMO Capital Markets Commodity Products Group November 26, 214 Total U.S. Natural Gas in Storage 5, Total Stocks This Week 3432 4, 3, 2, 1, Reported On: November 26, 214
1Q of FY ending December 31, (0.2) (1.9) 11.3 (0.2) (0.2) (0.2) (0.2) (1.2) (89.2) 0.1
 (1.9) 11.3 (0.2) (0.2) (0.2) (0.2) (1.2) (89.2) 0.1") August 6, ISEKI & CO., LTD. Supplementary Information to Consolidated Financial Results (April 1, June 30, ) I. Consolidated business results for the three months ended June 30, (Billions of yen, %) Year-on
August 6, ISEKI & CO., LTD. Supplementary Information to Consolidated Financial Results (April 1, June 30, ) I. Consolidated business results for the three months ended June 30, (Billions of yen, %) Year-on
SCE Rate Outlook. Akbar Jazayeri Vice President of Regulatory Operations CMTA Meeting July 24, 2008
 SCE Rate Outlook Akbar Jazayeri Vice President of Regulatory Operations CMTA Meeting July 24, 2008 2008 Revenue Requirement By Function TOTAL SYSTEM BUNDLED SERVICE Rate Component $millions % $millions
PRESS RELEASE. Securities issued by Hungarian residents and breakdown by holding sectors. January 2019
 7 March 2019 PRESS RELEASE Securities issued by Hungarian residents and breakdown by holding sectors January 2019 According to securities statistics, the amount outstanding of equity securities and debt
Docket No. DE Dated: 09/28/2015 Attachment CJG-1 Page 1
 Docket No. DE 1-1 Dated: 09/8/01 Attachment CJG-1 Page 1 1 01 ENERGY SERVICE RATE CALCULATION (Dollars in 000s) 8 9 Summary of Forecasted Energy Service 10 Cost For January 01 Through December 01 TOTAL
Regional overview Hawke's Bay
 Regional overview Purchasing intentions - additional income-related rent subsidy (IRRS) places Area Hastings Central 1 2 3 4+ TOTAL 5 5 25 125 3 3 1 7 total 8 8 35 195 7 8 9 1 11 Purchasing intentions
1.2 The purpose of the Finance Committee is to assist the Board in fulfilling its oversight responsibilities related to:
 Category: BOARD PROCESS Title: Terms of Reference for the Finance Committee Reference Number: AB-331 Last Approved: February 22, 2018 Last Reviewed: February 22, 2018 1. PURPOSE 1.1 Primary responsibility
PHOENIX ENERGY MARKETING CONSULTANTS INC. HISTORICAL NATURAL GAS & CRUDE OIL PRICES UPDATED TO July, 2018
 Jan-01 $12.9112 $10.4754 $9.7870 $1.5032 $29.2595 $275.39 $43.78 $159.32 $25.33 Feb-01 $10.4670 $7.8378 $6.9397 $1.5218 $29.6447 $279.78 $44.48 $165.68 $26.34 Mar-01 $7.6303 $7.3271 $5.0903 $1.5585 $27.2714
June Economic Activity Index ( GDB-EAI )
") June 2014 Economic Activity Index ( GDB-EAI ) General Commentary June 2014 In June 2014, the GDB-EAI registered a 1.0% year-over-year (y-o-y) reduction, after showing a 1.1% y-o-y decrease in June 2014.
June 2014 Economic Activity Index ( GDB-EAI ) General Commentary June 2014 In June 2014, the GDB-EAI registered a 1.0% year-over-year (y-o-y) reduction, after showing a 1.1% y-o-y decrease in June 2014.
Factor Leave Accruals. Accruing Vacation and Sick Leave
 Factor Leave Accruals Accruing Vacation and Sick Leave Factor Leave Accruals As part of the transition of non-exempt employees to biweekly pay, the UC Office of the President also requires standardization
SHARETHIS FINANCE STUDY
 SHARETHIS FINANCE STUDY EVERY MONTH, 32 MILLION USERS GENERATE 68 MILLION SOCIAL ACTIONS RELATED TO FINANCE. 32 Million Finance Sharers SHARETHIS SOCIAL INTELLIGENCE PLATFORM 53 Billion Webpage Views 3.1
Sales Tax Collection Report. For The Month Ending 03/31/14. February 2014 Sales
 Sales Tax Collection Report For The Month Ending 03/31/14 February 2014 Sales Report Prepared By The Sales Tax Department 1 Sales Tax Report Table of Contents Page 3 Sales Tax Recap of Gross Receipts Collected
2016 Spring Conference And Training Seminar. Cash Planning and Forecasting
 Cash Planning and Forecasting A different world! Cash forecasting starts with expectations about future flows Uses history to identify beginning balances.and to understand patterns of how things interact
SECOND QUARTER 2017 RESULTS. August 3, 2017
 SECOND QUARTER 2017 RESULTS August 3, 2017 FORWARD LOOKING STATEMENTS AND NON-GAAP FINANCIAL MEASURES This presentation contains forward-looking statements based on current expectations, including statements
SaskEnergy Commodity Rate 2011 Review and Natural Gas Market Update
 SaskEnergy Commodity Rate 2011 Review and Natural Gas Market Update The following is a discussion of how SaskEnergy sets its commodity rate, the status of the natural gas marketplace and the Corporation
Illinois Job Index Note: BLS revised its estimates for the number of jobs and seasonal adjustment method at the beginning of 2010.
 Illinois Job Index Release Data Issue 4/21/2010 Jan 1990 / Mar 2010 Note: BLS revised its estimates for the number of jobs and seasonal adjustment method at the beginning of 2010. For April Illinois Job
Voya Indexed Universal Life-Protector
 calculation examples Values as of 07/28/2018 Voya ed Universal Life-Protector Issued by Security Life of Denver Insurance Company Required training! VFA Registered Representatives must review the Required
LOUISVILLE GAS AND ELECTRIC COMPANY Gas Rates 2018 Monthly Billing Adjustments
 2018 Monthly Billing Adjustments GAS LINE TRACKER CHARGES GAS LINE TRACKER CHARGES DSM (2) PER MONTH PER METER PER MONTH PER CCF TAX CUTS AND JOBS ACT $ Per CCF Firm Trans. SURCREDIT ($ per ccf) (3) GAS
PRESS RELEASE. Securities issued by Hungarian residents and breakdown by holding sectors. October 2018
 PRESS RELEASE 10 December 2018 Securities issued by Hungarian residents and breakdown by holding sectors October 2018 According to securities statistics, the amount outstanding of equity securities and
MACRO Report: Review of Wyoming s Economy
 MACRO Report: Review of Wyoming s Economy Economic Update as of December 31, 2017 The MACRO Report is a quarterly publication comprised of charts focusing on energy, employment, state revenues, and other
Updates & Milestones re: Peak Demand Reduction. EEAC Consultants (with PA contributions) (Revised, 3/13/17)
 (Revised, 3/13/17)") Updates & Milestones re: Peak Demand Reduction EEAC Consultants (with PA contributions) (Revised, 3/13/17) Key Work Streams in 2016-2018 Following the Analytical Framework Cost-Effectiveness Framework
Updates & Milestones re: Peak Demand Reduction EEAC Consultants (with PA contributions) (Revised, 3/13/17) Key Work Streams in 2016-2018 Following the Analytical Framework Cost-Effectiveness Framework
December 10, Butler School District 53 1
 December 10, 2018 Butler School District 53 1 Key Terms Aggregate Levy annual corporate levy other than debt service Debt Service Levy made to retire the principal or pay interest on bonds Property Tax
ILL. C. C. No. 10 Commonwealth ELECTRICITY 2nd Revised Sheet No. 373 Edison Company (Canceling 1st Revised Sheet No. 373)
") Commonwealth ELECTRICITY 2nd Revised Sheet No. 373 Edison Company (Canceling 1st Revised Sheet No. 373) Applicable to Rates BES, BESH, and RDS APPLICABILITY. This rider is applicable to all retail customers
Commonwealth ELECTRICITY 2nd Revised Sheet No. 373 Edison Company (Canceling 1st Revised Sheet No. 373) Applicable to Rates BES, BESH, and RDS APPLICABILITY. This rider is applicable to all retail customers
HIPIOWA - IOWA COMPREHENSIVE HEALTH ASSOCIATION Unaudited Balance Sheet As of July 31
 Unaudited Balance Sheet As of July 31 Total Enrollment: 407 Assets: Cash $ 9,541,661 $ 1,237,950 Invested Cash 781,689 8,630,624 Premiums Receivable 16,445 299,134 Prepaid 32,930 34,403 Assessments Receivable
HIPIOWA - IOWA COMPREHENSIVE HEALTH ASSOCIATION Unaudited Balance Sheet As of January 31
 Unaudited Balance Sheet As of January 31 Total Enrollment: 371 Assets: Cash $ 1,408,868 $ 1,375,117 Invested Cash 4,664,286 4,136,167 Premiums Receivable 94,152 91,261 Prepaid 32,270 33,421 Assessments
Projections/Estimated - Unrestricted Cash / Board Designated Cash & Investments September 2017
 Projections/Estimated - Unrestricted Cash / Board Designated Cash & Investments September 2017 25.0 20.0 17.1 16.9 15.0 10.0 11.7 11.0 9.1 10.1 9.7 7.7 7.0 6.8 15.1 14.8 11.5 13.1 13.8 9.9 11.4 12.2 8.4
General Fund Revenue
 Millions Percent of Kathy Steinert, Director of Fiscal Services Phone: 541.923.8927 145 SE Salmon Ave Redmond, OR 97756 kathy.steinert@redmond.k12.or.us Date: May 23, 2014 To: Redmond School District Board
February Economic Activity Index ( GDB-EAI )
") February 2015 Economic Activity Index ( GDB-EAI ) General Commentary February 2015 In February 2015, the GDB-EAI registered a 1.6% year-over-year (y-o-y) reduction, and a month-over-month (m-o-m) increase
February 2015 Economic Activity Index ( GDB-EAI ) General Commentary February 2015 In February 2015, the GDB-EAI registered a 1.6% year-over-year (y-o-y) reduction, and a month-over-month (m-o-m) increase
Ch. 13 Practice Questions Solution
 Buad 121 Ch. 13 Practice Questions Solution Exercise 13-9 (20 minutes) a. Mar. 10 Machinery... 60,000 Cash... 60,000 Purchased machinery for cash. b. Mar. 10 Machinery... Accounts Payable... 60,000 60,000
Electric Avoided Cost Meeting. 1:30-3:30 p.m. May 12, 2017
 Electric Avoided Cost Meeting 1:30-3:30 p.m. May 12, 2017 Agenda Introduction OPUC Energy Trust Schedule for updates Overview of Process to Update Avoided Costs Proposed Updates for 2017 Possible Future
Mortgage Trends Update
 Mortgage Trends Update UK Finance: Mortgage Trends Update December 218 of first-time reaches 12-year high in 218 Key data highlights: There were 37, new first-time buyer mortgages completed in 218, some
Unrestricted Cash / Board Designated Cash & Investments December 2014
 Unrestricted Cash / Board Designated Cash & Investments December 2014 25.0 20.0 21.0 20.8 18.9 19.9 15.0 10.0 11.5 12.8 11.6 9.1 10.4 9.8 11.1 10.2 9.8 17.0 16.8 15.4 14.7 14.2 14.1 13.6 13.0 12.0 10.2
MEDICAID FEDERAL SHARE OF MATCHING FUNDS
 MEDICAID FEDERAL SHARE OF MATCHING FUNDS revised by EDR based on FFIS Estimated for FFY 2019 August 3, 2017 Effective State Budget Year State adopted February 2017 State State FY real Difference in state
Idaho Economic Development Funding Projects with Limited Options
 Economic Development Funding Projects with Limited Options Cameron Arial, Vice President ZIONS BANK Public Finance 208.501.7481 Cameron.Arial@zionsbank.com June 10, 2015 ZIONS is the #1Advisor to Cities
2018 Financial Management Classes
 2018 Financial Management Classes MONEY MANAGEMENT CLASS/BANKING OPERATONS (1ST & 3RD FRIDAY) INVESTING BASICS (2ND FRIDAY) CREDIT MANAGEMENT BLENDED RETIREMENT SYSTEM/THRIFT SAVINGS PLAN (4TH FRIDAY)
PRESS RELEASE. Securities issued by Hungarian residents and breakdown by holding sectors. October 2017
 11 December 2017 PRESS RELEASE Securities issued by Hungarian residents and breakdown by holding sectors October 2017 According to securities statistics, the amount outstanding of equity securities and
John Doe Main Street Summerville, SC (800) Sales Rep Name
 Sales Rep Name") John Doe 1442 Main Street Summerville, SC 29485 (800) 376-4115 johndoe@mysolaremail.com Sales Rep Name 12.22 kw Your Solar Loan Estimate Prepared for Doe $231.051 a month, for the next 20 years HOW THE
John Doe 1442 Main Street Summerville, SC 29485 (800) 376-4115 johndoe@mysolaremail.com Sales Rep Name 12.22 kw Your Solar Loan Estimate Prepared for Doe $231.051 a month, for the next 20 years HOW THE
THE B E A CH TO WN S O F P ALM B EA CH
 THE B E A CH TO WN S O F P ALM B EA CH C OU N T Y F LO R I D A August www.luxuryhomemarketing.com PALM BEACH TOWNS SINGLE-FAMILY HOMES LUXURY INVENTORY VS. SALES JULY Sales Luxury Benchmark Price : 7,
Financial Report for 3 rd Quarter of FY (April 2010 December 2010)
") Financial Report for 3 rd Quarter of FY2011.3 (April 2010 December 2010) January 2011 Osaka Gas Co., Ltd. 1 1 I. Business Results for 3 rd Quarter of FY2011.3 Management information is available on Osaka
Financial Report for 3 rd Quarter of FY2011.3 (April 2010 December 2010) January 2011 Osaka Gas Co., Ltd. 1 1 I. Business Results for 3 rd Quarter of FY2011.3 Management information is available on Osaka
Fall 2017 Crop Outlook Webinar
 Fall 2017 Crop Outlook Webinar Chris Hurt, Professor & Extension Ag. Economist James Mintert, Professor & Director, Center for Commercial Agriculture Fall 2017 Crop Outlook Webinar October 13, 2017 50%
ENSTAR Natural Gas Company 8/15/2014 Alaska Pipeline Company Gas Cost Adjustment Calculation 2014 Q4
 ENSTAR Natural Gas Company 8/15/2014 Alaska Pipeline Company Gas Cost Adjustment Calculation 2014 Q4 Contract Current Base Index Current Reimbursed Price Base Price Index Index Ratio Calculated Price Net