Water Loss Control in Effective Utility Management
|
|
|
- Beverly Walters
- 5 years ago
- Views:
Transcription


1 Water Loss Control in Effective Utility Management M. Steve Cavanaugh, Jr., PE Feb 22, 2017

2 Strategic Planning/Core Values include Relevant Goals and Objectives for NRW Management Be Financially Viable/Fiscally Prudent Optimize Financial Resources for Operational Support of Existing Assets from Source to Tap Provide Quality Service Prioritize Asset Management to Support Effective CIP Report Online, Near Real-Time KPIs via Dashboard to Support Management Decision Making Encourage Team Ownership Source: Arcadis
3 Quiz According to the AWWA M36 Water Audit Method, an acceptable level of Unaccounted For Water is: A. 15% B. 10% C. 5% D. 0%

4 Water Loss Control Drivers
5 Drought is Real January 19, 2016
6 Drought is Real February 16, 2016
7 Drought is Real March 22, 2016

8 Drought is Real April 26, 2016
9 Drought is Real May 24, 2016
10 Drought is Real June 28, 2016
11 Drought is Real July 26, 2016
12 Drought is Real August 23, 2016
13 Drought is Real Sept 27, 2016
14 Drought is Real October 27, 2016
15 Drought is Real Nov 22, 2016
16 Drought is Real Dec 20, 2016
17 Drought is Real Jan 24, 2017

18 Political Driver-Trust

19 Economic Driver
20 Economic Driver
 * final review, expected publication December")
21 Impact on Bond Ratings #48 Enterprise Risk Profile Assessment Factors (Table 10) * final review, expected publication December 2015

22 Regulatory Driver


23 States are moving very quickly
24 A little closer to home


25 33 States are reviewing their Water Loss Control reporting Requirements. Most are reconsidering failed % based performance targets


26 No water loss reporting Rudimentary water loss reporting AWWA M36 terminology & metrics AWWA M36 software AWWA M36 software with validation (Level 1) WA ME OR CA NV ID UT AZ MT WY CO NM ND SD NE KS OK MN WI IA IL MO AR MS IN MI TN KY AL OH GA WV SC VA NC NY NH CT RI PA DRBC NJ MD DE MA AK TX LA FL HI
27 Statewide Water Loss Management Program Model Implementation Phase 1 Establish Annual M36 Water Auditing Phase 2 Phase 3 Achieve Minimum Standard of Audit Reliability Manage Water Loss Performance for Long- Term Reduction Auditing Outreach Training & Tech Asst Establish annual M36 Water Auditing for all utilities Educate Regulatory Community on M36 Method and appropriate use of performance indicators Establish Statewide Water Loss Control Committee Develop State Manual and Training Framework Provide extended, progressive training to utilities (funded) Data Management Validation Certification Develop and implement data management system Establish posting system and communication protocols Establish minimum standards of validation for quality assurance Determine by Agency or 3 rd Party Establish validation program until certification program is in place Design and implement a Certified Water Audit program for sustained quality control Statewide Water Loss Control Committee provides support Benchmarking Improvement Suite of Performance and Process Measures System specific improvement over time in a cost-effective manner No universal targets Excessive thresholds established Annual audit submission threshold exceedances System specific progress review at designated regulatory touchpoints Statewide Water Loss Statewide Data Validity Year 1 Year 2 Year 3 Year 4 Year 5 Year 6 Year 7 Resource Management Grade C Resource Management Grade B Resource Management Grade A 27
28 Statewide Water Loss Management Program Model Implementation Phase 1 Establish Annual M36 Water Auditing Phase 2 Phase 3 Achieve Minimum Standard of Audit Reliability Manage Water Loss Performance for Long- Term Reduction Auditing Outreach Training & Tech Asst Establish annual M36 Water Auditing for all utilities Educate Regulatory Community on M36 Method and appropriate use of performance indicators Establish Statewide Water Loss Control Committee Develop State Manual and Training Framework Provide extended, progressive training to utilities (funded) Data Management Validation Certification Develop and implement data management system Establish posting system and communication protocols Establish minimum standards of validation for quality assurance Determine by Agency or 3 rd Party Establish validation program until certification program is in place Design and implement a Certified Water Audit program for sustained quality control Statewide Water Loss Control Committee provides support Benchmarking Improvement Suite of Performance and Process Measures System specific improvement over time in a cost-effective manner No universal targets Excessive thresholds established Annual audit submission threshold exceedances System specific progress review at designated regulatory touchpoints Statewide Water Loss Statewide Data Validity Year 1 Year 2 Year 3 Year 4 Year 5 Year 6 Year 7 Resource Management Grade C Resource Management Grade B Resource Management Grade A 28

29 Research Team:
30 VALIDATION LEVEL self-reported DEFINITION Water audits have not been validated Water audit accuracy/reliability is not well understood Validated water audits have been examined for errors evident in summary data and application of methodology The data validity grades assigned to inputs accurately reflect utility practices Validated water audits have been corroborated with investigations of raw data and archived reports of instrument accuracy The best sources of data to inform the water audit have been identified Validated water audits have been bolstered by field tests of instrument accuracy Minimum night flow analysis and/or pilot leak detection supplement the water audit
31 focus: GOALS: OUTCOMES: accurate assignment of data validity grades correct application of audit methodology confirm interpretation of methodology identify evident errors assign correct data validity grades correct data validity grades recommendations for higher-level validation activity LIMITATIONS: does not correct errors in raw data does not study instrument performance
32 Statewide Water Loss Management Program Model Implementation Phase 1 Establish Annual M36 Water Auditing Phase 2 Phase 3 Achieve Minimum Standard of Audit Reliability Manage Water Loss Performance for Long- Term Reduction Auditing Outreach Training & Tech Asst Establish annual M36 Water Auditing for all utilities Educate Regulatory Community on M36 Method and appropriate use of performance indicators Establish Statewide Water Loss Control Committee Develop State Manual and Training Framework Provide extended, progressive training to utilities (funded) Data Management Validation Certification Develop and implement data management system Establish posting system and communication protocols Establish minimum standards of validation for quality assurance Determine by Agency or 3 rd Party Establish validation program until certification program is in place Design and implement a Certified Water Audit program for sustained quality control Statewide Water Loss Control Committee provides support Benchmarking Improvement Suite of Performance and Process Measures System specific improvement over time in a cost-effective manner No universal targets Excessive thresholds established Annual audit submission threshold exceedances System specific progress review at designated regulatory touchpoints Statewide Water Loss Statewide Data Validity Year 1 Year 2 Year 3 Year 4 Year 5 Year 6 Year 7 Resource Management Grade C Resource Management Grade B Resource Management Grade A 32
33 Are We Healthy


34 Utah Pilot 20 systems, 6 months Colorado Pilot 50 systems, 3 months Wisconsin Pilot 6 systems, 6 months North & South Carolina Pilot 18 systems, 12 months California Full Scale 460 systems, 2 years New Mexico Full Scale 134 systems, 11 months Georgia Full Scale 230 systems, 5 years (and counting)
35 Part 2 Digging in Water Loss Control Industry Best Practices And Available Tools

 per year. WATER SUPPLIED: 89,011.2 million gallons (US) per year. AUTHORIZED CONSUMPTION. Billed metered:? M 57,535.2 million gallons (US) per year Billed unmetered:?")
 per year WATER LOSSES (Water Supplied - Authorized Consumption). 30,603.1 million gallons (US) per year. Apparent Losses. Unauthorized consumption:? E 1,145.")
 per year Real Losses. Real Losses (Water Losses - Apparent Losses):. 26,544.2 million gallons (US) per year.. WATER LOSSES:. 30,603.")

:? M $3.95 $/1000 gallons (US) Variable production cost (applied to real losses):? M $133.58 $/million gallons (US).")


: Infrastructure Leakage Index (ILI) [Real Losses/UARL]: * only the most")

: Water imported: All volumes to be entered as: MILLION GALLONS")


 Real Losses = Water Losses - Apparent Losses:? 0.000 MG/Yr WATER LOSSES: 0.")
36 AWWA M36 Methodology State of the Art Water Auditing & Loss Control AWWA WLCC Water Audit Software: Reporting Worksheet Copyright 2006, American Water Works Association. All Rights Reserved.? Click to access definition WATER SUPPLIED Water Audit Report for: Philadelphia Water Department Reporting Year: 2004 ALL VOLUMES TO BE ENTERED AS ANNUAL QUANTITIES Volume from own sources:? M 95,526.0 million gallons (US) per year Master meter error adjustment:? M under-registered million gallons (US) per year Water Imported:? M 0.0 million gallons (US) per year Water Exported:? M 7,210.2 million gallons (US) per year. WATER SUPPLIED: 89,011.2 million gallons (US) per year. AUTHORIZED CONSUMPTION. Billed metered:? M 57,535.2 million gallons (US) per year Billed unmetered:? M 0.0 million gallons (US) per year Unbilled metered:? M million gallons (US) per year Unbilled unmetered:? E million gallons (US) per year. AUTHORIZED CONSUMPTION:. 58,408.1 million gallons (US) per year WATER LOSSES (Water Supplied - Authorized Consumption). 30,603.1 million gallons (US) per year. Apparent Losses. Unauthorized consumption:? E 1,145.2 million gallons (US) per year Customer metering inaccuracies:? E million gallons (US) per year Data handling errors:? E 2,751.2 million gallons (US) per year Apparent Losses:. 4,058.9 million gallons (US) per year Real Losses. Real Losses (Water Losses - Apparent Losses):. 26,544.2 million gallons (US) per year.. WATER LOSSES:. 30,603.1 million gallons (US) per year NON_REVENUE WATER. NON-REVENUE WATER:. 31,476.0 million gallons (US) per year... SYSTEM DATA. Length of mains:? M 3,160.0 miles Number of active AND inactive service connections:? M 548,289 Connection density:. 174 conn./mile main Average length of private pipe:? E 12.0 ft (pipe length between curbstop. and customer meter or property Average operating pressure:? E 55.0 psi COST DATA. Total annual cost of operating water system:? M $167,604,000 $/Year Customer retail unit cost (applied to apparent losses):? M $3.95 $/1000 gallons (US) Variable production cost (applied to real losses):? M $ $/million gallons (US). DATA REVIEW - Please review the following information and make changes above if necessary: - Input values should be indicated as either measured or estimated. You have entered: 12 as measured values 6 as estimated values 0 without specifying measured or estimated - It is important to accurately measure the master meter - you have entered the measurement type as: measured - Cost Data: No problems identified PERFORMANCE INDICATORS Financial Indicators Operational Efficiency Indicators Non-revenue water as percent by volume: 35.4% Non-revenue water as percent by cost: 11.7% Annual cost of Apparent losses: $16,012,518 Annual cost of Real Losses: $3,545,768 Apparent losses per service connection per day: Real losses per service connection per day*: Real losses per length of main per day*: Real losses per service connection per day per psi pressure: Unavoidable Annual Real Losses (UARL): Infrastructure Leakage Index (ILI) [Real Losses/UARL]: * only the most applicable of these two indicators will be calculated N/A gallons/connection/day gallons/connection/day 2.41 gallons/connection/day/psi 5.98 million gallons/day Back to Instructions Please enter data in the white cells below. Where possible, metered values should be used; if metered values are unavailable please estimate a value. Indicate this by selecting a choice from the gray box to the left, where M = measured (or accurately known value) and E = estimated.?? Water Audit Report for: Reporting Year: WATER SUPPLIED Volume from own sources: Master meter error adjustment (enter positive value): Water imported: All volumes to be entered as: MILLION GALLONS (US) PER YEAR Water exported: << Enter grading in column 'E' Million gallons (US)/yr (MG/Yr) MG/Yr MG/Yr MG/Yr WATER SUPPLIED: MG/Yr. AUTHORIZED CONSUMPTION Click here: Billed metered:? MG/Yr Billed unmetered:? MG/Yr Unbilled metered:? MG/Yr Pcnt: Value: Unbilled unmetered:? MG/Yr 1.25% Default option selected for Unbilled unmetered - a grading of 5 is applied but not displayed AUTHORIZED CONSUMPTION:? MG/Yr WATER LOSSES (Water Supplied - Authorized Consumption) MG/Yr Apparent Losses Pcnt: Value: Unauthorized consumption:? MG/Yr 0.25% Default option selected for unauthorized consumption - a grading of 5 is applied but not displayed Customer metering inaccuracies:? MG/Yr Systematic data handling errors:? MG/Yr Apparent Losses:? Real Losses (Current Annual Real Losses or CARL) Real Losses = Water Losses - Apparent Losses:? MG/Yr WATER LOSSES: MG/Yr NON-REVENUE WATER NON-REVENUE WATER:? MG/Yr = Total Water Loss + Unbilled Metered + Unbilled Unmetered SYSTEM DATA Length of mains: Number of active AND inactive service connections: Connection density: COST DATA AWWA WLCC Free Water Audit Software: Reporting Worksheet? Click to access definition Average length of customer service line: Average operating pressure: Total annual cost of operating water system: Customer retail unit cost (applied to Apparent Losses): Variable production cost (applied to Real Losses): PERFORMANCE INDICATORS Financial Indicators Non-revenue water as percent by volume of Water Supplied: Non-revenue water as percent by cost of operating system: Annual cost of Apparent Losses: Annual cost of Real Losses: Operational Efficiency Indicators Apparent Losses per service connection per day: Real Losses per service connection per day*: Real Losses per length of main per day*: Real Losses per service connection per day per psi pressure: miles conn./mile main ft psi $/Year $/Million gallons gallons/connection/day gallons/connection/day gallons/mile/day gallons/connection/day/psi? Unavoidable Annual Real Losses (UARL): Not Valid *** UARL cannot be calculated as either average pressure, number of connecions or length of mains is too small: SEE UARL DEFINITION *** From Above, Real Losses = Current Annual Real Losses (CARL): 0.00 * only the most applicable of these two indicators will be calculated WATER AUDIT DATA VALIDITY SCORE: PRIORITY AREAS FOR ATTENTION: Based on the information provided, audit accuracy can be improved by addressing the following components: 1: Billed metered 2: Customer metering inaccuracies 3: Total annual cost of operating water system Infrastructure Leakage Index (ILI) [CARL/UARL]:????? Back to Instructions Please enter data in the white cells below. Where available, metered values should be used; if metered values are unavailable please estimate a value. Indicate your confidence in the accuracy of the input data by grading each component (1-10) using the drop-down list to the left of the input cell. Hover the mouse over the cell to obtain a description of the grades? Copyright 2010, American Water Works Association. All Rights Reserved.?????? Use buttons to select percentage of water supplied Enter a percentage less than 10% in the red cell (J42), or select 'Value' option (pipe length between curbstop and customer meter or property boundary) Add a grading value for 9 parameter(s) to enable an audit score to be calculated WAS v4.2 For more information, click here to see the Grading Matrix worksheet? OR value? for help using option buttons below? Click to access definition + Click to add a comment Water Audit Report for: Reporting Year: PLEASE CHOOSE REPORTING UNITS FROM THE INSTRUCTIONS SHEET BEFORE ENTERING DATA Master Meter Error Adjustments WATER SUPPLIED < Enter grading in column 'E' and 'J' > Pcnt: Value: Volume from own sources: AUTHORIZED CONSUMPTION Water imported: Water exported: Enter negative % or value for under-registration WATER SUPPLIED: Enter positive % or value for over-registration Billed metered: Billed unmetered:. Unbilled metered: +? Pcnt: Value: Unbilled unmetered: +? % AUTHORIZED CONSUMPTION:? WATER LOSSES (Water Supplied - Authorized Consumption) BETA TEST v1 Apparent Losses Pcnt: System Value: Attributes and Performance Indicators Unauthorized consumption: % +? Default option selected for unauthorized consumption - a grading of 5 is applied but not displayed Water Audit Report for: Customer metering inaccuracies: +? % Reporting Year: Systematic data handling errors: +? % ********** REPORTING UNITS MUST BE SELECTED ON THE INSTRUCTIONS WORKSHEET BEFORE PERFORMANCE INDICATORS CAN BE DISPLAYED ********** Apparent Losses:? System Attributes: Real Losses (Current Annual Real Losses or CARL) Real Losses = Water Losses - Apparent Losses: NON-REVENUE WATER = Water Losses + Unbilled Metered + Unbilled Unmetered SYSTEM DATA COST DATA BETA TEST v1 WATER LOSSES: NON-REVENUE WATER:? Length of mains: Number of active AND inactive service connections: Service connection density: Are customer meters typically located at the curbstop or property line? Average length of customer service line: Average operating pressure: Select... Apparent Losses per service connection per day: Total annual cost of operating water system: +? $/Year Real Losses per service connection per day: Customer retail unit cost (applied to Apparent Losses): +? Operational Efficiency: Real Losses per length of main per day*: Variable production cost (applied to Real Losses): +? $/ Use Customer Retail Unit Cost to value real losses Real Losses per service connection per day per meter (head) pressure: WATER AUDIT DATA VALIDITY SCORE: AWWA Free Water Audit Software: Reporting Worksheet << Please enter system details and contact information on the Instructions tab >> Please enter data in the white cells below. Where available, metered values should be used; if metered values are unavailable please estimate a value. Indicate your confidence in the accuracy of the input data by grading each component (1-10) using the drop-down list to the left of the input cell. Hover the mouse over the cell to obtain a description of the grades Default option selected for Unbilled unmetered - a grading of 5 is applied but not displayed ??????????? Performance Indicators: Use buttons to select percentage of water supplied (length of service line, beyond the Non-revenue property water as percent by volume of Water Supplied: boundary, Financial: that is the responsibility of the utility) Non-revenue water as percent by cost of operating system: Real Losses valued at Variable Production Cost? Infrastructure Leakage Index (ILI) [CARL/UARL]: PRIORITY AREAS FOR ATTENTION: Based on the information provided, audit accuracy can be improved by addressing the following components: * This performance indicator applies for systems with a low service connection density of less than 32 service connections/mile of pipeline + + +??? Click here: OR? for help using option buttons below WAS v5.0 American Water Works Association. Copyright 2014, All Rights Reserved.? AWWA Free Water Audit Software: Apparent Losses: + Real Losses: = Water Losses: Unavoidable Annual Real Losses (UARL): Annual cost of Apparent Losses: Annual cost of Real Losses: From Above, Real Losses = Current Annual Real Losses (CARL): WAS v5.0 American Water Works Association. Copyright 2014, All Rights Reserved. Valued at Variable Production Cost Return to Reporting Worksheet to change this assumpiton M36 1 st Ed. M36 2 nd Ed. M36 3 rd Ed. M36 4 th Ed AWWA Audit Software v1 AWWA Audit Software v4 AWWA Audit Software v5 ~7,000 downloads to date of AWWA Audit Software v5 AWWA Compiler for large audit sets WRF Real Loss Component Analysis Model
 Reporting Year: 2013 1/2013-12/2013 Please")
 using the drop-down list to the left of the input cell.")
37 AWWA Free Water Audit Software AWWA Free Water Audit Software: Reporting Worksheet WAS v5.0 American Water Works Association. Copyright 2014, All Rights Reserved.? Click to access definition + Click to add a comment Water Audit Report for: Northern San Leandro Combined Water Sewer Storm Utility District ( ) Reporting Year: / /2013 Please enter data in the white cells below. Where available, metered values should be used; if metered values are unavailable please estimate a value. Indicate your confidence in the accuracy of the input data by grading each component (n/a or 1-10) using the drop-down list to the left of the input cell. Hover the mouse over the cell to obtain a description of the grades All volumes to be entered as: MILLION GALLONS (US) PER YEAR To select the correct data grading for each input, determine the highest grade where the utility meets or exceeds all criteria for that grade and all grades below it. Master Meter Error Adjustments WATER SUPPLIED < Enter grading in column 'E' and 'J' > Pcnt: Value: Volume from own sources: +? 5 1, MG/Yr +? MG/Yr Water imported: +? MG/Yr +? MG/Yr Water exported: +? MG/Yr +? MG/Yr Enter negative % or value for under-registration WATER SUPPLIED: MG/Yr Enter positive % or value for over-registration. AUTHORIZED CONSUMPTION Click here:? Billed metered: +? MG/Yr for help using option Billed unmetered: +? MG/Yr buttons below Unbilled metered: +? MG/Yr Pcnt: Value: Unbilled unmetered: +? MG/Yr 1.25% MG/Yr Default option selected for Unbilled unmetered - a grading of 5 is applied but not displayed AUTHORIZED CONSUMPTION:? MG/Yr Use buttons to select percentage of water supplied OR WATER LOSSES (Water Supplied - Authorized Consumption) MG/Yr value Apparent Losses Pcnt: Value: Unauthorized consumption: +? MG/Yr 0.25% MG/Yr Customer metering inaccuracies: +? MG/Yr 1.00% MG/Yr Systematic data handling errors: +? MG/Yr 0.25% MG/Yr Apparent Losses: Real Losses (Current Annual Real Losses or CARL) Real Losses = Water Losses - Apparent Losses: WATER LOSSES: NON-REVENUE WATER NON-REVENUE WATER: = Water Losses + Unbilled Metered + Unbilled Unmetered SYSTEM DATA Unauthorized consumption volume entered is greater than the recommended default value MG/Yr MG/Yr MG/Yr MG/Yr Length of mains: +? miles Number of active AND inactive service connections: +? 6 1,000 Service connection density:? 10 conn./mile main??? Are customer meters typically located at the curbstop or property line? Yes (length of service line, beyond the property Average length of customer service line: +? ft boundary, that is the responsibility of the utility) Average length of customer service line has been set to zero and a data grading score of 10 has been applied Average operating pressure: +? psi Industry Standard (M36) Free Defaults provided ~10 Volume Inputs ~7 System Data Inputs COST DATA Total annual cost of operating water system: +? 5 $1,000,000 $/Year Customer retail unit cost (applied to Apparent Losses): +? 7 $3.50 $/1000 gallons (US) Variable production cost (applied to Real Losses): +? 7 $3, $/Million gallons Use Customer Retail Unit Cost to value real losses awwa.org/waterlosscontrol

38 IWA/AWWA Standard Water Balance Own Sources Water Imported Total System Input ( allow for known errors ) Water Exported Water Supplied Authorized Consumption Water Losses Billed Authorized Consumption Unbilled Authorized Consumption Apparent Losses Real Losses Revenue Water Non- Revenue Water Billed Water Exported Billed Metered Consumption Billed Unmetered Consumption Unbilled Metered Consumption Unbilled Unmetered Consumption Unauthorized Consumption Customer Metering Inaccuracies Systematic Data Handling Errors Leakage on Mains Leakage on Service Lines Leakage & Overflows at Storage
 Water Exported Water Supplied Billed Authorized")


39 Fire Dept Usage Operational Flushing Tools for control include efficient flushing practices and awareness campaigns Management of NRW Own Sources Water Imported ( allow for known errors ) Water Exported Water Supplied Billed Authorized Consumption Non-physical / revenue loss - slow meters, billing issues and theft Authorized Cost impacts at retail Consumption rate. Tools Total for control include data management, System quality Input control policies/practices, & meter testing & repair Unbilled Authorized Consumption Physical loss - leakage Cost impacts at wholesale rate Tools for control include Water leakage and Losses pressure management Apparent Losses Real Losses Revenue Water Non- Revenue Water Billed Water Exported Billed Metered Consumption Billed Unmetered Consumption Unbilled Metered Consumption Unbilled Unmetered Consumption Unauthorized Consumption Customer Metering Inaccuracies Systematic Data Handling Errors Leakage on Mains Leakage on Service Lines Leakage & Overflows at Storage
40 Audience Poll According to the AWWA M36 Water Audit Method, an acceptable level of Unaccounted For Water is: A. 15% B. 10% C. 5% D. 0%

41 Audience Poll According to the AWWA Water Audit Method, an acceptable level of Unaccounted For Water is: A.15% B. 10% C. 5% D.0%
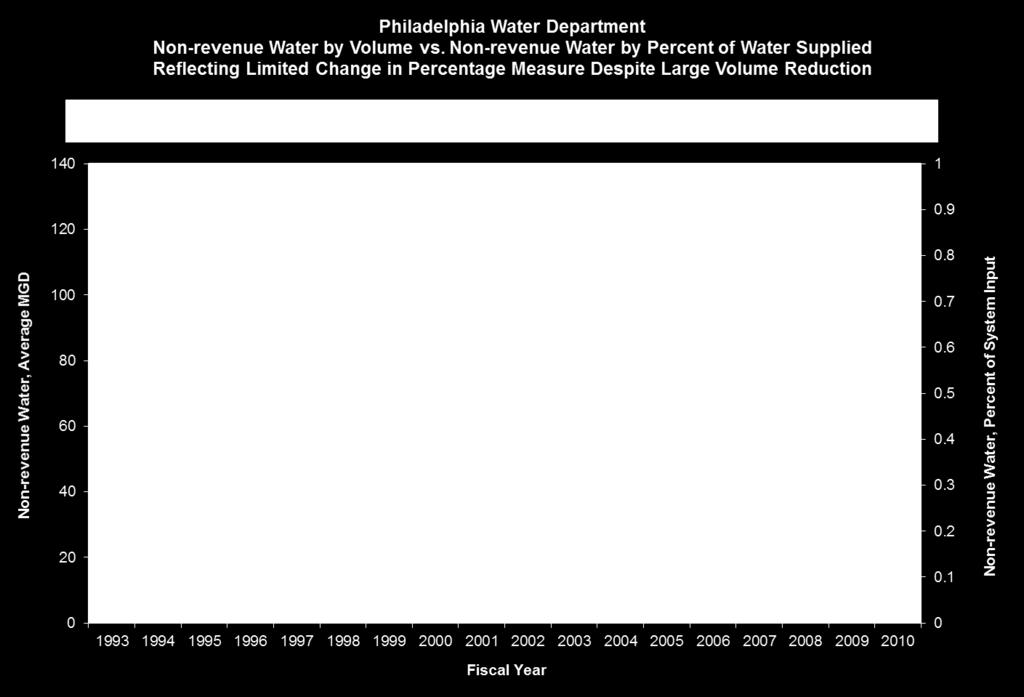
42 MGD Water Loss as a Percentage of Supply is not an Indicator of Performance Water Supplied (MGD) Authorized Consumption (MGD) Water Loss (MGD) Development Boom Great Recession, Rate Increases, Conservation New Normal 0 42
43 MGD Water Loss as a Percentage of Supply is not an Indicator of Performance Water Supplied (MGD) Authorized Consumption (MGD) Water Loss (MGD) Water Loss (Percent of Supply) 28% 26% 24% 22% 20% 18% 16% 14% 5 12% 0 10% 43

44 44
45 Unaccounted For Water Unaccounted For Water Percentage 45
46 2003 Inconsistent use and interpretation Unreliable indicator of performance Fails to segregate loss into its components for effective management 46


47 3-V s Volume MG per Year Gal/connection/day Leakage Index Value $ per Year Economic Loss Index Validity Water Audit Data Validity Score 95% Confidence Limits Key Data Input Grades
48 2,824 $2,341,420 per year Total Non-Revenue Water Volume (MG) Level 1 Billed Consumption NRW 10,097 Data Validity Score: 75 out of 100
49 Volume NRW Components - By Volume (MG) - Level 2 2,500 2,000 1,500 1, Value NRW Components - By Value Level 2 $1,800,000 $1,600,000 $1,400,000 $1,200,000 $1,000,000 $800,000 $600,000 $400,000 $200,000 - Real Loss Apparent Loss Unbilled Consumption $- Real Loss Apparent Loss Unbilled Consumption
50 Reported Leakage Background Leakage Volume NRW Components - By Volume (MG) Level 3 Value NRW Components - By Value Level 3 $1,800,000 $1,600,000 $1,400,000 $1,200,000 $1,000,000 Data Handling Theft Unreported Leakage Data Handling Meter Inaccuracy Theft Unbilled Metered Unbilled Unmetered Real Loss Apparent Loss Unbilled Consumption $800,000 $600,000 $400,000 $200,000 $0 Reported Leakage Background Leakage Unreported Leakage Real Loss Meter Inaccuracy Apparent Loss Unbilled Metered Unbilled Unmetered Unbilled Consumption
51 3000 Volume NRW Volume (MG/year) Value NRW Value ($/year) $2,500, $2,000, BG 1.5 M$ $1,500, Current 2,824 $1,000,000 Current $2,341, Economic Target 1,146 $500,000 Economic Target $839,130 0 $0
52 Four Pillars of Managing Apparent Loss Customer Meter Accuracy Existing Apparent Losses Theft Economic Level Unavoidable Apparent Losses Data Transfer / Archive Errors As each component receives more or less attention, the losses will increase or decrease Data Billing Errors Source: AWWA Water Loss Control Committee
53 COST Unavoidable Apparent Loss Validated Target Setting Where the total cost is at a minimum Economic Level of Loss Cost of Revenue Protection LOSSES (MG)


54 Four Pillars of Managing Leakage Active Leakage Control Existing Real Losses Speed & Quality of Repairs Economic Level Unavoidable Real Losses Pressure Management As each component receives more or less attention, the losses will increase or decrease Maintenance Rehab Repair Source: AWWA Water Loss Control Committee
55 COST Validated Target Setting Background Leakage and Reported Breaks Where the total cost is at a minimum Economic Level of Loss Cost of Leakage Control LOSSES (MG)
56 COST ($M) Aggressive Intervention is Over-Spending Example: replacement of pipes and meters before their optimal useful life Economic Optimum NRW & Intervention Economic target from benefit-cost design (M36) Reactive Intervention is Over-Spending Example: fixing only leaks that surface, replacing meters only when they stop New $M The GAP New Supply Total NRW Cost Cost of NRW Cost of Intervention NRW (Volume)
57 Basic Concepts 1. Create a water balance: separate Non-Revenue Water into Unbilled Consumption, Apparent Loss and Real Loss. 2. Test the validity: Data Validity Score & Metrics screening, gremlin hunting 3. Analyze the components of Unbilled Consumption, Apparent Loss and Real Loss. Use volumes & values. 4. Prioritize the components to make a plan of attack.
58 Basic Concepts 1. Create a water balance: separate Non-Revenue Water into Unbilled Consumption, Apparent Loss and Real Loss. 2. Test the validity: Data Validity Score & Metrics screening, gremlin hunting 3. Analyze the components of Unbilled Consumption, Apparent Loss and Real Loss. Use volumes & values. 4. Prioritize the components to make a plan of attack.


59 AWWA Free Water Audit Software Functions of the AWWA Software: Complete a water balance Document data validity grades Calculate performance indicators Identify areas for improvement

60 AWWA Free Water Audit Software for each input into the audit software COMMENTS DEFINITIONS DATA VALIDITY GRADES VOLUMES

61 Data Validity Grades qualitative but specific 1 through 10 capture utility practices
62 Filling out the Software 1. Gather data and supporting documents 2. Review data for each input: complete? consistent? accurate? 3. Enter the input. 4. Comment on source of data, quality of data, etc. 5. Select a data validity grade for each input

63 Performance Indicators
64 Results Dashboard
65 Basic Concepts 1. Create a water balance: separate Non-Revenue Water into Unbilled Consumption, Apparent Loss and Real Loss. 2. Test the validity: Data Validity Score & Metrics screening, gremlin hunting 3. Analyze the components of Unbilled Consumption, Apparent Loss and Real Loss. Use volumes & values. 4. Prioritize the components to make a plan of attack.
66 Validation of Inputs A Simple Approach 1. Assemble supporting documents Must-have docs Good-to-get docs 2. Develop the data inputs 3. Check the metrics Build it from supporting docs Look for gremlins Sanity check Inside typical ranges Metrics versus practices
 FWM Global Statistics Summary 45 40 39 total # meters Pass Finished Water")

67 Small Water System Technical Assistance Finished Water Meter Flow Verification (FWM) FWM Global Statistics Summary total # meters Pass Finished Water Meter Flow Verification Fail Inconclusive 33% UNTESTABLE 18% PASS 25 total # meters not tested 49% FAIL Pass Fail Inconclusive or Untestable

68 Gremlin Hunting

69 Gremlin Hunting 8 Propeller Meter Accuracy results from MFR test bench: 99.5% Check Valve Well Pump Accuracy results from insitu test: 142.2% Courtesy MESCO
70 Example of Water Pumping Data Gaps and Adjus Production flow data should be reviewed every business day for data gaps Gaps occur due to: Unplanned interruption: lightning strike, power failure Planned interruption: instrumentation calibration Gaps in water flow data should be quantified and added back to the daily total 8/15/2012, hrs High Service Pumping Rate, mgd actual flow High Service Pumping Rate, mgd raw recorded data 0: : : : : : : : : : : : : : : : : : : : : : : : : Hig Pumpin adju Total Average Difference 2.55 (Source: AWWA M36 Publication, 4 th
 Testing confirms the accuracy of the primary device the element that measures the flow of water Signal Calibration confirms the functions of the secondary device which is")
71 Checking the Meter Flow Testing vs. Calibration Flow (Accuracy) Testing confirms the accuracy of the primary device the element that measures the flow of water Signal Calibration confirms the functions of the secondary device which is a data transfer device, typically a differential pressure cell, chart recorder, or similar device Many water utilities regularly calibrate their secondary devices, but do not regularly verify the primary device by regular flow accuracy testing. Thus, inaccuracies can be carried through to reports Orifice Plate Flowmeter components (Source: AWWA M36 Publication, 4 th Ed.) Bank of Differential Pressure Cells connected to flowmeters (Courtesy of Louisville Water Company)
72 *** YOUR WATER AUDIT DATA VALIDITY SCORE IS: 62 out of 100 ***? Step 3 Check the Metrics Apparent Losses: MG/Yr + Real Losses: MG/Yr = Water Losses: MG/Yr Unavoidable Annual Real Losses (UARL): MG/Yr Annual cost of Apparent Losses: $821,449 Annual cost of Real Losses: $139,934 Valued at Variable Production Cost Return to Reporting Worksheet to change this assumpiton *** YOUR WATER AUDIT DATA VALIDITY SCORE IS: 51 out of 100 *** Typical Ranges Non-revenue water as percent by volume of Water Supplied: 26.0% Non-revenue water as percent by cost of operating system: 10.4% Real Losses valued at Variable Production Cost Apparent Losses per service connection per day: Real Losses per service connection per day: Real Losses per length of main per day*: Real Losses per service connection per day per psi pressure: gallons/connection/day gallons/connection/day N/A 2.55 gallons/connection/day/psi From Above, Real Losses = Current Annual Real Losses (CARL):? Infrastructure Leakage Index (ILI) [CARL/UARL]: million gallons/year ystems with a low service connection density of less than 32 service connections/mile of pipeline Metrics versus Practices Inside the range are they high, mid, or low? How does that compare to the water loss management practices?
73 Basic Concepts 1. Create a water balance: separate Non-Revenue Water into Unbilled Consumption, Apparent Loss and Real Loss. 2. Test the validity: Data Validity Score & Metrics screening, gremlin hunting 3. Analyze the components of Unbilled Consumption, Apparent Loss and Real Loss. Use volumes & values. 4. Prioritize the components to make a plan of attack.


74 Background Unreported Reported


75 =

76 Customer Meter Accuracy Testing Routine or periodic meter accuracy testing will quantify the accuracy level of the meter population Meter testing can be performed by testing companies or in-house by utilities with a test bench or portable test equipment Only skilled personnel should do testing; meter testing is a precision activity Make sure procedures are followed always test at the low flowrate first Set clear meter testing goals, such as: Test for high bill complaints Meters serving high water using customers Test a sample of meters retired from service Test high through-put meters (longevity) Test samples of newly purchased meters Suspect meters Utility Test Bench for testing water meters of size less than 3-inch


77 Sample Testing for Small Meters


78 Meter Accuracy (%) Total Flow Through Meter 250, , ,000 1,000,000 1,250,000

79 =
80 Graphic Courtesy WRF From a formula. Need to provide the ICF. From your repair records. Pressure Management Pressure Management Pressure Management


81 The Life of a Leak: Awareness, Location & Repair Times This is the basis for Leakage Component Analysis
82 Basic Data Needed for Component Analysis Failure Data 1. Break type: reported or unreported 2. Main or service 3. Location 4. Line size 5. Date/time the break became known 6. Date/time the break was fixed Other Data 7. Storage tank volume (total) 8. Average age of pipe network (approx.) 9. Data from your AWWA water audit
83 Real Loss Component Analysis Results REAL LOSS COMPONENT ANALYSIS RESULTS System Component Background Unreported Failures Reported Failures Leakage (Hidden Losses) Total (MG) (MG) (MG) (MG) Reservoirs Mains and Appurtenances Service Connections Total Annual Real Loss Real Losses as Calculated by Water Audit Hidden Losses/Unreported Leakage Currently Running Undetected 1,

84 Graphic Courtesy WRF Which Tools to Choose? Pressure Management Pressure Management Pressure Management Background Unreported Reported
85 Graphic Courtesy WRF Which Tools to Choose? Background Unreported Reported

86 Graphic Courtesy WRF Which Tools to Choose? Pressure Management Pressure Management Pressure Management Background Unreported Reported
87 Basic Concepts 1. Create a water balance: separate Non-Revenue Water into Unbilled Consumption, Apparent Loss and Real Loss. 2. Test the validity: Data Validity Score & Metrics screening, gremlin hunting 3. Analyze the components of Unbilled Consumption, Apparent Loss and Real Loss. Use volumes & values. 4. Prioritize the components to make a plan of attack.
88 The Toolbox (Basic) Helps to Address Level of Cost 1 - Validation of supply & consumption volumes 2 - Estimating and tracking unmetered use 3 - Installing meters on unmetered connections Low Data Validity Score, Gremlins Validity, Unmetered Use Unmetered Use 4 - Billing system audit Systematic Data Handling Errors Low-Mid None-Low Mid Low-Mid 5 - Meter testing & replacement Customer metering inaccuracy Mid-High 6 - Unidirectional flushing program Unbilled unmetered Low 7 - Acoustic leak survey Unreported leakage Mid 8 - Improve speed/quality of repairs Unreported, Reported leakage Low 9 - Locate & eliminate pressure transients (surges, hammers) All 3 types of leakage Low-Mid 10 - Reduce peak and overall pressure All 3 types of leakage Mid-High
89 Water Audit Report for: EXAMPLE - Tallapoosa ( ) Reporting Year: / /2014 ystem Attributes: erformance Indicators: Financial: *** YOUR WATER AUDIT DATA VALIDITY SCORE IS: 69 out of 100 ***? Apparent Losses: MG/Yr + Real Losses: MG/Yr = Water Losses: MG/Yr Unavoidable Annual Real Losses (UARL): See limits in definition MG/Yr Annual cost of Apparent Losses: $18,860 Annual cost of Real Losses: $123,614 Valued at Variable Production Cost Return to Reporting Worksheet to change this assumption Non-revenue water as percent by volume of Water Supplied: 26.5% Non-revenue water as percent by cost of operating system: 16.5% Real Losses valued at Variable Production Cost Operational Efficiency: Apparent Losses per service connection per day: Real Losses per service connection per day: Real Losses per length of main per day*: Real Losses per service connection per day per psi pressure: 6.05 gallons/connection/day gallons/connection/day N/A 0.95 gallons/connection/day/psi From Above, Real Losses = Current Annual Real Losses (CARL):? Infrastructure Leakage Index (ILI) [CARL/UARL]: million gallons/year This performance indicator applies for systems with a low service connection density of less than 32 service connections/mile of pipeline Background Unreported Reported
90 The Toolbox (Basic) Helps to Address Level of Cost 1 - Validation of supply & consumption volumes 2 - Estimating and tracking unmetered use 3 - Installing meters on unmetered connections Low Data Validity Score, Gremlins Validity, Unmetered Use Unmetered Use 4 - Billing system audit Systematic Data Handling Errors Low-Mid Mid Low-Mid 5 - Meter testing & replacement Customer metering inaccuracy Mid-High 6 - Unidirectional flushing program Unbilled unmetered Low 7 - Acoustic leak survey Unreported leakage Mid 8 - Improve speed/quality of repairs Unreported, Reported leakage Low 9 - Locate & eliminate pressure transients (surges, hammers) All 3 types of leakage Low-Mid 10 - Reduce peak and overall pressure All 3 types of leakage Mid-High
91 Water Audit Report for: #2 - City of Cave Spring (GA ) Reporting Year: / /2014 System Attributes: Performance Indicators: Financial: *** YOUR WATER AUDIT DATA VALIDITY SCORE IS: 52 out of 100 *** Apparent Losses: MG/Yr + Real Losses: MG/Yr = Water Losses: MG/Yr? Unavoidable Annual Real Losses (UARL): MG/Yr Annual cost of Apparent Losses: $30,992 Annual cost of Real Losses: $6,476 Valued at Variable Production Cost Return to Reporting Worksheet to change this assumption Non-revenue water as percent by volume of Water Supplied: 23.8% Non-revenue water as percent by cost of operating system: 4.8% Real Losses valued at Variable Production Cost Operational Efficiency: Apparent Losses per service connection per day: Real Losses per service connection per day: Real Losses per length of main per day*: Real Losses per service connection per day per psi pressure: 6.91 gallons/connection/day N/A gallons/connection/day gallons/mile/day N/A gallons/connection/day/psi From Above, Real Losses = Current Annual Real Losses (CARL):? Infrastructure Leakage Index (ILI) [CARL/UARL]: million gallons/year 1.05 * This performance indicator applies for systems with a low service connection density of less than 32 service connections/mile of pipeline Background Unreported Reported

92
Accounting For Loss Water & Revenues
 Accounting For Loss Water & Revenues Ohio Section AWWA Southeast/Southwest Districts Joint Spring Meeting Tom Schwing Deer Creek State Park April 21, 2016 AWWA Tools for Water Loss Control AWWA Free Water
Water Loss Control Tools. Software Tools for Supply Side Efficiency
 Water Loss Control Tools Software Tools for Supply Side Efficiency PNWS, April 2015 Today s Goals 1) What is Water Loss? (10 min) 2) Water Loss Baseline AWWA Audits (20 min) 3) Intervention Strategies
Using Performance Indicators as Part of a Water Audit
 Using Performance Indicators as Part of a Water Audit Smart Management for Small Water Systems What are Performance Indicators? A series of water loss measures that are consistent, repeatable and presented
Water Research Foundation 4372a
 Water Research Foundation 4372a Real Loss Component Analysis: What s Your Leakage Profile Project Team Downloading the 4372 Materials www.waterrf.org, then search for 4372 or real losses 7 The AWWA Water
PRODUCER ANNUITY SUITABILITY TRAINING REQUIREMENTS BY STATE As of September 11, 2017
 PRODUCER ANNUITY SUITABILITY TRAINING REQUIREMENTS BY STATE As of September 11, 2017 This document provides a summary of the annuity training requirements that agents are required to complete for each
Age of Insured Discount
 A discount may apply based on the age of the insured. The age of each insured shall be calculated as the policyholder s age as of the last day of the calendar year. The age of the named insured in the
Comparative Revenues and Revenue Forecasts Prepared By: Bureau of Legislative Research Fiscal Services Division State of Arkansas
 Comparative Revenues and Revenue Forecasts 2010-2014 Prepared By: Bureau of Legislative Research Fiscal Services Division State of Arkansas Comparative Revenues and Revenue Forecasts This data shows tax
Older consumers and student loan debt by state
 August 2017 Older consumers and student loan debt by state New data on the burden of student loan debt on older consumers In January, the Bureau published a snapshot of older consumers and student loan
The Acquisition of Regions Insurance Group. April 6, 2018
 The Acquisition of Regions Insurance Group April 6, 2018 Forward-Looking Statements This presentation contains "forward-looking statements" within the meaning of the Private Securities Litigation Reform
2016 Workers compensation premium index rates
 2016 Workers compensation premium index rates NH WA OR NV CA AK ID AZ UT MT WY CO NM MI VT ND MN SD WI NY NE IA PA IL IN OH WV VA KS MO KY NC TN OK AR SC MS AL GA TX LA FL ME MA RI CT NJ DE MD DC = Under
STATE MOTOR FUEL TAX INCREASES:
 STATE MOTOR FUEL TAX INCREASES: 2013-2018 Since 2013, 27 states have increased or adjusted taxes on motor fuel to support needed transportation investments. Twenty-four of those states increased their
Local Anesthesia Administration by Dental Hygienists State Chart
 Education or AK 1981 General Both Specific Yes WREB 16 hrs didactic; 6 hrs ; 8 hrs lab AZ 1976 General Both Accredited Yes WREB 36 hrs; 9 types of AR 1995 Direct Both Accredited/ Board Approved No 16 hrs
SIGNIFICANT PROVISIONS OF STATE UNEMPLOYMENT INSURANCE LAWS JANUARY 2008
 U.S. DEPARTMENT OF LABOR EMPLOYMENT AND TRAINING ADMINISTRATION Office Workforce Security SIGNIFICANT PROVISIONS OF STATE UNEMPLOYMENT INSURANCE LAWS JANUARY 2008 AL AK AZ AR CA CO CT DE DC FL GA HI /
Water Research Foundation 4372a. Real Loss Component Analysis: A Tool for Economic Water Loss Control
 Water Research Foundation 4372a Real Loss Component Analysis: A Tool for Economic Water Loss Control Project Team TECHNICAL TEAM Reinhard Sturm, Water Systems Optimization Kate Gasner, Water Systems Optimization
RLI TRANSPORTATION A Division of RLI Insurance Company 2970 Clairmont Road, Suite 1000 Atlanta, GA Phone: Fax:
 RLI TRANSPORTATION A Division of RLI Insurance Company 2970 Clairmont Road, Suite 1000 Atlanta, GA 30329 Phone: 404-315-9515 Fax: 404-315-6558 AGENCY/BROKER PROFILE Please type your answers. Use a separate
STATE MOTOR FUEL TAX INCREASES:
 Since 2013, 26 states have increased or adjusted taxes on motor fuel to support needed transportation investments. Twenty-three of those states increased their state gas tax, while three states Kentucky,
Cost and Coverage Implications of the ACA Medicaid Expansion: National and State by State Analysis
 Cost and Coverage Implications of the ACA Medicaid Expansion: National and State by State Analysis Report Authors: John Holahan, Matthew Buettgens, Caitlin Carroll, and Stan Dorn Urban Institute November
The Lincoln National Life Insurance Company Term Portfolio
 The Lincoln National Life Insurance Company Term Portfolio State Availability as of 7/16/2018 PRODUCTS AL AK AZ AR CA CO CT DE DC FL GA GU HI ID IL IN IA KS KY LA ME MP MD MA MI MN MS MO MT NE NV NH NJ
BEST PRACTICE 3: System Water Loss Control Overview Why a Best Practice? State Planning Requirements
 BEST PRACTICE 3: System Loss Control Foundational best practice Utility operations - implemented by water utilities on their own system Customer participation not applicable Overview loss control is the
Property Tax Relief in New England
 Property Tax Relief in New England January 23, 2015 Adam H. Langley Senior Research Analyst Lincoln Institute of Land Policy www.lincolninst.edu Property Tax as a % of Personal Income OK AL IN UT SD MS
MEMORANDUM. SUBJECT: Benchmarks for the Second Half of 2008 & 12 Months Ending 12/31/08
 MEMORANDUM TO: FROM: HR Investment Center Members Matt Cinque, Managing Director DATE: March 12, 2009 SUBJECT: Benchmarks for the Second Half of 2008 & 12 Months Ending 12/31/08 Please find enclosed the
WRF Webcast. A Snapshot of Water Loss: Examining the Country s Water Audit Submissions
 No part of this presentation may be copied, reproduced, or otherwise utilized without permission. WRF Webcast A Snapshot of Water Loss: Examining the Country s Water Audit Submissions November 5, 2015
SCHIP: Let the Discussions Begin
 Figure 0 SCHIP: Let the Discussions Begin Diane Rowland, Sc.D. Executive Vice President, Henry J. Kaiser Family Foundation and Executive Director, Kaiser Commission on for Alliance for Health Reform February
Alaska Transportation Finance Study Alaska Municipal League
 Alaska Transportation Finance Study Alaska Municipal League presented to Alaska House Transportation Committee presented by Christopher Wornum Cambridge Systematics, Inc. February 12, 2009 Transportation
State Trust Fund Solvency
 Unemployment Insurance State Trust Fund Solvency National Employment Law Project Conference - Washington DC December 7, 2009 Robert Pavosevich pavosevich.robert@dol.gov Unemployment Insurance Program
Eye on the South Carolina Housing Market presented at 2008 HBA of South Carolina State Convention August 1, 2008
 Eye on the South Carolina Housing Market presented at 28 HBA of South Carolina State Convention August 1, 28 Robert Denk Assistant Staff Vice President, Forecasting & Analysis 2, US Single Family Housing
Taxing Investment Income in the States New Hampshire Fiscal Policy Institute 2 nd Annual Budget and Policy Conference Concord, NH January 23, 2015
 Taxing Investment Income in the States New Hampshire Fiscal Policy Institute 2 nd Annual Budget and Policy Conference Concord, NH January 23, 2015 Norton Francis State and Local Finance Initiative Urban-Brookings
Black Knight Mortgage Monitor
 Black Knight Mortgage Monitor Mortgage Market Performance Observations Data as of May, 2014 Month-end Black Knight First Look May 2014 Total U.S. loan delinquency rate (loans 30 or more days past due,
ehealth, Inc Fall Cost Report for Individual and Family Policyholders
 ehealth, Inc. 2010 Fall Cost Report for and Family Policyholders Table of Contents Page Methodology.................................................................. 2 ehealth, Inc. 2010 Fall Cost Report
COMPARISON OF ABA MODEL RULE FOR REGISTRATION OF IN-HOUSE COUNSEL WITH STATE VERSIONS
 As of September 7, 2016 2016 American Bar Association COMPARISON OF ABA MODEL RULE FOR REGISTRATION OF IN-HOUSE COUNSEL WITH STATE VERSIONS AMERICAN BAR ASSOCIATION CENTER FOR PROFESSIONAL RESPONSIBILITY
Corporate Income Tax and Policy Considerations
 Corporate Income Tax and Policy Considerations Presentation by Richard Anklam, Executive Director, New Mexico Tax Research Institute To The Interim Revenue Stabilization and Tax Policy Committee September
States and Medicaid Provider Taxes or Fees
 March 2016 Fact Sheet States and Medicaid Provider Taxes or Fees Medicaid is jointly financed by states and the federal government. Provider taxes are an integral source of Medicaid financing governed
Black Knight Mortgage Monitor
 Black Knight Mortgage Monitor Mortgage Market Performance Observations Data as of April, 2014 Month-end Black Knight First Look April 2014 2 Focus Points Prepayment activity and originations ARM loans
Zions Bank Economic Overview
 Zions Bank Economic Overview Jackson Hole Mountain Resort March 20, 2018 National Economic Conditions When Good News is Bad News Is Good News?? Dow Tops 26,000 Up 44% Since 2016 Election Source: Wall Street
Obamacare in Pictures
 Obamacare in Pictures VISUALIZING THE EFFECTS OF THE PATIENT PROTECTION AND AFFORDABLE CARE ACT Spring 2014 If you like your health care plan, can you really keep it? At least 4.7 million health care plans
TCJA and the States Responding to SALT Limits
 TCJA and the States Responding to SALT Limits Kim S. Rueben Tuesday, January 29, 2019 1 What does this mean for Individuals under TCJA About two-thirds of taxpayers will receive a tax cut with the largest
Yolanda K. Kodrzycki New England Public Policy Center Federal Reserve Bank of Boston
 The Growing Instability of Revenues over the Business Cycle: Putting the New England States in Perspective Yolanda K. Kodrzycki New England Public Policy Center Federal Reserve Bank of Boston Lincoln Institute
Long-Term Care Education Requirements Prior to Selling
 for Training AK All Health 8 hrs 4 hrs 24 months AL All Accident & Health 8 hrs 4 hrs Renewal deadline is the date the license expires. s are renewed biennially based on agent's birth month and year. AR
Refinance Report August 2012
 This report contains data on refinance program activity of Fannie Mae and Freddie Mac (the Enterprises) through. Report Highlights Refinance volume continued to be strong in August as 30-year mortgage
State Treatment of Social Security Treatment of Pension Income Other Income Tax Breaks Property Tax Breaks
 State-By-State Tax Breaks for Seniors, 2016 State Treatment of Social Security Treatment of Pension Income Other Income Tax Breaks Property Tax Breaks AL Payments from defined benefit private plans are
Long-Term Care Education Requirements Prior to Selling
 for AK All Health 8 hrs 4 hrs 24 months AL All Accident & Health 8 hrs 4 hrs Renewal deadline is the date the license expires. s are renewed biennially based on agent's birth month and year. AR All Accident,
Percent of Employees Waiving Coverage 27.0% 30.6% 29.1% 23.4% 24.9%
 Number of Health Plans Reported 18,186 3,561 681 2,803 3,088 Offer HRA or HSA 34.0% 42.7% 47.0% 39.7% 35.0% Annual Employer Contribution $1,353 $1,415 $1,037 $1,272 $1,403 Percent of Employees Waiving
State of the Automotive Finance Market
 State of the Automotive Finance Market A look at loans and leases in Q4 2017 Presented by: Melinda Zabritski Sr. Director, Financial Solutions www.experian.com/automotive 2018 Experian Information Solutions,
Indexed Universal Life Caps
 Indexed Universal Life Caps Effective March 15, 2013, the caps on FG Life-Elite II will be changing as follows: Cap Illustrative Rate 100% Participation Annual Point-to-Point 14.75% 8.32% 140% Participation
Fiduciary Tax Returns
 Functions and Procedures Index Books On Line Main Directory Overview... 2 How does it work?... 3 What Information is transmitted to the Tax Service?... 4 How do I initiate this service?... 8 Do I have
Detailed Claim Information (DCI) Advanced Reporting Concepts. Objectives
 Advanced Reporting Concepts. Objectives") Detailed Claim Information (DCI) Advanced Reporting Concepts Presented by: Warren Danz and Bruce Hallman Copyright 2015 National Council on on Compensation Insurance, Inc. Inc. All All Rights Reserved.
Detailed Claim Information (DCI) Advanced Reporting Concepts Presented by: Warren Danz and Bruce Hallman Copyright 2015 National Council on on Compensation Insurance, Inc. Inc. All All Rights Reserved.
CONSTRUCTION RISK MITIGATION THROUGH CONFORMITY ASSESSMENT
 CONSTRUCTION RISK MITIGATION THROUGH CONFORMITY ASSESSMENT Graham Brent, Chief Executive Officer National Commission for the Certification of Crane Operators (NCCCO) World Standards Week ANSI-SPRING Services
2017 Supplemental Tax Information
 2017 Supplemental Tax Information We have compiled the following information to help you prepare your 2017 federal and state tax returns: - Percentage of income from U.S. government obligations - Federal
Texas Economic Outlook: Cruising in Third Gear
 Texas Economic Outlook: Cruising in Third Gear Keith Phillips Assistant Vice President and Senior Economist 1/19/17 The views expressed in this presentation are strictly those of the presenter and do not
Zions Bank Economic Overview
 Zions Bank Economic Overview Utah League of Cities and Towns June 18, 2018 Utah Economic Conditions CA 0.6% OR 1.4% WA 1.7% NV 2.0% Utah Population 3 rd Fastest Growing in U.S. ID 2.2% UT 1.9% AZ 1.6%
Premium Savings Program Broker Training
 Quality health plans & benefits Healthier living Financial well-being Intelligent solutions Premium Savings Program Broker Training April 2013 We are responding to ACA changes Pricing volatility Rate shock
INTERIM SUMMARY REPORT ON RISK ADJUSTMENT FOR THE 2016 BENEFIT YEAR
 DEPARTMENT OF HEALTH & HUMAN SERVICES Centers for Medicare & Medicaid Services Center for Consumer Information and Insurance Oversight 200 Independence Avenue SW Washington, DC 20201 INTERIM SUMMARY REPORT
Marilyn Tavenner, CMS Administrator Don Moulds, Acting Assistant Secretary for Planning and Evaluation
 TO: The Secretary Through: DS COS ES FROM: Marilyn Tavenner, CMS Administrator Don Moulds, Acting Assistant Secretary for Planning and Evaluation DATE: September 5, 2013 SUBJECT: Projected Monthly Targets
Obamacare in Pictures. Visualizing the Effects of the Patient Protection and Affordable Care Act
 Visualizing the Effects of the Patient Protection and Affordable Care Act Fall 2012 expands dependence on government health care dumps millions into Medicaid and creates new federal subsidies for government-approved
Just The Facts: On The Ground SIF Utilization
 Just The Facts: On The Ground SIF Utilization The Access 4 Learning Community (A4L), previously the SIF Association, has changed its brand name due to the fact that the majority of its 3,000 members represent
Unemployment Insurance Benefit Adequacy: How many? How much? How Long?
 Unemployment Insurance Benefit Adequacy: How many? How much? How Long? Joel Sacks, Deputy Commissioner Washington State Employment Security Department March 1, 2012 1 Outline How many get unemployment
Union Construction Labor Cost Trends and Outlook 2018
 Union Construction Labor Cost Trends and Outlook 2018 Copyright 2018 This report contains both general and detailed data on union labor rates for craft workers in the construction industry. Data are presented
2018 ADDENDUM INSTRUCTIONS
 2018 ADDENDUM INSTRUCTIONS FEBRUARY 22, 2019 UPDATE: 2018 MUNICIPAL REFERENCE BOOK 1. DELAWARE funds are listed on page 15. You may note on page 15 to see the addendum for additional Delaware funds. The
Plunging Crude Prices: Impact on U.S. and State Economies
 Plunging Crude Prices: Impact on U.S. and State Economies Mine Yücel Senior Vice President and Director of Research August 7, 215 Oil and gas prices plunge Nominal price, $, weekly 16 14 12 Oil Price 1
Florida 1/1/2016 Workers Compensation Rate Filing
 Florida 1/1/2016 Workers Compensation Rate Filing Kirt Dooley, FCAS, MAAA October 21, 2015 1 $ Billions 4.0 3.5 3.0 2.5 2.0 1.5 1.0 0.5 0.0 Florida s Workers Compensation Premium Volume 2.368 0.765 0.034
The Entry, Performance, and Viability of De Novo Banks
 The Entry, Performance, and Viability of De Novo Banks Yan Lee and Chiwon Yom* FEDERAL DEPOSIT INSURANCE CORPORATION *The views expressed here are solely of the authors and do not necessarily reflect the
2018 National Electric Rate Study
 2018 National Electric Rate Study Ranking of Typical Residential, Commercial and Industrial Electric Bills LES Administrative Board June 15, 2018 Emily N. Koenig Director of Finance & Rates 1 Why is the
Who s Above the Social Security Payroll Tax Cap? BY NICOLE WOO, JANELLE JONES, AND JOHN SCHMITT*
 Issue Brief September 2011 Center for Economic and Policy Research 1611 Connecticut Ave, NW Suite 400 Washington, DC 20009 tel: 202-293-5380 fax: 202-588-1356 www.cepr.net Who s Above the Social Security
Tax Breaks for Elderly Taxpayers in the States in 2016
 AL Payments from defined benefit private plans are exempt; most public systems are exempt; military and US Civil service are exempt Special Homestead ion for 65+ +25.2% +2.4% AK No PIT Homestead ion for
Uniform Consent to Service of Process
 Applicant Company Name: NAIC No. FEIN: Uniform Consent to Service of Process Original Designation Amended Designation (must be submitted directly to states) Applicant Company Name: Previous Name (if applicable):
Medicare Alert: Temporary Member Access
 Medicare Alert: Temporary Member Access Plan Sponsor: Coventry/Aetna Medicare Part D Effective Date: Jan. 12, 2015 Geographic Area: National If your pharmacy is a Non Participating provider in the Aetna/Coventry
Tax Freedom Day 2018 is April 19th
 Apr. 2018 Tax Freedom Day 2018 is April 19th Erica York Analyst Key Findings Tax Freedom Day is a significant date for taxpayers and lawmakers because it represents how long Americans as a whole have to
PRODUCTS CURRENTLY AVAILABLE FOR SALE. Marquis SP
 INTEREST RATES - April 16, 2017 to May 15, 2017 Notices 1. Before soliciting or taking any annuity applications, it is required that you have completed Lafayette Life's Annuity Training and any Continuing
Charles Gullickson (Penn Treaty/ANIC Task Force Chair), Richard Klipstein (NOLHGA)
, Richard Klipstein (NOLHGA)") MEMO DATE: TO: Charles Gullickson (Penn Treaty/ANIC Task Force Chair), Richard Klipstein (NOLHGA) FROM: Vincent L. Bodnar, ASA, MAAA RE: Penn Treaty Network American Insurance Company and American Network
MEMO DATE: TO: Charles Gullickson (Penn Treaty/ANIC Task Force Chair), Richard Klipstein (NOLHGA) FROM: Vincent L. Bodnar, ASA, MAAA RE: Penn Treaty Network American Insurance Company and American Network
Tax Freedom Day 2019 is April 16th
 Apr. 2019 Tax Freedom Day 2019 is April 16th Erica York Economist Madison Mauro Research Assistant Emma Wei Research Assistant Key Findings This year, Tax Freedom Day falls on April 16, or 105 days into
Insured Deposit Program. Updated 03/31/2017
 Insured Deposit Program Welcome to the FDIC Insured Deposit Program. Under this program, available cash balances (from security transactions, dividend and interest payments and other activities) in your
Alternative Paths to Medicaid Expansion
 Alternative Paths to Medicaid Expansion Robin Rudowitz Kaiser Commission on Medicaid and the Uninsured Kaiser Family Foundation National Health Policy Forum March 28, 2014 Figure 1 The goal of the ACA
2016 GEHA. dental. FEDVIP Plans. let life happen. gehadental.com
 2016 GEHA dental FEDVIP Plans let life happen gehadental.com Smile, you re covered, with great benefits and a large national network. High maximum benefits $25,000 for High Option Growing network of dentists
Building a culture of engagement Bryan Crowell AVP Continuous Improvement Intermountain Healthcare
 Building a culture of engagement Bryan Crowell AVP Continuous Improvement Intermountain Healthcare I N T E R M O U N TA I N H E A LT H C A R E Hospitals Since 1975 22 hospitals 2,784 licensed beds $6.1
Installment Loans CHARTS. No cap other than unconscionability:
 NCLC NATIONAL CONSUMER LAW CENTER Installment Loans WILL STATES PROTECT BORROWERS FROM A NEW WAVE OF PREDATORY LENDING? Copyright 2015, National Consumer Law Center, Inc. CHARTS CHART 1 Full APRs Allowed
State Budget Cuts Presentation to the Pennsylvania Senate Government Management & Cost Study Commission March 22,2010
 State Budget Cuts Presentation to the Pennsylvania Senate Government Management & Cost Study Commission March 22,2010 Luke Martel Fiscal Affairs Program Overview The state revenue nightmare continues.
Insured Deposit Program Updated 10/17/2016
 Insured Deposit Program Welcome to the FDIC Insured Deposit Program. Under this program, available cash balances (from security transactions, dividend and interest payments and other activities) in your
COMMUNITY CREDIT CHART BOOK
 2016 COMMUNITY CREDIT CHART BOOK FEDERAL RESERVE B ANK of NEW YORK Editors Kausar Hamdani, Ph.D. SVP and Senior Advisor Claire Kramer Mills, Ph.D. AVP and Community Affairs Officer Data Support Jessica
Massachusetts Budget and Policy Center
 Progressive Massachusetts 2013 Policy Conference March 24, 2013 Lasell College Newton, MA Presentation by Massachusetts Budget and Policy Center Our State Budget: Building a Better Future Together Massachusetts
Multistate indirect tax trends and policies
 Multistate indirect tax trends and policies Disclaimer EY refers to the global organization, and may refer to one or more, of the member firms of Ernst & Young Global Limited, each of which is a separate
Introduction to the Individual LTC Standards of the Interstate Insurance Product Regulation Commission (IIPRC) March 2011
 March 2011") Introduction to the Individual LTC Standards of the Interstate Insurance Product Regulation Commission (IIPRC) March 2011 Karen Schutter, Executive Director, IIPRC Marie Roche, Assistant Vice President,
Introduction to the Individual LTC Standards of the Interstate Insurance Product Regulation Commission (IIPRC) March 2011 Karen Schutter, Executive Director, IIPRC Marie Roche, Assistant Vice President,
50% are at or over 48, 50% are at or under 48 years of age (median) Cancer/Tumor registrars taking the survey ranged in age from 22 to 69
 Cancer/Tumor registrars taking the survey ranged in age from 22 to 69") Cancer/Tumor Registrar Summary Cancer/Tumor Registrar Total Responses: 238, with 210 full-time and 28 part-time registrars responding. We also polled 72 Cancer/Tumor Registry Managers. Cancer Registrar
Cancer/Tumor Registrar Summary Cancer/Tumor Registrar Total Responses: 238, with 210 full-time and 28 part-time registrars responding. We also polled 72 Cancer/Tumor Registry Managers. Cancer Registrar
Texas Economic Outlook: Strong Growth Continues
 Texas Economic Outlook: Strong Growth Continues Keith Phillips Assistant Vice President and Senior Economist 1/23/18 The views expressed in this presentation are strictly those of the presenter and do
Aviva Announcing Changes to Products and Annuity Rates
 September 9, 2011 Aviva Announcing Changes to Products and Annuity Rates This field update contains information on product and rate changes effective September 16, 2011. We want to thank you for all of
< Executive Summary > Ready Mixed Concrete Industry Data Report Edition
 Ready Mixed Concrete Industry Data Report A benchmarking tool for planning, evaluating and directing the financial activities of your organization. 2012 Edition (2011 data) < Executive Summary > Prepared
The Affordable Care Act (ACA)
") The Affordable Care Act (ACA) An Overview by the Kaiser Family Foundation NBC News Editorial Roundtable June 26, 2013 1. The Basics of the Affordable Care Act (ACA) Expanded Medicaid Coverage Starting
The Affordable Care Act (ACA) An Overview by the Kaiser Family Foundation NBC News Editorial Roundtable June 26, 2013 1. The Basics of the Affordable Care Act (ACA) Expanded Medicaid Coverage Starting
The State Tax Implications of Federal Tax Reform Legislation
 The State Tax Implications of Federal Tax Reform Legislation Executive Committee Task Force on State and Local Taxation Phoenix, Arizona January 14, 2017 Joe Crosby, Multistate Associates Karl Frieden,
Warehouse Application Corporate Information. Structure. State Lender/Broker Licenses. Agency Approvals
 Legal Name of Organization: Warehouse Application Corporate Information Requested Facility Amount DBA name(s) (if applicable): Street Address: City: State: Zip: Main Phone #: Main Fax #: Person to Contact
Oregon: Where Taxes Are Low, Fees Are High and Revenue Is Slightly Below Average
 Issue Brief March 6, 2012 Oregon: Where Taxes Are Low, Fees Are High and Revenue Is Slightly Below Average The money we pay in fees and taxes helps create jobs, build a strong economy, and preserve Oregon
Evaluation of the Oklahoma State Park System. Lowell Caneday, Ph.D. Deb Jordan, Re.D.
 Evaluation of the Oklahoma State Park System Lowell Caneday, Ph.D. Deb Jordan, Re.D. Research Team n Oklahoma State University, Leisure Studies n Dr. Lowell Caneday, Dr. Deb Jordan, Dr. Yating Liang n
Plunging Oil Prices: Impact on the U.S. and State Economies
 Plunging Oil Prices: Impact on the U.S. and State Economies Mine Yücel Senior Vice President and Director of Research November 17, 216 Nominal price, weekly 16 14 Oil and gas prices volatile 12 1 Oil price
Getting Better Value for the Healthcare Dollar. National Conference of State Legislators Fall Forum November 30, 2011.
 Getting Better Value for the Healthcare Dollar National Conference of State Legislators Fall Forum November 30, 2011 NCQA History NCQA a non-profit that for 21 years has worked with federal, state, consumer
IMPROVING COLLEGE ACCESS
 IMPROVING COLLEGE ACCESS Grants and Resources for Education Leaders West Virginia Leaders of Education Conference December 3, 2018 THE EDUCATION ALLIANCE Statewide non-profit organization W E brings B
2018 Texas Economic Outlook: Firing on All Cylinders
 218 Texas Economic Outlook: Firing on All Cylinders Keith Phillips Assistant Vice President and Senior Economist 4/5/218 The views expressed in this presentation are strictly those of the presenter and
Executive Summary. Introduction
 Date: Regarding: 2014-2017 United States Animal Loss Claims (External Dissemination) Prepared by: David Fennig, Strategic Analyst Executive Summary The purpose of this ForeCAST SM is to analyze claims
Workers Compensation Ratemaking An Overview
 Antitrust Notice The Casualty Actuarial Society is committed to adhering strictly to the letter and spirit of the antitrust laws. Seminars conducted under the auspices of the CAS are designed solely to
Streamlined Sales Tax Governing Board and Business Advisory Council Update
 Streamlined Sales Tax Governing Board and Business Advisory Council Update Charles Collins, ADP Fred Nicely, Council On State Taxation Craig Johnson, Streamlined Sales Tax Governing Board NCSL SALT Taskforce
ACORD Forms Updated in AMS R1
 ACORD Forms Updated in AMS360 2017 R1 The following forms will use the ACORD form viewer, also new in this release. Forms with an indicate they were added because of requests in the Product Enhancement
Section 4(f) That was then this is now. Recent developments in Section 4(f) compliance
 That was then this is now. Recent developments in Section 4(f) compliance") Section 4(f) That was then this is now Recent developments in Section 4(f) compliance Section 4(f) of the 1966 DOT Act The Secretary may approve a transportation program or project requiring the use of
Section 4(f) That was then this is now Recent developments in Section 4(f) compliance Section 4(f) of the 1966 DOT Act The Secretary may approve a transportation program or project requiring the use of
36 Million Without Health Insurance in 2014; Decreases in Uninsurance Between 2013 and 2014 Varied by State
 36 Million Without Health Insurance in 2014; Decreases in Uninsurance Between 2013 and 2014 Varied by State An estimated 36 million people in the United States had no health insurance in 2014, approximately